Median Home Prices and Estimated Monthly Payments Decreased Significantly Between 2005-2010 in Many Major Metro Areas
•
2 likes•362 views

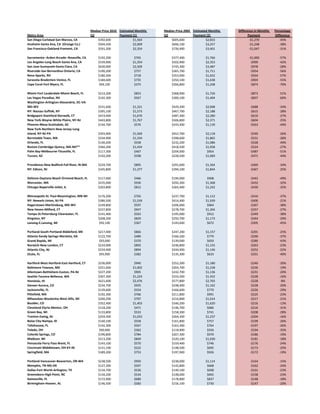
The document compares median home prices and estimated monthly mortgage payments in 2010 and 2005 for various metro areas in the United States. It shows that for most metro areas, median home prices and monthly payments decreased between 2005 and 2010, with percentage decreases typically ranging from 5-50%. The largest decreases were in Florida metro areas like Cape Coral-Fort Myers and Orlando, which saw monthly payment decreases of over 50%.

Recommended
Recommended
More Related Content
What's hot
What's hot (12)
Viewers also liked
Viewers also liked (20)
Similar to Median Home Prices and Estimated Monthly Payments Decreased Significantly Between 2005-2010 in Many Major Metro Areas
Similar to Median Home Prices and Estimated Monthly Payments Decreased Significantly Between 2005-2010 in Many Major Metro Areas (20)
More from NAR Research
More from NAR Research (20)
Recently uploaded
Recently uploaded (20)
Median Home Prices and Estimated Monthly Payments Decreased Significantly Between 2005-2010 in Many Major Metro Areas
- 1. Median Price 2010 Estimated Monthly Median Price 2005 Estimated Monthly Difference in Monthly Percentage Metro Area Q2 Payment (1) Q2 Payment (2) Payment Difference San Diego-Carlsbad-San Marcos, CA $392,600 $1,564 $605,600 $2,833 -$1,270 -45% Anaheim-Santa Ana, CA (Orange Co.) $504,500 $2,009 $696,100 $3,257 -$1,248 -38% San Francisco-Oakland-Fremont, CA $591,200 $2,354 $726,900 $3,401 -$1,047 -31% Sacramento--Arden-Arcade--Roseville, CA $192,200 $765 $377,400 $1,766 -$1,000 -57% Los Angeles-Long Beach-Santa Ana, CA $339,900 $1,354 $502,900 $2,353 -$999 -42% San Jose-Sunnyvale-Santa Clara, CA $630,000 $2,509 $745,300 $3,487 -$978 -28% Riverside-San Bernardino-Ontario, CA $190,200 $757 $365,700 $1,711 -$954 -56% Reno-Sparks, NV $180,300 $718 $353,000 $1,652 -$934 -57% Sarasota-Bradenton-Venice, FL $184,600 $735 $350,100 $1,638 -$903 -55% Cape Coral-Fort Myers, FL $94,100 $375 $266,800 $1,248 -$874 -70% Miami-Fort Lauderdale-Miami Beach, FL $214,200 $853 $368,900 $1,726 -$873 -51% Las Vegas-Paradise, NV $142,300 $567 $300,100 $1,404 -$837 -60% Washington-Arlington-Alexandria, DC-VA- MD-WV $331,600 $1,321 $429,200 $2,008 -$688 -34% NY: Nassau-Suffolk, NY $395,100 $1,573 $467,700 $2,188 -$615 -28% Bridgeport-Stamford-Norwalk, CT $419,400 $1,670 $487,300 $2,280 -$610 -27% New York-Wayne-White Plains, NY-NJ $443,800 $1,767 $506,800 $2,371 -$604 -25% Phoenix-Mesa-Scottsdale, AZ $144,700 $576 $243,400 $1,139 -$563 -49% New York-Northern New Jersey-Long Island, NY-NJ-PA $393,900 $1,569 $452,700 $2,118 -$549 -26% Barnstable Town, MA $334,900 $1,334 $398,600 $1,865 -$531 -28% Orlando, FL $140,200 $558 $232,200 $1,086 -$528 -49% Boston-Cambridge-Quincy, MA-NH** $360,200 $1,434 $418,500 $1,958 -$524 -27% Palm Bay-Melbourne-Titusville, FL $117,300 $467 $204,000 $954 -$487 -51% Tucson, AZ $150,200 $598 $228,500 $1,069 -$471 -44% Providence-New Bedford-Fall River, RI-MA $224,700 $895 $291,600 $1,364 -$469 -34% NY: Edison, NJ $345,800 $1,377 $394,100 $1,844 -$467 -25% Deltona-Daytona Beach-Ormond Beach, FL $117,000 $466 $194,000 $908 -$442 -49% Worcester, MA $235,000 $936 $292,300 $1,368 -$432 -32% Chicago-Naperville-Joliet, IL $203,800 $812 $265,400 $1,242 -$430 -35% Minneapolis-St. Paul-Bloomington, MN-WI $176,200 $702 $237,700 $1,112 -$410 -37% NY: Newark-Union, NJ-PA $386,500 $1,539 $414,400 $1,939 -$400 -21% Hagerstown-Martinsburg, MD-WV $149,800 $597 $206,000 $964 -$367 -38% New Haven-Milford, CT $237,800 $947 $278,700 $1,304 -$357 -27% Tampa-St.Petersburg-Clearwater, FL $141,400 $563 $195,000 $912 -$349 -38% Kingston, NY $208,200 $829 $250,700 $1,173 -$344 -29% Lansing-E.Lansing, MI $92,100 $367 $143,600 $672 -$305 -45% Portland-South Portland-Biddeford, ME $217,400 $866 $247,200 $1,157 -$291 -25% Atlanta-Sandy Springs-Marietta, GA $122,700 $489 $166,500 $779 -$290 -37% Grand Rapids, MI $93,000 $370 $139,000 $650 -$280 -43% Norwich-New London, CT $224,000 $892 $246,800 $1,155 -$263 -23% Atlantic City, NJ $224,400 $894 $244,900 $1,146 -$252 -22% Ocala, FL $95,900 $382 $135,300 $633 -$251 -40% Hartford-West Hartford-East Hartford, CT $236,000 $940 $252,200 $1,180 -$240 -20% Baltimore-Towson, MD $251,600 $1,002 $264,700 $1,238 -$236 -19% Allentown-Bethlehem-Easton, PA-NJ $227,200 $905 $242,700 $1,136 -$231 -20% Seattle-Tacoma-Bellevue, WA $307,300 $1,224 $310,300 $1,452 -$228 -16% Honolulu, HI $621,600 $2,476 $577,800 $2,703 -$228 -8% Denver-Aurora, CO $234,700 $935 $248,400 $1,162 -$228 -20% Jacksonville, FL $139,000 $554 $166,600 $779 -$226 -29% Pittsfield, MA $192,300 $766 $211,800 $991 -$225 -23% Milwaukee-Waukesha-West Allis, WI $200,200 $797 $216,800 $1,014 -$217 -21% Boulder, CO $352,400 $1,403 $346,200 $1,620 -$216 -13% Cleveland-Elyria-Mentor, OH $118,200 $471 $146,700 $686 -$216 -31% Green Bay, WI $133,800 $533 $158,300 $741 -$208 -28% Trenton-Ewing, NJ $259,300 $1,033 $264,300 $1,237 -$204 -16% Boise City-Nampa, ID $140,100 $558 $161,800 $757 -$199 -26% Tallahassee, FL $142,300 $567 $163,300 $764 -$197 -26% Toledo, OH $90,900 $362 $118,900 $556 -$194 -35% Colordo Springs, CO $196,800 $784 $207,300 $970 -$186 -19% Madison, WI $213,200 $849 $220,100 $1,030 -$181 -18% Pensacola-Ferry Pass-Brent, FL $143,100 $570 $159,400 $746 -$176 -24% Cincinnati-Middletown, OH-KY-IN $131,100 $522 $148,500 $695 -$173 -25% Springfield, MA $189,200 $753 $197,900 $926 -$172 -19% Portland-Vancouver-Beaverton, OR-WA $238,500 $950 $238,000 $1,114 -$164 -15% Memphis, TN-MS-AR $127,200 $507 $142,800 $668 -$162 -24% Dallas-Fort Worth-Arlington, TX $134,700 $536 $149,100 $698 -$161 -23% Greensboro-High Point, NC $134,200 $534 $148,000 $692 -$158 -23% Gainesville, FL $172,900 $689 $178,800 $837 -$148 -18% Birmingham-Hoover, AL $146,500 $583 $156,100 $730 -$147 -20%
- 2. Rockford, IL $109,000 $434 $122,700 $574 -$140 -24% Kansas City, MO-KS $150,600 $600 $157,100 $735 -$135 -18% Davenport-Moline-Rock Island, IA-IL $113,500 $452 $125,400 $587 -$135 -23% Richmond, VA $199,600 $795 $198,400 $928 -$133 -14% Columbus, OH $149,700 $596 $155,900 $729 -$133 -18% Appleton, WI $120,000 $478 $129,600 $606 -$128 -21% Charleston-North Charleston, SC $197,500 $787 $193,600 $906 -$119 -13% Kankakee-Bradley, IL $126,500 $504 $132,300 $619 -$115 -19% Lincoln, NE $134,200 $534 $138,300 $647 -$113 -17% Dayton, OH $112,400 $448 $119,400 $559 -$111 -20% Chattanooga, TN-GA $125,700 $501 $130,500 $611 -$110 -18% Montgomery, AL $129,200 $515 $133,300 $624 -$109 -17% Lexington-Fayette,KY $144,200 $574 $144,800 $677 -$103 -15% Springfield, MO $112,400 $448 $117,500 $550 -$102 -19% Salem, OR $176,800 $704 $172,000 $805 -$101 -13% Gary-Hammond, IN $127,000 $506 $129,600 $606 -$101 -17% Knoxville, TN $143,500 $571 $143,400 $671 -$99 -15% Philadelphia-Camden-Wilmington, PA-NJ- DE-MD $223,200 $889 $211,000 $987 -$98 -10% Eugene-Springfield, OR $201,600 $803 $192,400 $900 -$97 -11% Louisville, KY-IN $136,400 $543 $136,800 $640 -$97 -15% South Bend-Mishawaka, IN $95,900 $382 $102,100 $478 -$96 -20% Albuquerque, NM $177,900 $708 $171,700 $803 -$95 -12% Saint Louis, MO-IL $143,100 $570 $141,900 $664 -$94 -14% Omaha, NE-IA $138,800 $553 $137,300 $642 -$90 -14% Youngstown-Warren-Boardman, OH-PA $75,100 $299 $82,900 $388 -$89 -23% Bloomington-Normal, IL $160,800 $640 $155,800 $729 -$89 -12% Mobile, AL $129,500 $516 $129,100 $604 -$88 -15% Akron, OH $119,700 $477 $119,800 $561 -$84 -15% Sioux Falls, SD $141,400 $563 $137,700 $644 -$81 -13% Greenville, SC $149,600 $596 $143,200 $670 -$74 -11% Glens Falls, NY $148,300 $591 $142,000 $664 -$74 -11% Spartanburg, SC $121,300 $483 $118,700 $555 -$72 -13% Canton-Massillon, OH $111,500 $444 $110,200 $516 -$72 -14% Ft. Wayne, IN $103,300 $411 $102,800 $481 -$70 -14% New Orleans-Metairie-Kenner, LA $161,900 $645 $152,600 $714 -$69 -10% Gulfport-Biloxi, MS $128,500 $512 $124,000 $580 -$68 -12% Jackson, MS $137,900 $549 $131,700 $616 -$67 -11% Champaign-Urbana, IL $142,500 $568 $135,500 $634 -$66 -10% Indianapolis, IN $129,900 $517 $124,600 $583 -$66 -11% Durham, NC $186,400 $742 $172,200 $806 -$63 -8% Virginia Beach-Norfolk-Newport News, VA- NC $210,000 $836 $192,000 $898 -$62 -7% Columbia, SC $142,100 $566 $133,700 $626 -$60 -10% Des Moines, IA $156,200 $622 $145,100 $679 -$57 -8% Fargo, ND-MN $141,600 $564 $132,600 $620 -$56 -9% Tulsa, OK $133,200 $530 $124,300 $582 -$51 -9% Pittsburgh, PA $126,600 $504 $118,500 $554 -$50 -9% Albany-Schenectady-Troy, NY $194,300 $774 $176,100 $824 -$50 -6% Topeka, KS $109,600 $436 $103,100 $482 -$46 -10% Houston-Baytown-Sugar Land, TX $155,900 $621 $142,500 $667 -$46 -7% Charleston, WV $132,000 $526 $121,700 $569 -$44 -8% Dover, DE $196,300 $782 $176,300 $825 -$43 -5% Charlotte-Gastonia-Concord, NC-SC $199,100 $793 $178,500 $835 -$42 -5% Cedar Rapids, IA $145,300 $579 $131,600 $616 -$37 -6% San Antonio, TX $148,200 $590 $134,000 $627 -$37 -6% Corpus Christi, TX $135,500 $540 $123,000 $575 -$36 -6% Rochester, NY $121,400 $483 $110,700 $518 -$34 -7% Little Rock-N. Little Rock, AR $132,800 $529 $118,900 $556 -$27 -5% Peoria, IL $123,300 $491 $110,500 $517 -$26 -5% Kennewick-Richland-Pasco, WA $173,100 $689 $152,700 $714 -$25 -4% Decatur, IL $96,000 $382 $86,800 $406 -$24 -6% Spokane, WA $171,400 $683 $150,900 $706 -$23 -3% Erie, PA $110,200 $439 $98,500 $461 -$22 -5% Springfield, IL $123,600 $492 $109,000 $510 -$18 -3% Yakima, WA $154,500 $615 $134,800 $631 -$15 -2% Farmington, NM $174,800 $696 $151,800 $710 -$14 -2% Waterloo/Cedar Falls, IA $115,300 $459 $100,700 $471 -$12 -3% Syracuse, NY $125,300 $499 $108,700 $509 -$10 -2% Wichita, KS $122,500 $488 $106,300 $497 -$9 -2% Reading, PA $155,600 $620 $134,200 $628 -$8 -1% Cumberland, MD-WV $104,500 $416 $88,600 $415 $2 0% Austin-Round Rock, TX $196,600 $783 $166,800 $780 $3 0% Amarillo, TX $127,200 $507 $107,400 $502 $4 1% Binghamton, NY $110,800 $441 $93,300 $437 $5 1% El Paso, TX $133,800 $533 $108,900 $510 $23 5% Raleigh-Cary, NC $223,700 $891 $185,200 $867 $24 3% Buffalo-Niagara Falls, NY $121,400 $483 $97,500 $456 $27 6% Beaumont-Port Arthur, TX $120,700 $481 $96,500 $451 $29 6%
- 3. Salt Lake City, UT $207,300 $826 $169,900 $795 $31 4% Elmira, NY $99,200 $395 $77,700 $364 $32 9% Shreveport-Bossier City, LA $155,900 $621 $125,100 $585 $36 6% Baton Rouge, LA $170,400 $679 $135,400 $634 $45 7% Oklahoma City, OK $149,900 $597 $115,700 $541 $56 10% Bismarck, ND $163,100 $650 $121,500 $568 $81 14% (1) Assumes 20 percent downpayment and 30-year fixed mortgage of 4.35% (September 2010 avg) (2) Assumes 20 percent downpayment and 30-year fixed mortgage of 5.77% (September 2005 avg)