SlideShare a Scribd company logo
1 of 10
Download to read offline
Table 2.1 Numbers of respondents in the survey by sex and age group (number & %)
                 All        5-8y       9-12y
Boys             293      145 (49)    148 (51)

Girls            301      151 (50)    150 (50)

n                594        296         298
Table 2.2 Numbers of respondents in the survey during winter (Sept-Feb)
and summer (Mar-Aug) by sex ( number & %)
               Boys                 Girls
Season
Winter         149 (51)             146 (49)
Summer         144 (49)             155 (51)

n              293                  301
Table 2.3 Geographical location of respondents by sex and age group (number & %)
                           All           5-8y          9-12y
Boys
Open country/village     133 (45)       65 (45)       68 (46)
Small town                17 (6)         8 (6)         9 (6)
Large town               67 (23)        34 (23)       33 (22)
City                     76 (26)        38 (26)       38 (26)
n                          293           145           148
Girls
Open country/village    109 (36.2)     52 (34.4)      57 (38)
Small town               17 (5.6)       8 (5.3)        9 (6)
Large town              80 (26.6)      42 (27.8)     38 (25.3)
City                    95 (31.6)      49 (32.5)     46 (30.7)
n                          301           151           150
Table 2.4 Social class of respondents by sex (number & %)

                                       Boys            Girls
Social Class
Professional Workers                   144 (50.2)      163 (54.7)
Non-Manual Workers                     59 (20.6)       58 (19.5)
Skilled Manual Workers                 51 (17.8)       42 (14.1)
Unskilled Workers                      33 (11.5)       35 (11.7)
    *
n                                      287             298
* Excludes 9 missing values
Table 2.5 Socio-economic group of respondents by sex (number & %)

                                Boys            Girls
Socio-Economic Group
Employers and Managers          74 (25.6)       80 (26.8)
Higher professional             27 (9.3)        35 (11.7)
Lower professional              48 (16.6)       50 (16.7)
Non-manual                      60 (20.8)       67 (22.4)
Manual Skilled                  31 (10.7)       20 (6.7)
Semi-skilled                    20 (6.9)        17 (5.7)
Unskilled                       6 (2.1)         6 (2.0)
Own account workers             11 (3.8)        16 (5.4)
Farmers                         11 (3.8)        6 (2.0)
Agricultural workers            0 (0)           1 (0.3)
Students                        1 (0.3)         1 (0.3)
n*                              289             299
* Excludes 6 missing values
Table 2.6 Education level of respondents' parents by sex and age
group of respondent (number & %)

                            All          5-8y          9-12y

Boys
Primary & Intermediate      60 (20.5)    25 (17.4)     35 (23.6)
Secondary                   113 (38.7)   61 (42.4)     52 (35.1)
Tertiary                    119 (40.8)   58 (40.3)     61 (41.2)
n                           292          144           148
Girls
Primary & Intermediate      49 (14.8)    20 (13.3)     29 (19.7)
Secondary                   116 (39.1)   61 (40.7)     55 (37.4)
Tertiary                    132 (44.4)   69 (46.0)     63 (42.9)
n                           297          150           147
Excludes 5 missing values
Table 2.7 Percentage of boys and girls from the NCFS for each year age
compared with the census 2002 data
                    Census 2002 (%)                  NCFS (%)
Age (years)    All 5-12 Boys      Girls      All 5-12 Males Females
          5     12.6     12.6     12.5        11.9     11.5   12.3
          6     12.1     12.2     12.1        12.9     12.9   13.0
          7     12.0     12.0     12.0        12.3     12.2   12.3
          8     11.9     11.9     11.9        12.8     12.9   12.6
          9     12.3     12.4     12.2        12.8     13.2   12.3
         10     12.8     12.7     13.0        12.6     11.9   13.3
         11     13.2     13.3     13.2        12.3     12.5   12.0
         12     13.1     13.0     13.1        12.6     12.9   12.3
 5-12 years     100.0     51.4     48.7       100.0     49.5     50.5
Table 2.8 Comparison of socio demographics from the Census 2002 data for the total population* and
for persons under the age of 15 years (similar to the NCFS age group of 5-12 years)#, with data from the
National Children's Food Survey

                                                                Census (%)*          Census (%)#           NCFS (%)
Province
Leinster                                                             54                    53                  44
Munster                                                              28                    28                  35
Connaught                                                            12                    12                  15
Ulster                                                                6                     7                  5
Geographical Location
Open country                                                         33                                        32
Village (200-1,4999)                                                  7                                        9
Town (1,500-2,999)                                                    3                                        1
Town (3000-4,999)                                                     3                                        5
Town (5,000-9,999)                                                    6                                        9
Town (>10,000)                                                       13                                        16
City (Cork, Dublin)                                                  36                                        29
                               †
Socio-economic group
Employers and managers                                               19                    25                  26
Higher professional                                                   6                     7                  10
Lower professional                                                   12                    11                  16
Non-manual                                                           20                    18                  22
Manual skilled                                                       12                    11                  9
Semi-skilled                                                         10                     8                  6
Unskilled                                                             6                     4                  2
Own account workers                                                   6                     8                  5
Farmers                                                               7                     7                  3
Agricultural workers                                                  1                     1                  0
                  †
Social Class
Professional workers                                                  7                     9                  11
Managerial and technical                                             32                    36                  41
Non-manual                                                           20                    19                  20
Skilled manual                                                       21                    20                  16
Semi-skilled                                                         13                    11                  9
Unskilled                                                             7                     5                  2

*Census data for total population
#
    Census data for persons under the age of 15 years
†
    Occupations unknown or insufficiently described were excluded as values from the the NCFS were low compared to Census 2002 data
Table 2.9 Comparison of marital status from the Census 2002 data (total population, persons
under the age of 15 years (similar to the NCFS age group of 5-12 years) and 30-50years only)
with marital status from the National Children's Food Survey

                                                    All data (%)                            30-50 years (%)
                                                             #
Marital Status                                Census Census      NCFS                      Census     NCFS
Married/Partner                                37.1     83.0      91.1                      66.0       91.1
Separated/divorced/widowed                      8.2                4.9                       8.0        4.4
Single                                         54.7     17.0      4.0                       26.0        4.0
#
    for persons under the age of 15 years and the values for 'single' include separated/divorced/widowed
Table 2.10 Comparison of education level from the Census 2002 data (total
population and 30-50years only) with parental education level from the National
Children's Food Survey

                                     All data (%)            30-50 years (%)
Education Level*                   Census    NCFS           Census     NCFS
Primary                             17.9        1.5           9.2        1.3
Lower secondary                     18.3       17.1          24.9       17.1
Upper secondary                     23.4       16.1          30.0       16.1
Non degree                          8.1        22.3          11.0       23.2
Degree                              12.8       42.1          17.2       41.6
Not stated                           4.3        0.8           3.1        0.7
* not including n=2 students

More Related Content

Viewers also liked

Icemc2 kuppam
Icemc2 kuppamIcemc2 kuppam
Icemc2 kuppam
hanums1
 
나의사업계획서
나의사업계획서나의사업계획서
나의사업계획서
Matthew Chang
 
쇼를하라쇼
쇼를하라쇼쇼를하라쇼
쇼를하라쇼
nonstop83
 
Otitis externa media cmo equine wobblers
Otitis externa media cmo equine wobblersOtitis externa media cmo equine wobblers
Otitis externa media cmo equine wobblers
shahbaz3
 
Prozac 20072165 김주은[최종본]
Prozac 20072165 김주은[최종본]Prozac 20072165 김주은[최종본]
Prozac 20072165 김주은[최종본]
tifksqnls
 
Atypical forms of the osmotic demyelination syndrome
Atypical forms of the osmotic demyelination syndromeAtypical forms of the osmotic demyelination syndrome
Atypical forms of the osmotic demyelination syndrome
Erwin Chiquete, MD, PhD
 
Serway 6c2b0-ed (Solucionário )
Serway 6c2b0-ed (Solucionário )Serway 6c2b0-ed (Solucionário )
Serway 6c2b0-ed (Solucionário )
iuryanderson
 
Killa Bzz App1 Dashboard
Killa Bzz App1 DashboardKilla Bzz App1 Dashboard
Killa Bzz App1 Dashboard
Randal Truong
 
The pitch film
The pitch  filmThe pitch  film
The pitch film
vini95
 

Viewers also liked (20)

Icemc2 kuppam
Icemc2 kuppamIcemc2 kuppam
Icemc2 kuppam
 
EMIX Europe Low Volatility - Brochure
EMIX Europe Low Volatility - BrochureEMIX Europe Low Volatility - Brochure
EMIX Europe Low Volatility - Brochure
 
나의사업계획서
나의사업계획서나의사업계획서
나의사업계획서
 
Edpm 2013 sba
Edpm 2013 sbaEdpm 2013 sba
Edpm 2013 sba
 
쇼를하라쇼
쇼를하라쇼쇼를하라쇼
쇼를하라쇼
 
Otitis externa media cmo equine wobblers
Otitis externa media cmo equine wobblersOtitis externa media cmo equine wobblers
Otitis externa media cmo equine wobblers
 
BPM Education
BPM EducationBPM Education
BPM Education
 
Daum 검색/지도 API (이정주)
Daum 검색/지도 API (이정주)Daum 검색/지도 API (이정주)
Daum 검색/지도 API (이정주)
 
Prozac 20072165 김주은[최종본]
Prozac 20072165 김주은[최종본]Prozac 20072165 김주은[최종본]
Prozac 20072165 김주은[최종본]
 
Atypical forms of the osmotic demyelination syndrome
Atypical forms of the osmotic demyelination syndromeAtypical forms of the osmotic demyelination syndrome
Atypical forms of the osmotic demyelination syndrome
 
언어네트워크분석으로 신뢰 비신뢰 요인 한눈에 보다. DBR149호
언어네트워크분석으로 신뢰 비신뢰 요인 한눈에 보다. DBR149호언어네트워크분석으로 신뢰 비신뢰 요인 한눈에 보다. DBR149호
언어네트워크분석으로 신뢰 비신뢰 요인 한눈에 보다. DBR149호
 
통신서비스 산업 2015 하반기 전망
 통신서비스 산업 2015 하반기 전망 통신서비스 산업 2015 하반기 전망
통신서비스 산업 2015 하반기 전망
 
Serway 6c2b0-ed (Solucionário )
Serway 6c2b0-ed (Solucionário )Serway 6c2b0-ed (Solucionário )
Serway 6c2b0-ed (Solucionário )
 
Killa Bzz App1 Dashboard
Killa Bzz App1 DashboardKilla Bzz App1 Dashboard
Killa Bzz App1 Dashboard
 
If you build it will they come - Field of Dreams
If you build it will they come - Field of DreamsIf you build it will they come - Field of Dreams
If you build it will they come - Field of Dreams
 
요리치료 프로그램으로 출간하기
요리치료 프로그램으로 출간하기요리치료 프로그램으로 출간하기
요리치료 프로그램으로 출간하기
 
The pitch film
The pitch  filmThe pitch  film
The pitch film
 
In my fathers house are many mansions
In my fathers house are many mansionsIn my fathers house are many mansions
In my fathers house are many mansions
 
Talent Profile 1 4 10
Talent Profile 1 4 10Talent Profile 1 4 10
Talent Profile 1 4 10
 
Bobeobi 5 prosm
Bobeobi 5 prosmBobeobi 5 prosm
Bobeobi 5 prosm
 

More from LBG (20)

Ink ex pop_up
Ink ex pop_upInk ex pop_up
Ink ex pop_up
 
INKEx FAS placement
INKEx FAS placementINKEx FAS placement
INKEx FAS placement
 
NTFS - Chapter 6 Tables
NTFS - Chapter 6 TablesNTFS - Chapter 6 Tables
NTFS - Chapter 6 Tables
 
NTFS - Chapter 5 Tables
NTFS - Chapter 5 TablesNTFS - Chapter 5 Tables
NTFS - Chapter 5 Tables
 
NTFS - Chapter 4 Tables
NTFS - Chapter 4 TablesNTFS - Chapter 4 Tables
NTFS - Chapter 4 Tables
 
NTFS - Chapter 3 Tables
NTFS - Chapter 3 TablesNTFS - Chapter 3 Tables
NTFS - Chapter 3 Tables
 
NTFS - Chapter 1 Methodology
NTFS - Chapter 1 MethodologyNTFS - Chapter 1 Methodology
NTFS - Chapter 1 Methodology
 
NTFS - Chapter 1 Background
NTFS - Chapter 1 BackgroundNTFS - Chapter 1 Background
NTFS - Chapter 1 Background
 
NTFS - Table of Contents
NTFS - Table of ContentsNTFS - Table of Contents
NTFS - Table of Contents
 
NFTS - Summary Report Tables
NFTS - Summary Report TablesNFTS - Summary Report Tables
NFTS - Summary Report Tables
 
NTFS - Summary Report
NTFS - Summary ReportNTFS - Summary Report
NTFS - Summary Report
 
NS - Food Survey Full Report 2001
NS - Food Survey Full Report 2001NS - Food Survey Full Report 2001
NS - Food Survey Full Report 2001
 
NS - Food Survey Summary 2001
NS - Food Survey Summary 2001NS - Food Survey Summary 2001
NS - Food Survey Summary 2001
 
NCFS - C6 T6 P1to11
NCFS - C6 T6 P1to11NCFS - C6 T6 P1to11
NCFS - C6 T6 P1to11
 
NCFS C4 T4 13to44
NCFS C4 T4 13to44NCFS C4 T4 13to44
NCFS C4 T4 13to44
 
NCFS - Contents
NCFS - ContentsNCFS - Contents
NCFS - Contents
 
NCFS - Methodology
NCFS - MethodologyNCFS - Methodology
NCFS - Methodology
 
NCFS - Background
NCFS - BackgroundNCFS - Background
NCFS - Background
 
NCFS - C3 T3 P1to6
NCFS - C3 T3 P1to6NCFS - C3 T3 P1to6
NCFS - C3 T3 P1to6
 
NCFS - C4 T4 P1to12
NCFS - C4 T4 P1to12NCFS - C4 T4 P1to12
NCFS - C4 T4 P1to12
 

Recently uploaded

Cloud Frontiers: A Deep Dive into Serverless Spatial Data and FME
Cloud Frontiers:  A Deep Dive into Serverless Spatial Data and FMECloud Frontiers:  A Deep Dive into Serverless Spatial Data and FME
Cloud Frontiers: A Deep Dive into Serverless Spatial Data and FME
Safe Software
 

Recently uploaded (20)

AWS Community Day CPH - Three problems of Terraform
AWS Community Day CPH - Three problems of TerraformAWS Community Day CPH - Three problems of Terraform
AWS Community Day CPH - Three problems of Terraform
 
Strategize a Smooth Tenant-to-tenant Migration and Copilot Takeoff
Strategize a Smooth Tenant-to-tenant Migration and Copilot TakeoffStrategize a Smooth Tenant-to-tenant Migration and Copilot Takeoff
Strategize a Smooth Tenant-to-tenant Migration and Copilot Takeoff
 
FWD Group - Insurer Innovation Award 2024
FWD Group - Insurer Innovation Award 2024FWD Group - Insurer Innovation Award 2024
FWD Group - Insurer Innovation Award 2024
 
"I see eyes in my soup": How Delivery Hero implemented the safety system for ...
"I see eyes in my soup": How Delivery Hero implemented the safety system for ..."I see eyes in my soup": How Delivery Hero implemented the safety system for ...
"I see eyes in my soup": How Delivery Hero implemented the safety system for ...
 
Apidays New York 2024 - Scaling API-first by Ian Reasor and Radu Cotescu, Adobe
Apidays New York 2024 - Scaling API-first by Ian Reasor and Radu Cotescu, AdobeApidays New York 2024 - Scaling API-first by Ian Reasor and Radu Cotescu, Adobe
Apidays New York 2024 - Scaling API-first by Ian Reasor and Radu Cotescu, Adobe
 
Cloud Frontiers: A Deep Dive into Serverless Spatial Data and FME
Cloud Frontiers:  A Deep Dive into Serverless Spatial Data and FMECloud Frontiers:  A Deep Dive into Serverless Spatial Data and FME
Cloud Frontiers: A Deep Dive into Serverless Spatial Data and FME
 
Connector Corner: Accelerate revenue generation using UiPath API-centric busi...
Connector Corner: Accelerate revenue generation using UiPath API-centric busi...Connector Corner: Accelerate revenue generation using UiPath API-centric busi...
Connector Corner: Accelerate revenue generation using UiPath API-centric busi...
 
Emergent Methods: Multi-lingual narrative tracking in the news - real-time ex...
Emergent Methods: Multi-lingual narrative tracking in the news - real-time ex...Emergent Methods: Multi-lingual narrative tracking in the news - real-time ex...
Emergent Methods: Multi-lingual narrative tracking in the news - real-time ex...
 
Exploring Multimodal Embeddings with Milvus
Exploring Multimodal Embeddings with MilvusExploring Multimodal Embeddings with Milvus
Exploring Multimodal Embeddings with Milvus
 
Polkadot JAM Slides - Token2049 - By Dr. Gavin Wood
Polkadot JAM Slides - Token2049 - By Dr. Gavin WoodPolkadot JAM Slides - Token2049 - By Dr. Gavin Wood
Polkadot JAM Slides - Token2049 - By Dr. Gavin Wood
 
Web Form Automation for Bonterra Impact Management (fka Social Solutions Apri...
Web Form Automation for Bonterra Impact Management (fka Social Solutions Apri...Web Form Automation for Bonterra Impact Management (fka Social Solutions Apri...
Web Form Automation for Bonterra Impact Management (fka Social Solutions Apri...
 
Repurposing LNG terminals for Hydrogen Ammonia: Feasibility and Cost Saving
Repurposing LNG terminals for Hydrogen Ammonia: Feasibility and Cost SavingRepurposing LNG terminals for Hydrogen Ammonia: Feasibility and Cost Saving
Repurposing LNG terminals for Hydrogen Ammonia: Feasibility and Cost Saving
 
Ransomware_Q4_2023. The report. [EN].pdf
Ransomware_Q4_2023. The report. [EN].pdfRansomware_Q4_2023. The report. [EN].pdf
Ransomware_Q4_2023. The report. [EN].pdf
 
DEV meet-up UiPath Document Understanding May 7 2024 Amsterdam
DEV meet-up UiPath Document Understanding May 7 2024 AmsterdamDEV meet-up UiPath Document Understanding May 7 2024 Amsterdam
DEV meet-up UiPath Document Understanding May 7 2024 Amsterdam
 
Axa Assurance Maroc - Insurer Innovation Award 2024
Axa Assurance Maroc - Insurer Innovation Award 2024Axa Assurance Maroc - Insurer Innovation Award 2024
Axa Assurance Maroc - Insurer Innovation Award 2024
 
Boost Fertility New Invention Ups Success Rates.pdf
Boost Fertility New Invention Ups Success Rates.pdfBoost Fertility New Invention Ups Success Rates.pdf
Boost Fertility New Invention Ups Success Rates.pdf
 
CNIC Information System with Pakdata Cf In Pakistan
CNIC Information System with Pakdata Cf In PakistanCNIC Information System with Pakdata Cf In Pakistan
CNIC Information System with Pakdata Cf In Pakistan
 
Apidays New York 2024 - Passkeys: Developing APIs to enable passwordless auth...
Apidays New York 2024 - Passkeys: Developing APIs to enable passwordless auth...Apidays New York 2024 - Passkeys: Developing APIs to enable passwordless auth...
Apidays New York 2024 - Passkeys: Developing APIs to enable passwordless auth...
 
DBX First Quarter 2024 Investor Presentation
DBX First Quarter 2024 Investor PresentationDBX First Quarter 2024 Investor Presentation
DBX First Quarter 2024 Investor Presentation
 
Cyberprint. Dark Pink Apt Group [EN].pdf
Cyberprint. Dark Pink Apt Group [EN].pdfCyberprint. Dark Pink Apt Group [EN].pdf
Cyberprint. Dark Pink Apt Group [EN].pdf
 

NCFS - C2 T2 P1to10

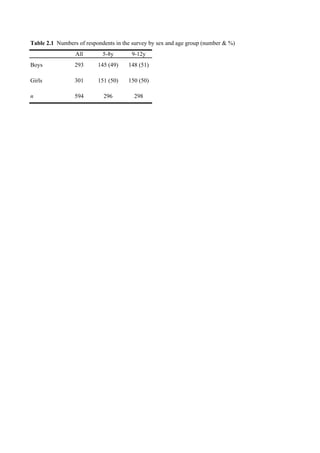
  • 1. Table 2.1 Numbers of respondents in the survey by sex and age group (number & %) All 5-8y 9-12y Boys 293 145 (49) 148 (51) Girls 301 151 (50) 150 (50) n 594 296 298
  • 2. Table 2.2 Numbers of respondents in the survey during winter (Sept-Feb) and summer (Mar-Aug) by sex ( number & %) Boys Girls Season Winter 149 (51) 146 (49) Summer 144 (49) 155 (51) n 293 301
  • 3. Table 2.3 Geographical location of respondents by sex and age group (number & %) All 5-8y 9-12y Boys Open country/village 133 (45) 65 (45) 68 (46) Small town 17 (6) 8 (6) 9 (6) Large town 67 (23) 34 (23) 33 (22) City 76 (26) 38 (26) 38 (26) n 293 145 148 Girls Open country/village 109 (36.2) 52 (34.4) 57 (38) Small town 17 (5.6) 8 (5.3) 9 (6) Large town 80 (26.6) 42 (27.8) 38 (25.3) City 95 (31.6) 49 (32.5) 46 (30.7) n 301 151 150
  • 4. Table 2.4 Social class of respondents by sex (number & %) Boys Girls Social Class Professional Workers 144 (50.2) 163 (54.7) Non-Manual Workers 59 (20.6) 58 (19.5) Skilled Manual Workers 51 (17.8) 42 (14.1) Unskilled Workers 33 (11.5) 35 (11.7) * n 287 298 * Excludes 9 missing values
  • 5. Table 2.5 Socio-economic group of respondents by sex (number & %) Boys Girls Socio-Economic Group Employers and Managers 74 (25.6) 80 (26.8) Higher professional 27 (9.3) 35 (11.7) Lower professional 48 (16.6) 50 (16.7) Non-manual 60 (20.8) 67 (22.4) Manual Skilled 31 (10.7) 20 (6.7) Semi-skilled 20 (6.9) 17 (5.7) Unskilled 6 (2.1) 6 (2.0) Own account workers 11 (3.8) 16 (5.4) Farmers 11 (3.8) 6 (2.0) Agricultural workers 0 (0) 1 (0.3) Students 1 (0.3) 1 (0.3) n* 289 299 * Excludes 6 missing values
  • 6. Table 2.6 Education level of respondents' parents by sex and age group of respondent (number & %) All 5-8y 9-12y Boys Primary & Intermediate 60 (20.5) 25 (17.4) 35 (23.6) Secondary 113 (38.7) 61 (42.4) 52 (35.1) Tertiary 119 (40.8) 58 (40.3) 61 (41.2) n 292 144 148 Girls Primary & Intermediate 49 (14.8) 20 (13.3) 29 (19.7) Secondary 116 (39.1) 61 (40.7) 55 (37.4) Tertiary 132 (44.4) 69 (46.0) 63 (42.9) n 297 150 147 Excludes 5 missing values
  • 7. Table 2.7 Percentage of boys and girls from the NCFS for each year age compared with the census 2002 data Census 2002 (%) NCFS (%) Age (years) All 5-12 Boys Girls All 5-12 Males Females 5 12.6 12.6 12.5 11.9 11.5 12.3 6 12.1 12.2 12.1 12.9 12.9 13.0 7 12.0 12.0 12.0 12.3 12.2 12.3 8 11.9 11.9 11.9 12.8 12.9 12.6 9 12.3 12.4 12.2 12.8 13.2 12.3 10 12.8 12.7 13.0 12.6 11.9 13.3 11 13.2 13.3 13.2 12.3 12.5 12.0 12 13.1 13.0 13.1 12.6 12.9 12.3 5-12 years 100.0 51.4 48.7 100.0 49.5 50.5
  • 8. Table 2.8 Comparison of socio demographics from the Census 2002 data for the total population* and for persons under the age of 15 years (similar to the NCFS age group of 5-12 years)#, with data from the National Children's Food Survey Census (%)* Census (%)# NCFS (%) Province Leinster 54 53 44 Munster 28 28 35 Connaught 12 12 15 Ulster 6 7 5 Geographical Location Open country 33 32 Village (200-1,4999) 7 9 Town (1,500-2,999) 3 1 Town (3000-4,999) 3 5 Town (5,000-9,999) 6 9 Town (>10,000) 13 16 City (Cork, Dublin) 36 29 † Socio-economic group Employers and managers 19 25 26 Higher professional 6 7 10 Lower professional 12 11 16 Non-manual 20 18 22 Manual skilled 12 11 9 Semi-skilled 10 8 6 Unskilled 6 4 2 Own account workers 6 8 5 Farmers 7 7 3 Agricultural workers 1 1 0 † Social Class Professional workers 7 9 11 Managerial and technical 32 36 41 Non-manual 20 19 20 Skilled manual 21 20 16 Semi-skilled 13 11 9 Unskilled 7 5 2 *Census data for total population # Census data for persons under the age of 15 years † Occupations unknown or insufficiently described were excluded as values from the the NCFS were low compared to Census 2002 data
  • 9. Table 2.9 Comparison of marital status from the Census 2002 data (total population, persons under the age of 15 years (similar to the NCFS age group of 5-12 years) and 30-50years only) with marital status from the National Children's Food Survey All data (%) 30-50 years (%) # Marital Status Census Census NCFS Census NCFS Married/Partner 37.1 83.0 91.1 66.0 91.1 Separated/divorced/widowed 8.2 4.9 8.0 4.4 Single 54.7 17.0 4.0 26.0 4.0 # for persons under the age of 15 years and the values for 'single' include separated/divorced/widowed
  • 10. Table 2.10 Comparison of education level from the Census 2002 data (total population and 30-50years only) with parental education level from the National Children's Food Survey All data (%) 30-50 years (%) Education Level* Census NCFS Census NCFS Primary 17.9 1.5 9.2 1.3 Lower secondary 18.3 17.1 24.9 17.1 Upper secondary 23.4 16.1 30.0 16.1 Non degree 8.1 22.3 11.0 23.2 Degree 12.8 42.1 17.2 41.6 Not stated 4.3 0.8 3.1 0.7 * not including n=2 students