MProbe VisHR is used to measure relatively thick film in 1um to 1000um range. Use of the thick film algorithm based on FFT make it very easy to do measurement inline. Polymer web is frequenlty include 3- 4 layer of different thicknesses. All of them can be measured simultaneously using MProbe system.
Brochure: http://semiconsoft.com/html/download/brochure/MProbeVisVisHR_brochure2014.pdf
Tata AIG General Insurance Company - Insurer Innovation Award 2024
Thick films: thickness measurement with MProbe
1. 83 Pine Hill Rd. Southborough, MA 01772
Phone +1.617.388.6832 Fax. +1.508.858.5473
email: info@semiconsoft.com http://www.semiconsoft.com
Thin Film Measurement solution
Software, sensors, custom development
and integration
MPROBE™ SPECTROSCOPIC REFLECTANCE SYSTEM:
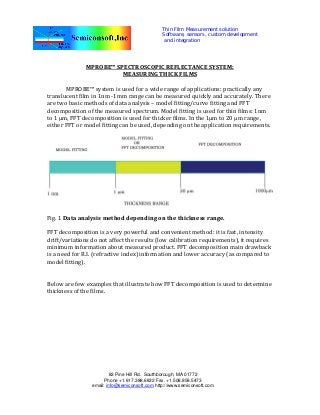
MEASURING THICK FILMS MPROBE™ system is used for a wide range of applications: practically any translucent film in 1nm ‐1mm range can be measured quickly and accurately. There are two basic methods of data analysis – model fitting/curve fitting and FFT decomposition of the measured spectrum. Model fitting is used for thin films: 1nm to 1 μm, FFT decomposition is used for thicker films. In the 1μm to 20 μm range, either FFT or model fitting can be used, depending on the application requirements.
Fig. 1 Data analysis method depending on the thickness range. FFT decomposition is a very powerful and convenient method: it is fast, intensity drift/variations do not affect the results (low calibration requirements), it requires minimum information about measured product. FFT decomposition main drawback s a need for R.I. (refractive index) information and lower accuracy (as compared to odel fitting).
i
m
elow are few examples that illustrate how FFT decomposition is used to determine hickness of the films.
B
t
2. 1
.
thborough, MA 01772
Phone +1.617.388.6832 Fax. +1.508.858.5473
email: info@semiconsoft.com
MULTILAYER POLYMER WEB/FILM
Multilayer polymer films are used for many application e.g. food packaging, stickers/labels, etc. In this example we will review a 4 layer polymer web with the following structure: eparator/Silicon/Adhesive/PET film (substrate). Silicon is a thin film (<1 μm) that nables “peel‐off” separator to expose adhesive of the sticker (PET film).
Se
ig. 2 Reflectance spectrum measured with MProbeVisHR (700nm ‐1000nm avelength range). Sample 1 is a 4 layer polymer web (sticker).
Fw
83 Pine Hill Rd. Sou ig. 3 FFT decomposition data analysis of indicate the thickness of the layers.
F
the data (Fig. 2). Position of the peaks
3. FFT decomposition analysis creates a layer (peak) for every pair of interfaces, the position of this peak indicates the thickness of the layer and the height of the peak indicates the “quality” of the interface. This mean that a 3 layer web should have 6 peaks (last peak being the total thickness). These peaks are visible on Fig. 3. The Silicon layer (3*) peak is not displayed separately (the thickness is too low < 1μm), but it is displayed in a combination with Separator and Separator +Adhesive layers. The total thickness peak is also broadened because of the Silicon layer. MProbe TFCompanion software can automatically identify the peaks and match them to the layers. It helps to know the structure of the measured product and the range of expected thicknesses. However, this information can also be glea
ned, in most cases, from the FFT decomposition itself and fed back in themodel. Layers thickness constraints help software to identify peaks easily. FFT decomposition on Fig. 3 shows all the layers directly (except silicon layer). Frequently, some of the layers are “hidden” or corresponding peak is too small to detect accurately.
Fig. 4 Reflectance spectrum measured with MProbeVisHR (700nm ‐1000
nm
wavelength range). Sample 2 is a 4 layer polymer web (sticker). Sample 2 has the same structure as Sample 1 but, in this case, the thicknesses of Separator and PET (Substrate) layers are similar.
4. Hill Rd. Southborough, MA 01772
Phone +1.617.388.6832 Fax. +1.508.858.5473
email: info@semiconsoft.com
Fig. 5. FFT decomposition data analysis of the data (Fig. 4). FFT deconvolution of Sample 2 measurement (Fig 5) does not show Layer 3 directly – it manifests itself in the broadening of the L1 peak. It is possible to deconvolute L1
peak to determine L3 but a better way is to use the total thickness and L1+L2 information to determine L3. ifferential thickness option can be activated in the software to determine “missing” hickness from the total thickness (see Fig. 6)
Dt
83 Pine Fig. 6 Setting differential thickness option to determine thickness of the “hidden” layer/interface from the total thickness. Noise level setting helps separate Layer thickness data from the noise.
5. 2.
ALUMINA (SAPPHIRE) LAYER MEASUREMENT. Alumina, parylene, yttrium oxide and many other thick layers have R.I. epending on deposition conditions. Using a library, stoichiometric material, optical roperties with FFT decomposition can result in inaccurate thickness reading.
dp
Fig.7. Reflectance of Alumina on glass measured with MProbe UVVisSR system (wavelength range: 200nm ‐1000nm)
terial
ig. 8 FFT decomposition of the data on Fig. 7. using library Alumina ma properties. The peak position indicates the thickness of 1164nm
F
6. Direct comparison of the model vs. measured data using FFT decomposition esults shows that refractive index (R.I.) value used in the model is not correct (Fig. )
r9
esults model (red) and measured data (blue)
ig. 9 Direct comparison of the FFT r shows that R.I. is not correct.
F
83 Pine Hill Rd. Sout ig. 10. Direct fit of the model to measured of alumina. Thickness 1202 nm.
F
data to determine the thickness and R.I.
7. 83 Pine Hill Rd. Southborough, MA 01772
Phone +1.617.388.6832 Fax. +1.508.858.5473
email: info@semiconsoft.com http://www.semiconsoft.com
ig. 11. Alumina R.I. determ alumina R.I. (red)
Fine from the measurement (yellow) and library
3.
HARD COATINGS Hard coating has many applications, in particular, it is deposited on the surface of polycarbon products like eyeglass lenses and headlight/taillight covers of the cars. When hardcoating is deposited it creates an Inter Penetration Layer (IPL) in olycarbon. IPL is, typically, fairly thin (~ 1 μm). It is important for quality control o measure both the thickness of the IPL and hard coat layers.
pt
8. 83 Pine Hill Rd. Southborough, MA 01772
Phone +1.617.388.6832 Fax. +1.508.858.5473
email: info@semiconsoft.com http://www.semiconsoft.com
ig. 12 Reflectance spectra of polycarbon with hardcoat sample (headlight). easurement is taken with MProbe Vis system (wavelength range: 400‐1000 nm)
FM
ss
he measurement data (Fig. 12). Differential thickne
Fig. 13. FFT decomposition of t
option is activated and IPL is determined from total thickness. Hard coat‐ 15.2 μm, IPL – 1.85 μm IPL layer has a R.I. in between polycarbon and hardcoat optical properties, so the optical contrast between IPL and both material is weak. As a result, direct peak from the IPL is very weak (on the noise level). Using differential IPL thickness rate
determination from the total thickness solves the problem and gives accuresults. In some cases, peaks are very weak or broadened/skewed so that determination of the thickness by apparent peak position maybe inaccurate.
9. Improved accuracy option use the fit to the peak’s shape and peak decomposition to
determine more accurate position.
4
. POL
YMER FILM ON METAL FOIL. Polymer films are frequently attached to metal surface. There are cases, like attaching sensors or stress indicator, when the thickness of adhesive and polymer film need to be monitored for quality control.
Fig. 14. Reflectance spectrum of polymer film on steel foil. Measurement is MProbe Vis system in 700‐1000nm wavelength range. r wavelengths light scattering reduced the usefulness of
taken with (at shorte the data)
Reflectance spectrum (Fig. 14) looks good but FFT decomposition (Fig. 15) shows that L1 (adhesive) peak and total thickness peak are small with the round top. L2 (polymer) peak is a bit skewed. Using Maximum precision option (Fig. 16) allows correction/improvement of the accuracy.
10. 83 Pine Hill Rd. Southborough, MA 01772
Phone +1.617.388.6832 Fax. +1.508.858.5473
email: info@semiconsoft.com http://www.semiconsoft.com
F
ig. 15
FFT deconvolution of the measurement (Fig. 14). ( Improved accuracy option is used). Adhesive 2.2 μm, polymer 9.2 μm
Fig. 16. Setting Maximum Precision option in configuration
11. 5
+1.617.388.6832 Fax. +1.508.858.5473
email: info@semiconsoft.com
YTTRIUM OXIDE COATING Yttrium oxide coating is commonly deposited on critical elements of etching and plasma assisted deposition chambers due to its exceptionally low etching rate. Some of the thick Y2O3 coatings are deposited over a large area using several runs. This creates multiple sublayers in the coating. For quality control testy total thickness is, typically, required.
ing, onl
ig. 17. Reflectance spectrum of Y2O3 coating on ceramic. Measurement is taken using MProbe Vis system in 700‐1000nm wavelength range.
F
aks
Fig. 18. FFT decomposition of the measurement data (Fig. 17). Multiple pe
83 PPhone
ine Hill Rd. Southborough, MA 01772 indicate sublayers due to separate deposition runs. etermine total thickness (9.9 μm) in this case one Total thickness and Maximum accuracy options in To accurately d needs to enable configuration.