TCO thickness and n&k measurement is done quickly and easily with MProbe system: http://www.semiconsoft.com/wp/mprobe20desktop/
In many cases, MProbe Vis system is adequate for the measurement: http://www.semiconsoft.com/html/download/brochure/MProbeVis_brochure2012.pdf
CNIC Information System with Pakdata Cf In Pakistan
TCO: thickness and n&k measurement
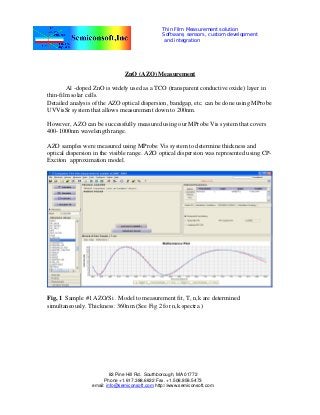
1. Thin Film Measurement solution
Software, sensors, custom development
and integration
ZnO (AZO) Measurement
Al -doped ZnO is widely used as a TCO (transparent conductive oxide) layer in
thin-film solar cells.
Detailed analysis of the AZO optical dispersion, bandgap, etc. can be done using MProbe
UVVisSr system that allows measurement down to 200nm.
However, AZO can be successfully measured using our MProbe Vis system that covers
400-1000nm wavelength range.
AZO samples were measured using MProbe Vis system to determine thickness and
optical dispersion in the visible range. AZO optical dispersion was represented using CP-Exciton
approximation model.
Fig, 1 Sample #1 AZO/Si . Model to measurement fit, T, n,k are determined
simultaneously. Thickness: 360nm (See Fig 2 for n,k spectra )
83 Pine Hill Rd. Southborough, MA 01772
Phone +1.617.388.6832 Fax. +1.508.858.5473
email: info@semiconsoft.com http://www.semiconsoft.com
2. Fig. 2. Sample #1 optical dispersion determined form the measurement.
Fig. 3. Sample #2 (AZO/SiO2/Si). Fit of the model to measurement data. Calculated
parameters AZO and SiO2 thickness (197nm AZO/50nm SiO2/Si). AZO dispersion from
the Sample#1 is used. Good fit to the measured data shows that the optical properties of
the AZO in both sample are the same.
83 Pine Hill Rd. Southborough, MA 01772
Phone +1.617.388.6832 Fax. +1.508.858.5473
email: info@semiconsoft.com http://www.semiconsoft.com
3. Fig. 4. Sample # 3(Fe3O4/SiO2/Si). Model to measured data fit. F3O4 dispersion is
represented using CP Exciton model. 174nm Fe3O4/50nm SiO2/Si. Fe3O4 thickness and
optical dispersion are determined from the measurement.
Fig. 5 Sample#4 (Fe3O4/AZO/Al2O3 (substrate)). Fit of the model to measured data.
Thicknesses of Fe3O4 and AZO are determined from the measurement. Optical
dispersion of the materials is taken from the previous measurements. : 8 nm Fe2O4/ 22
nm AZO/ Sapphire (substrate)
83 Pine Hill Rd. Southborough, MA 01772
Phone +1.617.388.6832 Fax. +1.508.858.5473
email: info@semiconsoft.com http://www.semiconsoft.com
4. Fig. 6. Sample # 5. Thick AZO on glass. Model to measurement data fit. Thickness:
1031nm, surface roughness: 42nm
83 Pine Hill Rd. Southborough, MA 01772
Phone +1.617.388.6832 Fax. +1.508.858.5473
email: info@semiconsoft.com http://www.semiconsoft.com
5. Fig. 7. Sample# 5 Optical dispersion spectra determined from the measurement.
Dispersion is represented using CPExciton model
83 Pine Hill Rd. Southborough, MA 01772
Phone +1.617.388.6832 Fax. +1.508.858.5473
email: info@semiconsoft.com http://www.semiconsoft.com