
Recommended
Recommended
More Related Content
What's hot
What's hot (20)
Viewers also liked
Viewers also liked (9)
Similar to Stptg 4
Similar to Stptg 4 (20)
More from ES-Teck India
More from ES-Teck India (20)
Recently uploaded
Recently uploaded (20)
Stptg 4
- 1. 1652 Noninvasive Determination of Age-Related Changes in the Human Arterial Pulse R. Kelly, MB, FRACP, C. Hayward, MB, BSc, A. Avolio, PhD, and M. O'Rourke, MD, FACC Arterial pressure waves were recorded noninvasively from the carotid, radial, femoral, or all three of these arteries of 1,005 normal subjects, aged 2-91 years, using a new transcutaneous tonometer containing a high fidelity Millar micromanometer. Waves were ensemble-averaged into age-decade groups. Characteristic changes were noted with increasing age. In all sites, pulse amplitude increased with advancing age (carotid, 91.3%; radial 67.5%; femoral, 50.1% from first to eighth decade), diastolic decay steepened, and diastolic waves became less prominent. In the carotid pulse, there was, in youth, a second peak on the downstroke of the waves in late systole. After the third decade, this second peak rose with age to merge with and dominate the initial rise. In the radial pulse, a late systolic wave was also apparent, but this occurred later; with age, this second peak rose but not above the initial rise in early systole, even at the eighth decade. In the femoral artery, there was a single systolic wave at all ages. Aging changes in the arterial pulse are explicable on the basis of both an increase in arterial stiffness with increased pulse-wave velocity and progressively earlier wave reflection. These two factors may be separated and effects of the latter measured from pressure wave-contour analysis using an "augmentation index," determined by a computer algorithm developed from invasive pressure and flow data. Changes in peak pressure in the central (carotid) artery show increasing cardiac afterload with increasing age in a normal population; this can account for the cardiac hypertrophy that occurs with advancing age (even as other organs atrophy) and the predispo- sition to cardiac failure in the elderly. Identification of mechanisms responsible offers a new approach to reduction of left ventricular afterload. (Circulation 1989;80:1652-1659) A lthough the arterial pulse is the most funda- manometer. Despite classic texts on the pressure mental of physical signs and has been used pulse contour by Mackenzie3 and by Wiggers,4 by clinicians for hundreds of years, it was written in the early twentieth century, the sphyg- not until the last century that the contour of the momanometer was readily embraced as being more pressure pulse was first recorded noninvasively in ,"scientific" because it was able to quantify blood humans. The sphygmograph introduced by Marey pressure in terms of systolic and diastolic numbers. in 18601 was sufficiently simple to be applied in This ascendancy of sphygmomanometric values was clinical practice; this was done by Mahomed,2 who, also due to an absence of theory to describe or utilizing the instrument, first described the clinical interpret the pulse contour, an inability to use pulse entity of essential hypertension, and by Mackenzie,3 recordings usefully in clinical practice, and to prob- who described changes in both pulse contour and lems with artifacts inherent in the available mechan- rhythm observed in his general practice. This early ical recording systems. Thus, the use of the sphyg- work on pulse-contour recordings was soon eclipsed mograph in describing pressure-pulse waves by the introduction of the now ubiquitous sphygmo- declined, even as Einthoven's electrocardiograph was being quickly accepted for its description of From St. Vincent's Hospital (M.F.O'R.), Concord Hospital waves of electric activity. (C.H.), and University of New South Wales (A.A., M.F.O'R.), With subsequent clinical use of the sphygmoma- Sydney, Australia. R.K. was a Scholar of the National Health and Medical nometer, brachial arterial pressure has been Research Council of Australia and is now Overseas Research described in terms of the two extremes between Fellow with the National Heart Foundation of Australia at The which it fluctuates, the systolic and diastolic pres- Johns Hopkins University, Baltimore, Maryland. sures, and aging changes characterized as an increase Address for correspondence: Michael F. O'Rourke, Medical Professorial Unit, St. Vincent's Hospital, Victoria Street, Dar- in systolic pressure with little change in diastolic linghurst, Sydney 2010, Australia. pressure within the brachial artery.5 Furthermore, it Received October 27, 1988; revision accepted July 20, 1989. has been assumed that such change is the same in
- 2. Kelly et al Age-Related Pulse Changes 1653 APPLANATION TONOMETRY torted signal. Recordings are taken only when a reproducible signal is obtained with high amplitude excursion. Large amounts of overlying tissue make optimal waveforms harder to obtain; the technique is best applicable to superficial, large arteries such as the radial, carotid, and femoral. The sensor is a stiff ceramic beam on which are mounted piezo- resistive elements forming two arms of a Wheat- stone bridge. The remaining two arms are housed in the connector. This is attached to a standard Millar preamplifier box that amplifies the induced voltage change by a factor of 100. This amplified, electri- FIGURE 1. Diagram of applanation tonometry process. cally calibrated signal was then recorded on mag- Flattening of curved pressure containing structure allows netic tape. The accuracy of the probe has been accurate registration of transmitted pressure, because previously validated in animals and in human sub- stresses inherent in wall of curved surface are balanced jects with indwelling radial artery lines.9 Compari- when it is flattened. sons were made between directly and indirectly recorded radial artery pressure waves in 62 humans, between directly and indirectly recorded femoral all arteries. The effects of advancing age on the pressure waves in three dogs, and between directly arterial pulse contour, however, have not been recorded ascending aortic pressure waves and indi- precisely defined. rectly recorded carotid pressure waves in 17 humans. The aim of this study was to document age-related Comparison both in the time domain and by spec- changes in the arterial pulse contour, both in the tral analysis show excellent correspondence with central and peripheral arteries, using an instrument theoretic predictions. The tonometer provides a that would noninvasively register pressure wave high fidelity recording of arterial pressure wave contour without artifact and with such accuracy that contour under a wide variety of clinical conditions characteristics of the contour could be clearly and and pulse pressures. The stringent requirements quantitatively defined, much as we can now clearly delineated by more recent theoretical studies8 apply define features of electrocardiographic waves. Such to internally calibrated systems attempting to obtain precisely documented changes in the normal pulse accurate noninvasive measurements of absolute sys- with age will allow valid determination of the effects tolic and diastolic pressure levels. When, however, of disease states on the pressure wave contour. applanation tonometry is used to record pressure wave contour to supplement sphygmomanometric Methods readings, these exacting conditions are not neces- The Instrument sary. Accurate recordings of wave contour can To document aging changes in pulse contour in indeed be achieved under standard clinical condi- large numbers of the general population, an accu- tions. rate noninvasive method of measuring pressure- The tonometer voltage signal registers a pressure pulse waves was needed. The instrument devised is wave with harmonic content that does not signifi- a pencil-shaped probe held on the skin over the cantly differ from that of an intra-arterially recorded maximal arterial pulsation either by hand or by a wave.9 The output of the Millar preamplifier box micromanipulator. The probe incorporates a Millar electrically calibrates the signal in mm Hg (1 mV/ micromanometer in its tip and has the same high mm Hg) in the same way as the conventional Millar fidelity response as conventional Millar catheters.6 unit. The use of the tonometer on an exposed vessel Use of the probes is based on the principle of indeed records a waveform of amplitude virtually applanation tonometry, as is used in ocular tonom- identical to that recorded intra-arterially.9 Percuta- etry for registration of intraocular pressure. Essen- neous use of the probe records morphological fea- tially, if one can flatten or applanate (Figure 1) the tures of the wave that are accurately reproduced curved surface of a pressure-containing structure, over a wide range of pulse pressures9 although then the circumferential stresses in the wall of the absolute pulse pressure recorded might be less structure are balanced and the pressure registered reliable. Accordingly, the output of the instrument by the sensor is the true intra-arterial pressure.7'8 is reported in this manuscript with an arbitrary Like echocardiography and other noninvasive diag- amplitude scale of millivolt (mV) units. nostic techniques, applanation tonometry requires some training but readily can be mastered. Having Registration and Analysis located the point of maximal arterial pulsation, the Waveforms were recorded on an FM TEAC probe is placed over the vessel and pressed down magnetic tape recorder, digitized by a 12-bit analog on the artery against underlying bone. If no flat- to digital converter with an acquisition rate of 1 kHz tening is achieved, no consistent signal can be and entered into storage on disk by an IBM-AT registered. Excessive flattening produces a dis- computer. For each subject studied, six to eight
- 3. 1654 Circulation Vol 80, No 6, December 1989 A1 4. PP m:mHg] 10 AUGMENTATION INDEX = APIPP 10cm/sec] -_ j FIGURE 2. Graphic representation of augmentation index defined as ratio of AP/PP%. AP, pressure from shoulder to late peak; PP, pulse pressure. consecutively recorded pulses were averaged, their alignment being triggered at the occurrence of the maximum rise time determined by the smoothed first differential of the signal (dP/dt). The averaged pulse was then taken as the representative pulse for that individual. An ensemble average of similar representative waves from 30-70 other subjects in FIGURE 3. Graphic plotting of representative ascending the same age decade was obtained to form a repre- aortic pressure (solid line above) and flow (dashed line sentative wave and 2 SDs for that particular age above). Below is shown fourth derivative of pressure decade. Thus, a series of decade waves was estab- (solid line). First zero crossing offourth derivative corre- lished, each being the average of approximately 50 sponds to beginning of pressure wave upstroke (AA). representative waveforms from individuals of simi- Second zero crossing in same direction (from above to lar age. Subjects with heart rates greater than 100 below) corresponds to beginning of second wave, which beats/min were excluded to avoid excessive trunca- is close to peak of flow (BB). tion of the age-decade wave (to that of the subject with the shortest heart period) during the averaging process. ascending aortic pressure wave, the time deriva- Carotid waveforms were further analyzed to mea- tives of pressure, and the peak of simultaneously sure the "shoulder" and "peak" of the waves. recorded flow. The simultaneously recorded pres- Such analysis of wave contour has been done sure and flow-velocity data were digitized at 0.01- previously by Murgo et al0 and Takazawa"l for second intervals and were plotted with the first four invasively recorded ascending aortic waves and, derivatives of pressure. When plotted against pres- also, by Fujii et a112 for noninvasively recorded sure derivatives, the timing of the shoulder was waves. We defined the augmentation index for each reliably indicated by a local minimum in the first wave as the ratio of height of the peak above the derivative that was in the range from 0 to 50 msec of shoulder of the wave to the pulse pressure (Figure the peak of flow (the mean estimate from interpola- 2). This can be done from visual inspection as has tion between sample points determined from 13 been used previously.10-12 Such identification, how- patients) being 27 msec once correction had been ever, can be highly subjective because the shoulder made for the frequency response of the flowmeter is often not a clearly defined point but sometimes a (10 msec). To simplify the algorithm for detection of less well defined plateau region on the systolic this point, higher-order derivatives were used to upstroke. We, therefore, chose to identify the shoul- identify the zero-crossing point equivalent to the der automatically from the time derivative of the local minimum of the first derivative. The first zero pressure wave, as herein described. crossing of the fourth derivative (in a direction from above to below the zero line) corresponded to the Measurement and Justification of beginning of the pressure wave upstroke (line AA, Augmentation Index Figure 3). The second zero crossing in the same From invasive ascending aortic pressure and flow direction corresponded to the shoulder at the begin- velocity data previously reported,'3 we have noted ning of the second wave, which constituted the late there exists a correspondence between the peak of systolic peak (line BB, Figure 3). A good correla- flow and the shoulder of pressure. The shoulder of tion was found between the time to the second zero the pressure wave is defined as the first concavity crossing of the fourth derivative (x) and the timing on the upstroke of the wave and separates the initial of the peak of flow (y) in the patients studied pressure rise from the late systolic peak that occurs (y=0.91+1.31x; R=0.75). in middle aged and older subjects.10 A computer Such a relation between peak flow and the shoul- algorithm was written to identify this shoulder in a der of the pressure wave is to be expected if the more objective, automated way than visual inspec- shoulder of the wave indicates the pressure rise tion by using time derivatives of the pressure wave. resulting from peak flow input into the vasculature Reanalysis of the invasive data was performed to before the effects of wave reflection.10"13,'4 Hence, ascertain the relation between the shoulder of the we decided to use the algorithm as described to
- 4. Kelly et al Age-Related Pulse Changes 1655 RADIAL PULSE CONTOUR CAROTID PULSE CONTOUR I 10 mV UNITS' DECADE I10 mv UNfTS DECADE 2 2 3 3 4 4. 5 5 6 6 7 7 8 a 0 1 50 300 450 600 750 0 1 50 300 450 600 7S0 TIME(msec) TIME(msec) FIGURE 4. Contours showing averaged radial waves FIGURE 5. Contours showing averaged carotid waves from 420 subjects. Radial waveforms are displayed above from 407 subjects. Carotid pulse contour from first dec- each other from infants in the first decade (1), through ade (1) to eighth decade (8), each pulse being average of children, to adults up to the eighth decade (8). Each pulse 40-70 individual pulses. *Amplitude is expressed in mV is average of 40-70 individual pulses. *Amplitude is units. expressed in uncalibrated voltage (m V) units although the Millar preamplifier box electrically calibrates the output signal in mm Hg. Results The radial pulse contour recorded in 420 subjects detect the contribution of wave reflection to chang- showed characteristic changes with increasing age ing carotid pulse contour. The method used is auto- (Figure 4). The radial pulse contour in children matic and excludes subjective bias. It identifies a shows multiple prominent fluctuations. With advanc- point on the pressure wave very close to peak flow in ing age, these become less distinct and the systolic the ascending aorta, and is justifiable on the theoret- peaks progressively broader, although the maxi- ical basis of wave travel and reflection in the aorta. mum still usually occurs in early systole. In con- trast, the carotid wave recorded in 407 subjects Subjects shows not so much a broadening but the emergence Volunteers studied were from the out-of-hospital of the late systolic peak, which determines the community-based population considered to repre- systolic pressure level (Figure 5). With increasing sent the normal population. Volunteers were Cau- aging, the principal change in the carotid pulse is a casians from both urban and rural areas who were progressive rise in the second systolic peak that, 2-91 years old. They were screened on the basis of after the third decade, merges with and dominates cardiovascular history and examination; those with the initial rise. The femoral waveforms (Figure 6) valvular heart disease or chronically treated cardio- also show a progressive rise in the systolic wave vascular disease were excluded. Subjects found to and loss of any diastolic wave. have mild hypertension (diastolic blood pressure The amplitude (pulse pressure) of the carotid >95 and <105 mm Hg), 4.8% of the sample, were wave increases by 91.3% from the first to eighth included in analysis as part of the spectrum in the decade compared with a 67.5% increase in the general population. Radial pressure waveforms were radial pulse and a 50.1% increase in the femoral obtained from 420 subjects (207 men and 213 wom- pulse. This greater increase is due to change in two en), of whom 38 were smokers; carotid waveforms parts of the carotid wave. After the third decade of were from a further 407 subjects (181 men and 226 women), of whom 82 were smokers; and femoral life, a late systolic peak becomes dominant, which waveforms were from 178 subjects of similar age adds to the initial pressure rise and so defines the (110 men and 68 women), of whom five were shoulder on the upstroke of the wave. The total 91% smokers. Of all the subjects studied, 28 were on increase in carotid pulse pressure from the first to monotherapy for hypertension at the time of study. the eighth decade is due to an increase in both the rise to this initial shoulder (by an average 20 mV Statistical Analysis units or 53% of the increase) and the height of the Statistical analysis was performed using a two-tail late peak above the shoulder (averaging 18 mV unpaired Student's t test with a significant difference units) (Table 1). This change in carotid pulse con- being at the level ofp equaling less than 0.05. tour was quantified by the augmentation index
- 5. 1656 Circulation Vol 80, No 6, December 1989 FEMORAL PULSE CONTOUR TABLE 2. Ascending Aortic Blood Flow Velocity Profile DECADE Age Age <30 yr >60 yr p Average peak flow velocity (cm/sec) 94+10 67+13 0.01 2 Average acceleration (cm/sec2) 921±+ 113 650+280 0.05 3 Mean ejection time 4 (msec) 290+30 293+38 NS Values are mean+one SD. 5 6 although rate of flow acceleration and peak flow velocity are reported to decline with increasing age.16 We sought to verify that our study population 8 concurred with these results by studying a sample of subjects using Doppler flow techniques. From 0 1 50 300 450 600 750 the original cohort, a group of 12 older (>60 years) TIME(msec) and 13 younger (<30 years) subjects were studied. FIGURE 6. Contours showing averaged waves from 178 Parameters compared were peak flow velocity (cm/ subjects. Femoral pulse contour from first decade (1) to sec), acceleration of systolic upstroke, and ejection eighth decade (8). *Amplitude is expressed in mV units. time. This group spanned a wider range of age (19-80 years) than the data previously reported by Nichols et al.14 Ultrasonography was done with a measured by the algorithm developed using inva- Toshiba Sonolayer SSH 65 A phased array ultra- sive aortic pressure and flow data. sonograph and a 2.5-MHz pulsed-wave Doppler When this algorithm was applied to the carotid probe. Recordings were made with subjects in a wave age-decade data, it was found that although supine, rested position. Recordings of ascending the timing of the shoulder was within 14 msec for all aortic flow were taken from the suprasternal notch eight decades (range, 102-116 msec, after the onset (where sampling was done near the inner curvature of systole), the height of the shoulder and the late at the aortic root), the right parasternal, and the peak both showed a substantial increase with age. apical positions. Signals analyzed were those that (Table 1). The height of the shoulder increased from gave the best delineated velocity profile at any of 39 to 59 mV units above diastolic pressure from the the three positions. first to the eighth decade, whereas the late peak As has been found by other workers, ejection increased from less than 1 to 19 mV units above the time remained constant with increasing age, although shoulder. The corresponding augmentation index peak flow velocity and acceleration did decline with increased from 1.6% to 24.1%. increasing age (Table 2). As will be discussed, the Changes in pressure-pulse contour are due to changes in pressure wave contour with increasing changes in the systemic vasculature itself or to age are explicable mainly on the basis of changes in differing flow input into the vasculature from the the systemic vasculature with increasing age because heart. Previous studies have shown that at rest there were few changes in flow input into the there is little change in stroke volume or ejection system as detected by ascending Doppler flow mea- fraction with increasing age.15 Aortic flow-velocity surements (Figure 7). profile does not alter in contour with increasing age, Discussion TABLE 1. Carotid Waveform Analysis These characteristic age-decade pulse waveforms Height of represent the largest sample of noninvasive record- Height of peak Augmen- ings of the pulse yet made in human subjects. The Time to shoulder above tation accuracy of the recordings is dependent on both the Age shoulder above foot shoulder index principle of applanation tonometry, which is based (yr) (msec) (mV units) (mV units) (%) on well established theory,8 and also the use of high 1-10 116 39.4 0.6 1.6 fidelity Millar micromanometers incorporated into 11-20 116 50.1 1.6 3.0 the tip of the probes. The technique has been shown 21-30 110 51.3 2.7 4.9 to be accurate in registering intra-arterial pressure 31-40 110 46.5 3.7 7.4 waves as compared in the time domain and by 41-50 102 42.6 8.4 16.5 spectral analysis.9 Previous noninvasive pulse 51-60 102 43.0 11.1 20.5 recordings have used wave tracings obtained by 61-70 102 47.1 14.9 24.1 displacement of a volume of air or fluid contained in 71+ 106 59.0 a capsule fixed over the arterial pulsation.'7,18 Such 18.7 24.1 volume displacement techniques are limited by
- 6. Kelly et al Age-Related Pulse Changes 1657 cess used to obtain age-decade waveforms resulted in obvious smoothing of high frequency compo- 100 nents of the wave such as the incisura. Never- theless, there is still a clear change in pressure wave contour with increasing age. There is a progressive U rise in a late systolic fluctuation in both so that it - becomes the late peak of pressure in the carotid c artery after the third decade, and that becomes equal to the initial pressure peak in the radial pulse at the eighth decade. The result is a greater increase in carotid pulse pressure with increasing age than in either of the peripheral pulses because, in the carotid, the late peak is added to the initial pressure rise. The rise in this late systolic fluctuation in both the radial and carotid pulses is explicably due to faster return of wave reflection from the lower body. Such altered timing of wave reflection has 40 mVT 80 mV been discussed at length elsewhere and is largely wL UNITS1 UNITS' responsible for the suboptimal coupling of the vas- a. ' . culature to left ventricular function that is known to occur with increasing age.14 As aging occurs, there are dramatic changes in the vasculature that increase cardiac afterload.14,19 YOUNG OLD Both nonpulsatile (peripheral resistance) and pulsa- FIGURE 7. Upper: Ascending aortic blood flow velocity tile (characteristic impedance and wave reflections) profile recorded by Doppler ultrasonography in 19- components of arterial load increase with increasing year-old male (young) and 72-year-old male (old). Lower: age. The age-related increase in left ventricular Carotid pressure pulse contour recorded by arterial tonom- pressure load is primarily due to increased aortic etry in same individuals. With increasing age, there is stiffness (characteristic impedance) that increases marked increase in pulse pressure, mostly due to late aortic and left ventricular pressure at its early systolic peak, with concomitant lesser reduction in peak systolic peak or shoulder and secondarily due to flow velocity. *Amplitude is expressed in mV units. augmented early wave reflection that raises pres- sure from the shoulder to the late systolic peak.10"4 movement artifact, by errors due to the large size of The results in Table 1 show these two effects on the the capsule relative to the size of the artery, by carotid pressure pulse as they increase from the first inability to separate carotid and venous pulsations, compared with the eighth decade. In the intervening by need for a significant "hold-down" force for years, however, the increase in pulse pressure with optimal signal registration, and by a high damping increasing age is primarily due to an increase in coefficient causing attenuation of high frequency wave reflection (height of the late systolic peak). characteristics. Nevertheless, these techniques have Although the 20-mV-units increase in shoulder height given valuable information and extended the earlier across the full age spectrum is consistent with the work of Marey,' Mahomed,2 and Mackenzie.3 In known increase in aortic stiffness of large arteries contrast to such capsules that rely on magnification with increasing age, its constancy in middle age of vessel wall displacement, tonometry is not depen- may be explained by the concomitant decrease in dent on volume changes. It requires minimal hold- peak velocity that occurs with increasing age.'6 down force and is much less subject to artifact Although, in middle years the progressive increase related to placement over the pulse because the in arterial stiffness is balanced by a gradual decrease micromanometer in the tip of the probe is very in peak flow from the heart, with the passage of small (0.5 x 1.0 mm, o.d.) compared to the diameter time, the degenerative vascular changes are greater of the artery. Tonometry, thus, registers the arterial and, by the seventh and eighth decades, there is an pressure pulse much as the clinician feels it by increased characteristic impedance and consequent palpation. increased height of the shoulder above diastolic The changes in the femoral pulse with age are pressure. This study shows that, with increasing characterized by a progressive increase in the size age, increased aortic stiffness and increased early of the systolic peak with a resultant increase in wave reflection contribute approximately equally to pulse pressure, whereas diastolic fluctuations dimin- ventricular load as assessed by the central pressure ish. There are no secondary systolic fluctuations in pulse (20 versus 18 mV units). the femoral pulse. In contrast, the carotid and radial The increase in the late systolic pressure peak waves show an increase in pulse amplitude with with increasing age is substantial and represents an age, as well as important changes in the contour of increase of 25% of pulse pressure in the carotid secondary systolic fluctuations. The averaging pro- artery between the ages of 30 and 60 years (Figure
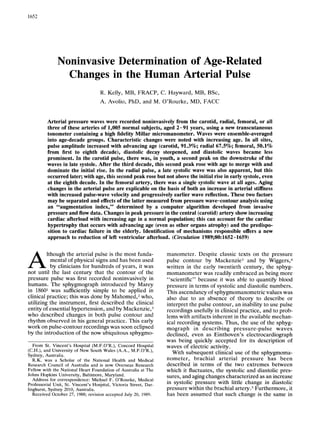
- 7. 1658 Circulation Vol 80, No 6, December 1989 AUGMENTATION INDEX - CAROTID ARTERY in part, reversible by the use of nitroglycerin, which reduces the reflected wave component.13,23-24 These characteristic age-related changes in the 60 pulse waveform have established a profile of normal- aging changes that will allow the effects of disease - 40 - states to be more precisely defined. The increase in systolic and pulse pressure, particularly in the cen- z 20 - tral carotid pulse, have important implications for W 0 cc the aging population. Increase in peak systolic 0. pressure and increased pulsation around the mean pressure level result in increased cyclic stresses on the structure of arterial walls and account for the propensity of large arteries to rupture or develop 5 15 25 35 45 55 65 75 + atheromatous occlusive disease with increasing AGE age.25 The findings in this study concur with previ- FIGURE 8. Graph of augmentation index for carotid ous epidemiologic data, showing the importance of artery as function of age. systolic pressure as a risk factor for cardiovascular morbidity and mortality with advancing age.26'27 In addition, these findings provide important answers 8). This may be compared with previous data of to the question posed by the most recent of these Murgo et al10 and Takazawa"l for invasive data from studies,28 regarding the determinants of systolic the ascending aorta. These two studies show a 40% pressure levels in both central and peripheral increase in pulse pressure between the ages of 30 arteries. and 60 years (Figure 9). Comparison of Figures 8 Furthermore, the fact that the radial pulse shows and 9 shows that although the carotid pressure different but complementary changes to those in the pulse tends to underestimate the magnitude of age- carotid pulse has important implications for diag- related changes, the carotid pulse detected by appla- nostic approaches and treatment. It is clear that the nation tonometry is a good noninvasive guide to increase in radial (and femoral) systolic pressures events in the central aorta. underestimate the age-related rise in central systolic The relevance of these pressure changes to left pressure because it does not include the character- ventricular afterload is apparent when one consid- istic rise in the late systolic peak seen in the central ers known changes in left ventricular structure and arteries of mature adults. Hence, in subjects aged function with increasing age. The increase in the 40-70 years, measurements of sphygmomanometric late systolic peak in the carotid pulse occurs from pressure might substantially underestimate the effect the third decade onward, which is the same time at of vasoactive drugs on ventricular afterload because which the age-related increase in left ventricular a reduction in the late carotid pressure peak might mass commences.20,21 This increase in mass with increasing age is accompanied by changes in left occur with little or no change in peripheral systolic ventricular function.22 Furthermore, recent studies pressure. This is because, in the peripheral pulse, have shown that the increased ventricular load and the reflected wave is on the downstroke of systole suboptimal ventricular-vascular coupling repre- rather than at its peak and, although reduced by sented by these pressure-pulse changes are, at least vasoactive drugs, it has little effect on peak systolic pressure. On the other hand, further investigation is warranted to see if a predictive index of central AUGMENTATION INDEX - ASCENDING AORTA systolic pressure changes might be obtained from 80 analysis of the late systolic fluctuation in the 60 peripheral (radial) pressure pulse waveform. The determination of age-related changes in the J 40 r arterial pulse by high fidelity applanation tonome- try, thus, provides important supplementary infor- 20 z W mation to that obtained by use of the sphygmoma- cc W' 0- nometer. The use of this modern-day sphygmograph enhances new investigations of the ill effects of -20v TWZAWA aging and disease states on cardiovascular function and extends the earlier observations of Mahomed,2 -40* Mackenzie,3 and Freis et al.17 0 10 20 30 40 50 60 70 80 AGE Acknowledgments FIGURE 9. Scatterplot ofaugmentation indexfor ascend- We acknowledge J. Ganis, BSc, and J. Daley, ing aorta as function of age; from data published by RN, for assistance in data collection and prepara- Murgo et a110 (n) and Takazawa" (A). tion of this manuscript.
- 8. Kelly et al Age-Related Pulse Changes 1659 The arterial tonometer was developed with the 16. Gardin JM, Burn CS, Childs WJ, Henry WL: Evaluation of assistance of Mr. Huntley Millar, Houston, and Dr. blood flow velocity in the ascending aorta and main pulmo- nary artery of normal subjects by Doppler echocardiogra- D. Winter, South-West Research Institute, San phy. Am Heart J 1984;107:310-319 Antonio, Texas. 17. Freis ED, Heath WC, Luchsinger PC, Snell RE: Change in the carotid pulse which occur with age and hypertension. References Am Heart J 1966;71:757-765 1. Marey EJ: Recherches sur le Pouls au Moyen d'un Nouvel 18. Craige E, Smith D: Heart sounds: Phonocardiographs; Apareil Enregistreur-le Sphygmographe. Paris, E. Thunot carotid, apex and jugular venous pulse tracing; and systolic et Cie, 1860 time intervals, in Braunwald E (ed): A Textbook of Cardio- 2. Mahomed F: The aetiology of Bright's disease and the vascular Medicine. Philadelphia, Saunders, 1988, pp 41-64 prealbuminuric stage. Med Chir Trans 1874;57:197-228 19. Yin FCP: Aging and vascular impedance, in Yin FCP (ed): 3. Mackenzie J: The Study of the Pulse. Edinburgh, McMillan, Ventricular/Vascular Coupling. New York, Springer- 1902, pp 8-28, 67-82 Verlag, 1988, pp 115-137 4. Wiggers CJ: The Pressure Pulses in the Cardiovascular 20. Linzbach AJ, Akuomoa-Boateng E: Alternsveranderungen System. London, Longmans, Green and Co, 1928, pp 65-90 des menschlichen Herzens. 1. Das Herzgewicht in Alter. 5. Roberts J (ed): Blood Pressure Levels of Persons 6-74 Klin Wochenschr 1973;51:156-163 Years. United States, 1971-1974 21. Gerstenblith G, Fredericksen J, Yin FCP, Fortuin NJ, 6. Murgo JP, Giolma JP, Altobelli SA: Signal acquisition and Lakatta EG, Weisfeldt ML: Echocardiographic assessment processing for human haemodynamic research. Proc IEEE of a normal adult aging population. Circulation 1977; 1977;65:696-702 56:273-278 7. Mackay RS, Marg E, Oechsli R: Automatic tonometer with 22. Nichols WW, O'Rourke MF, Avolio AP, Yaginuma T, exact theory: Various biological applications. Science 1960; Murgo JP, Pepine CJ, Conti CR: Age-related changes in left 131: 1688-1689 ventricular/arterial coupling, in Yin FCP (ed): Ventricular! 8. Drzewiecki GM, Melbin J, Noordergraaf A: Deformational Vascular Coupling. New York, Springer-Verlag, 1988, pp forces in arterial tonometry. IEEE Front Eng Comput Health 79-114 Care 1984;28:642-645 23. Latson TW, Hunter WC, Katoh N, Sagawa K: Effect of 9. Kelly R, Hayward C, Ganis J, Daley J, Avolio A, O'Rourke nitroglycerin on aortic impedance, diameter and pulse wave M: Non-invasive registration of the arterial pressure pulse velocity. Circ Res 1988;62:884-890 waveform using high-fidelity applanation tonometry. J Vasc 24. Fitchett D, Simkus G, Beaudiy J, Marpole D: Reflected pressure waves in the ascending aorta: Effect of glyceryl Med Biol 1989;3:142-149 10. Murgo JP, Westerhof N, Giolma JP, Altobelli SA: Aortic trinitrate. Cardiovasc Res 1988;22:494-500 input impedance in normal man: Relationship to pressure 25. O'Rourke MF: Hypertension, in O'Rourke MF (ed): Arterial waveforms. Circulation 1980;62:105-116 Function in Health and Disease. Edinburgh, Churchill Liv- 11. Takazawa K: A clinical study of the second component of ingstone, 1982, pp 185-195, 210-224 left ventricular systolic pressure. J Tokyo Med Coll 1987; 26. Kannel WB, Castelli WP, McNamara PM, McKee PA, 45:256-270 Feinlab M: Role of blood pressure in the development of 12. Fujii M, Yaginuma T, Takazawa K, Noda T, Komatsu H, congestive heart failure. N Engl J Med 1972;287:781-787 Katsui T, Watabiki H, Kawada Y, Hosoda S: Non-invasive 27. Kannel WB, Wolf PA, McGee DL, Dawber TR, McNamara detection for reflection wave in the arterial system, in P, Castelli WP: Systolic blood pressure, arterial rigidity and Automedica vol. 9. New York, Gordon & Breach, 1987, p 49 risk of stroke. The Framingham Study. JAMA 1981; 13. Yaginuma T, Avolio AP, O'Rourke MF, Nichols WW, 245:1225-1229 Morgan JP, Roy P, Baron D, Branson J, Feneley M: Effects 28. Rutan GH, Kuller LH, M Neaton JD, Wentworth DN, of glyceryl trinitrate on peripheral arteries alters left ventric- McDonald RH, McFate-Smith W: Mortality associated with ular hydraulic load in man. Cardiovasc Res 1986;20:153-160 diastolic hypertension and isolated systolic hypertension among men screened for Multiple Risk Factor Intervention 14. Nichols W, O'Rourke M, Avolio A, Yaginuma T, Murgo J, Trial. Circulation 1988;77:504-514 Pepine CJ, Conti CR: Effects of age on ventricular-vascular coupling. Am J Cardiol 1985;55:1179-1184 15. Weisfeldt M, Lakatta EG, Gerstenblith G: Aging and cardiac disease, in Braunwald E (ed): A Textbook of Cardiovascular KEY WORDS * applanation tonometry * arteriosclerosis . Medicine. Philadelphia, Saunders, 1988, pp 1650-1662 wave reflection