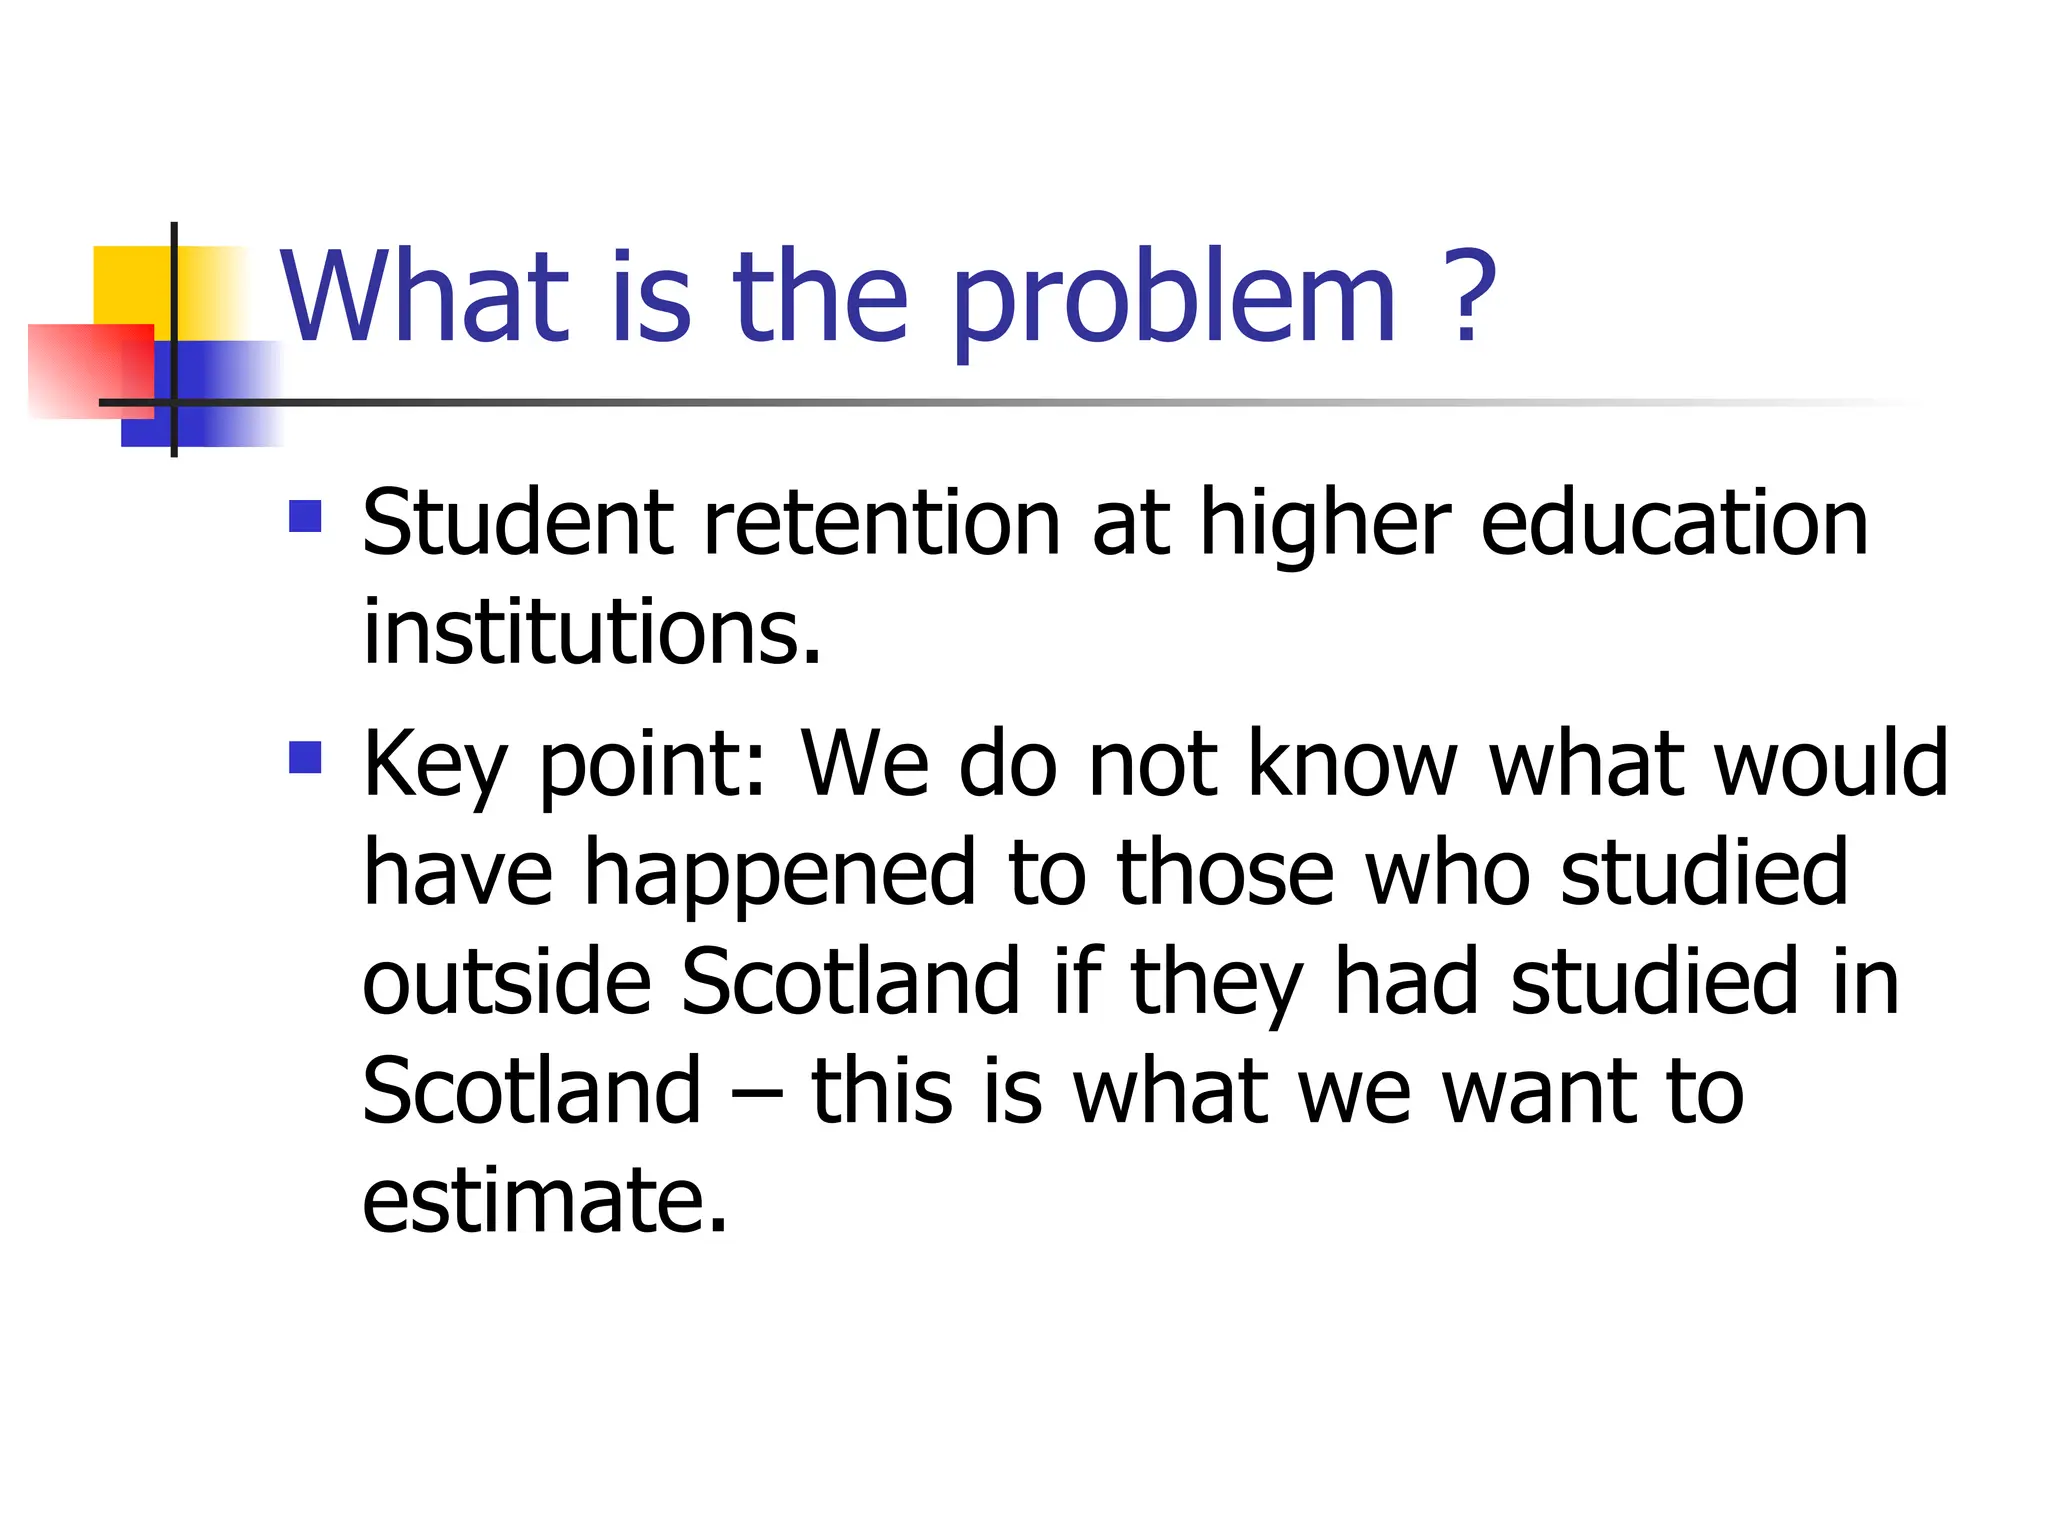
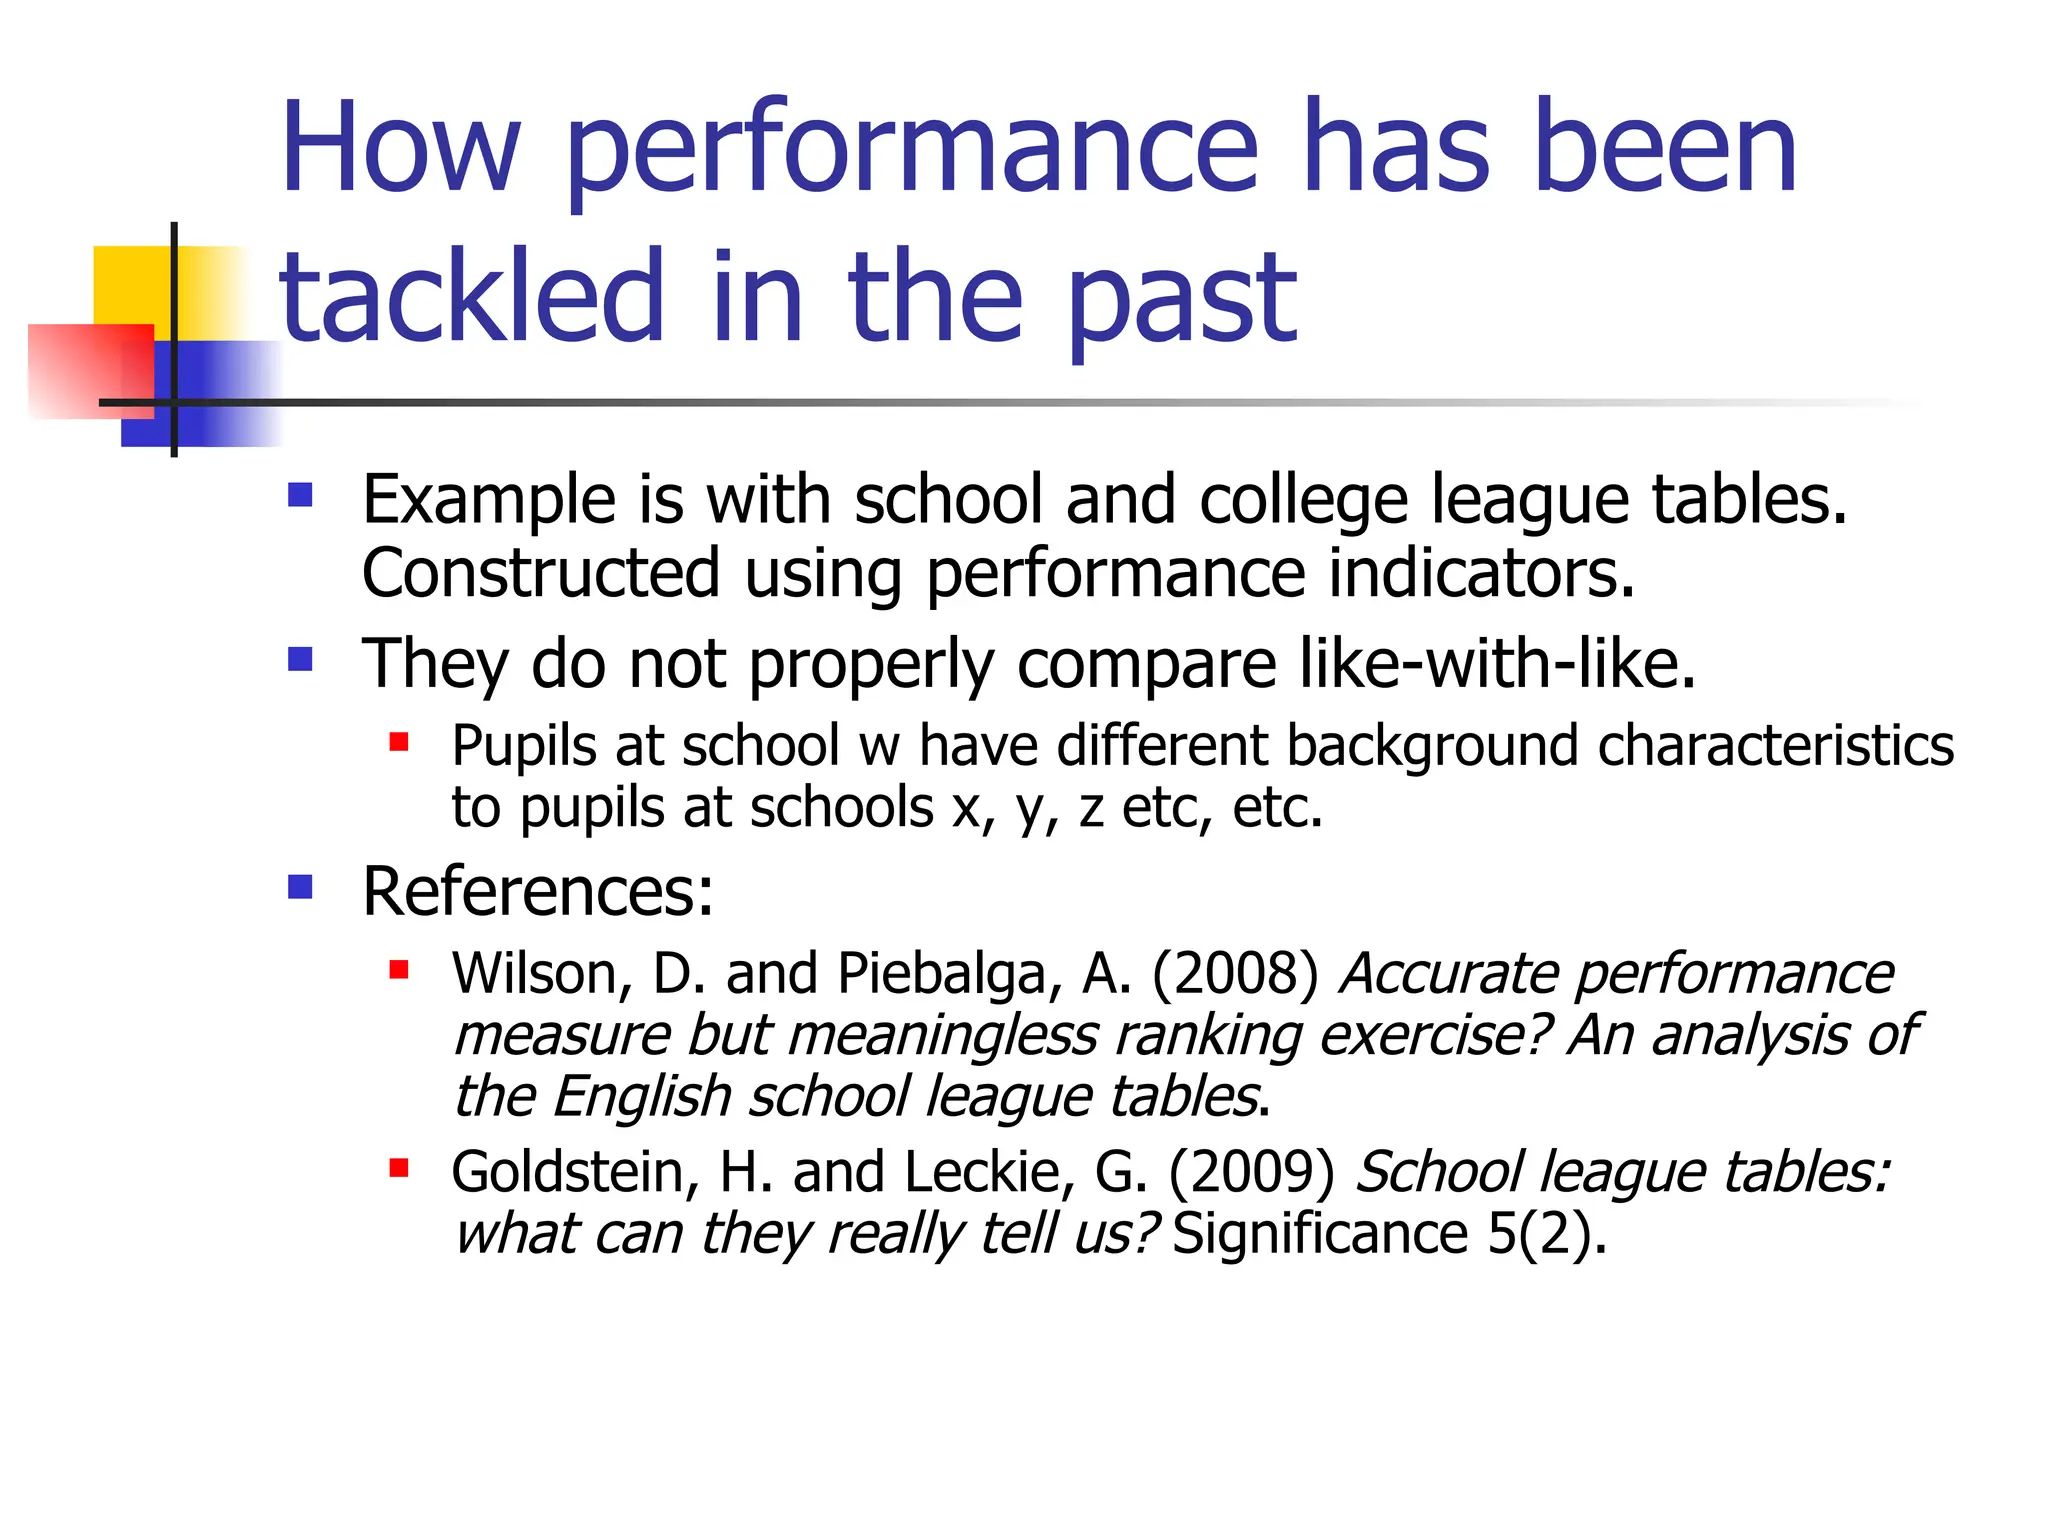
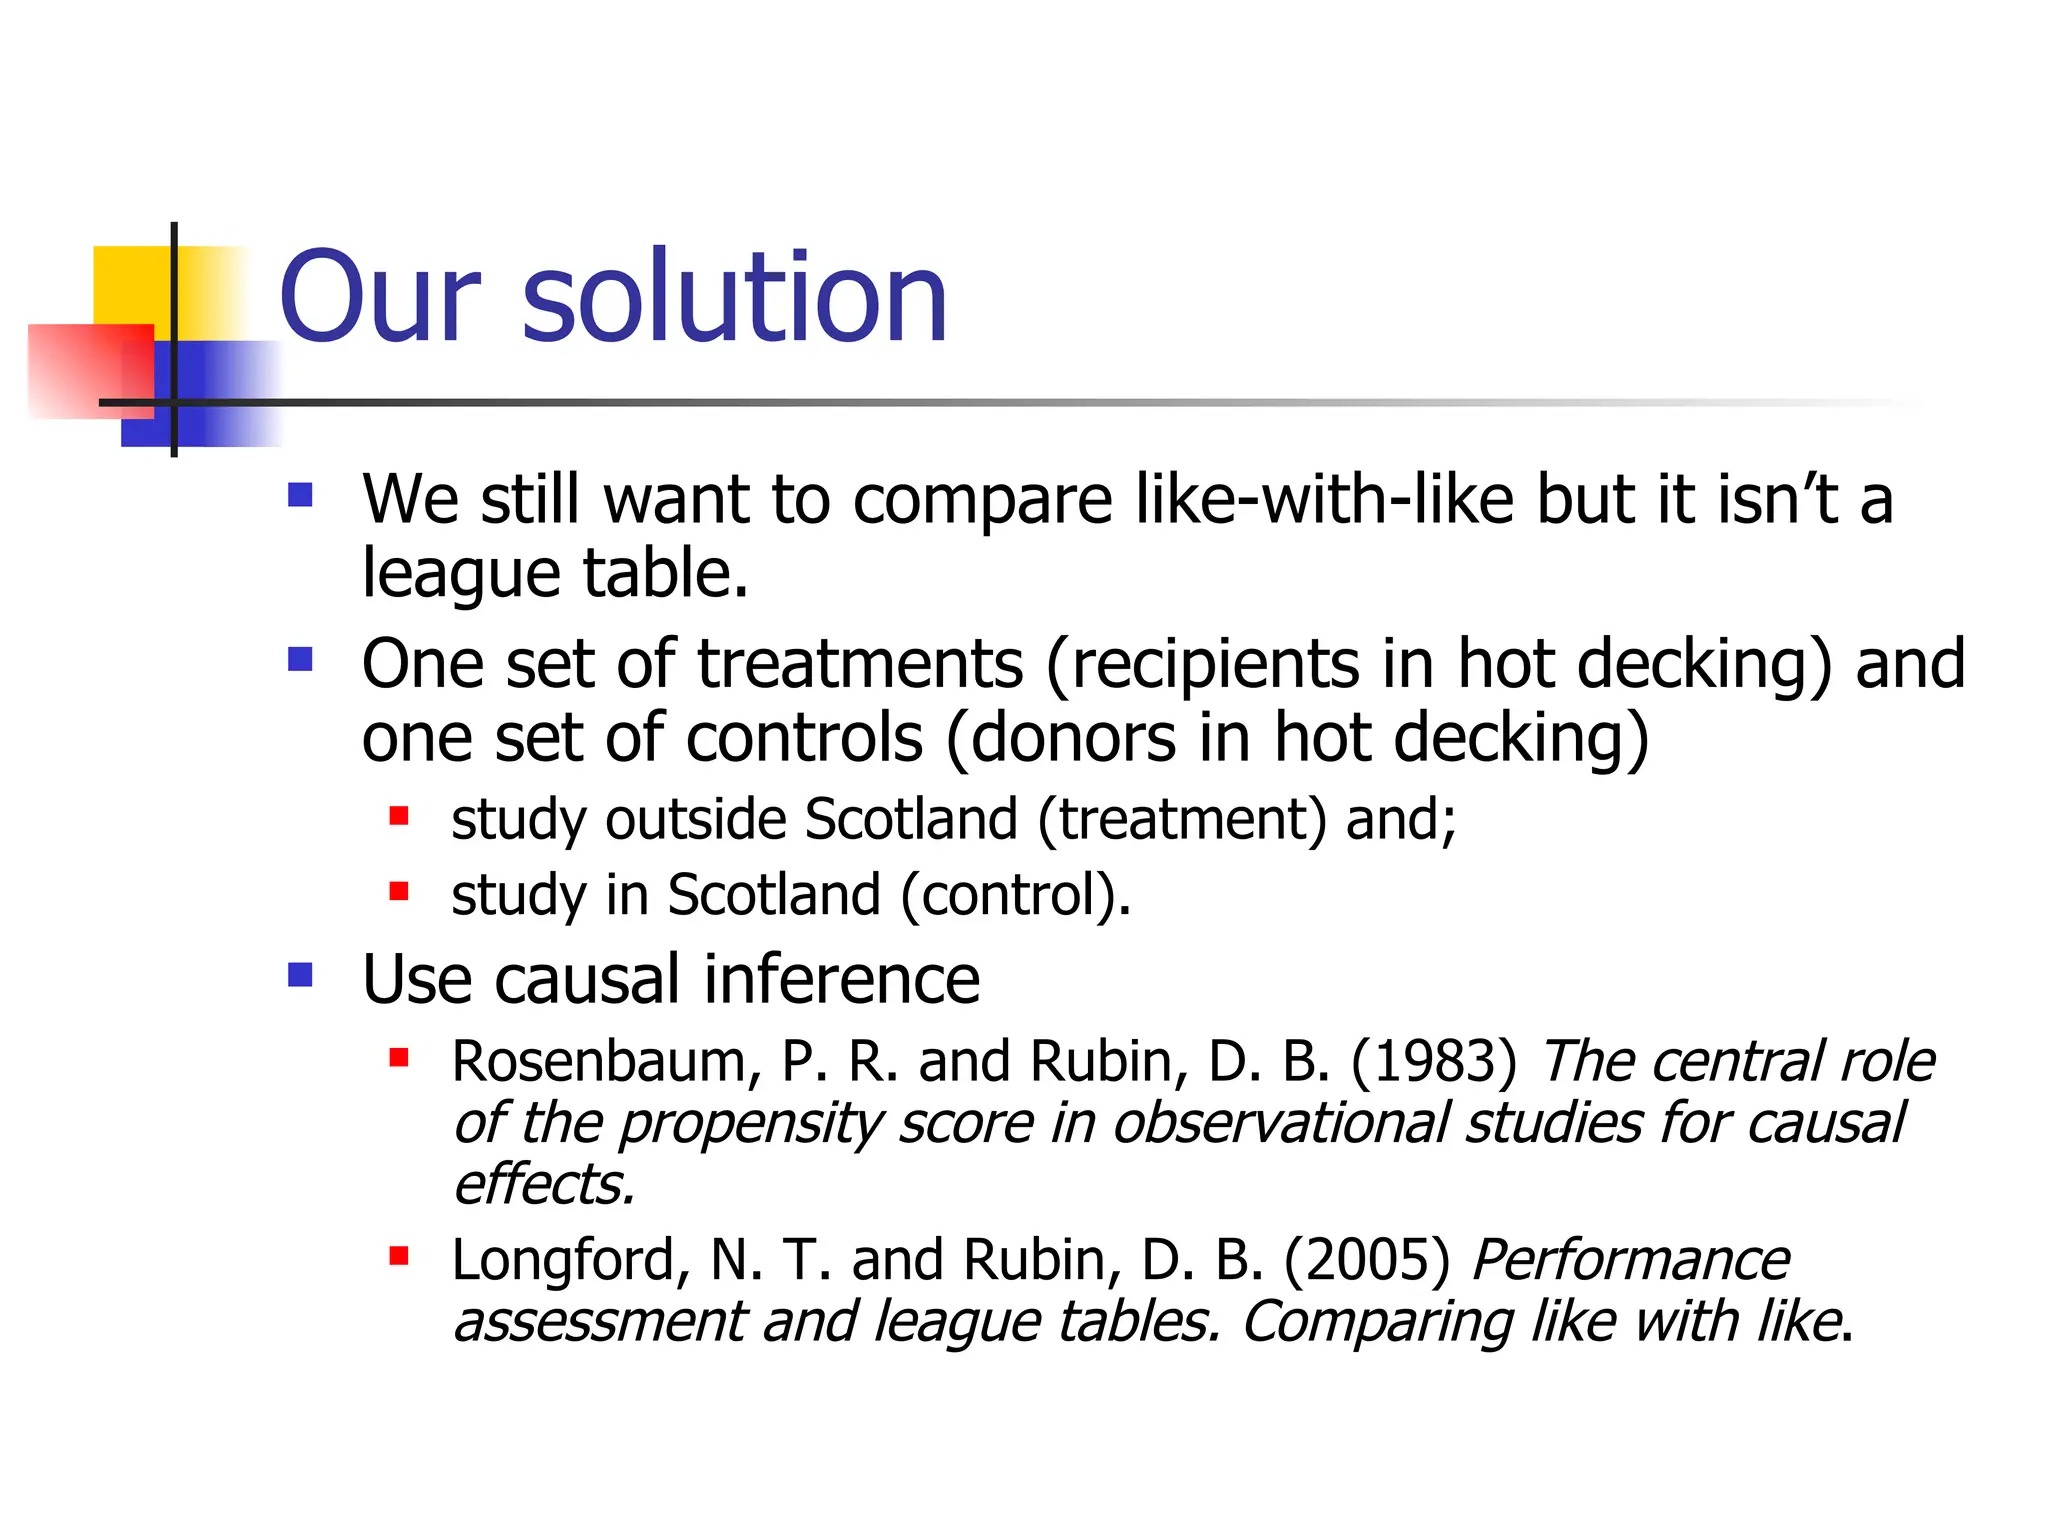
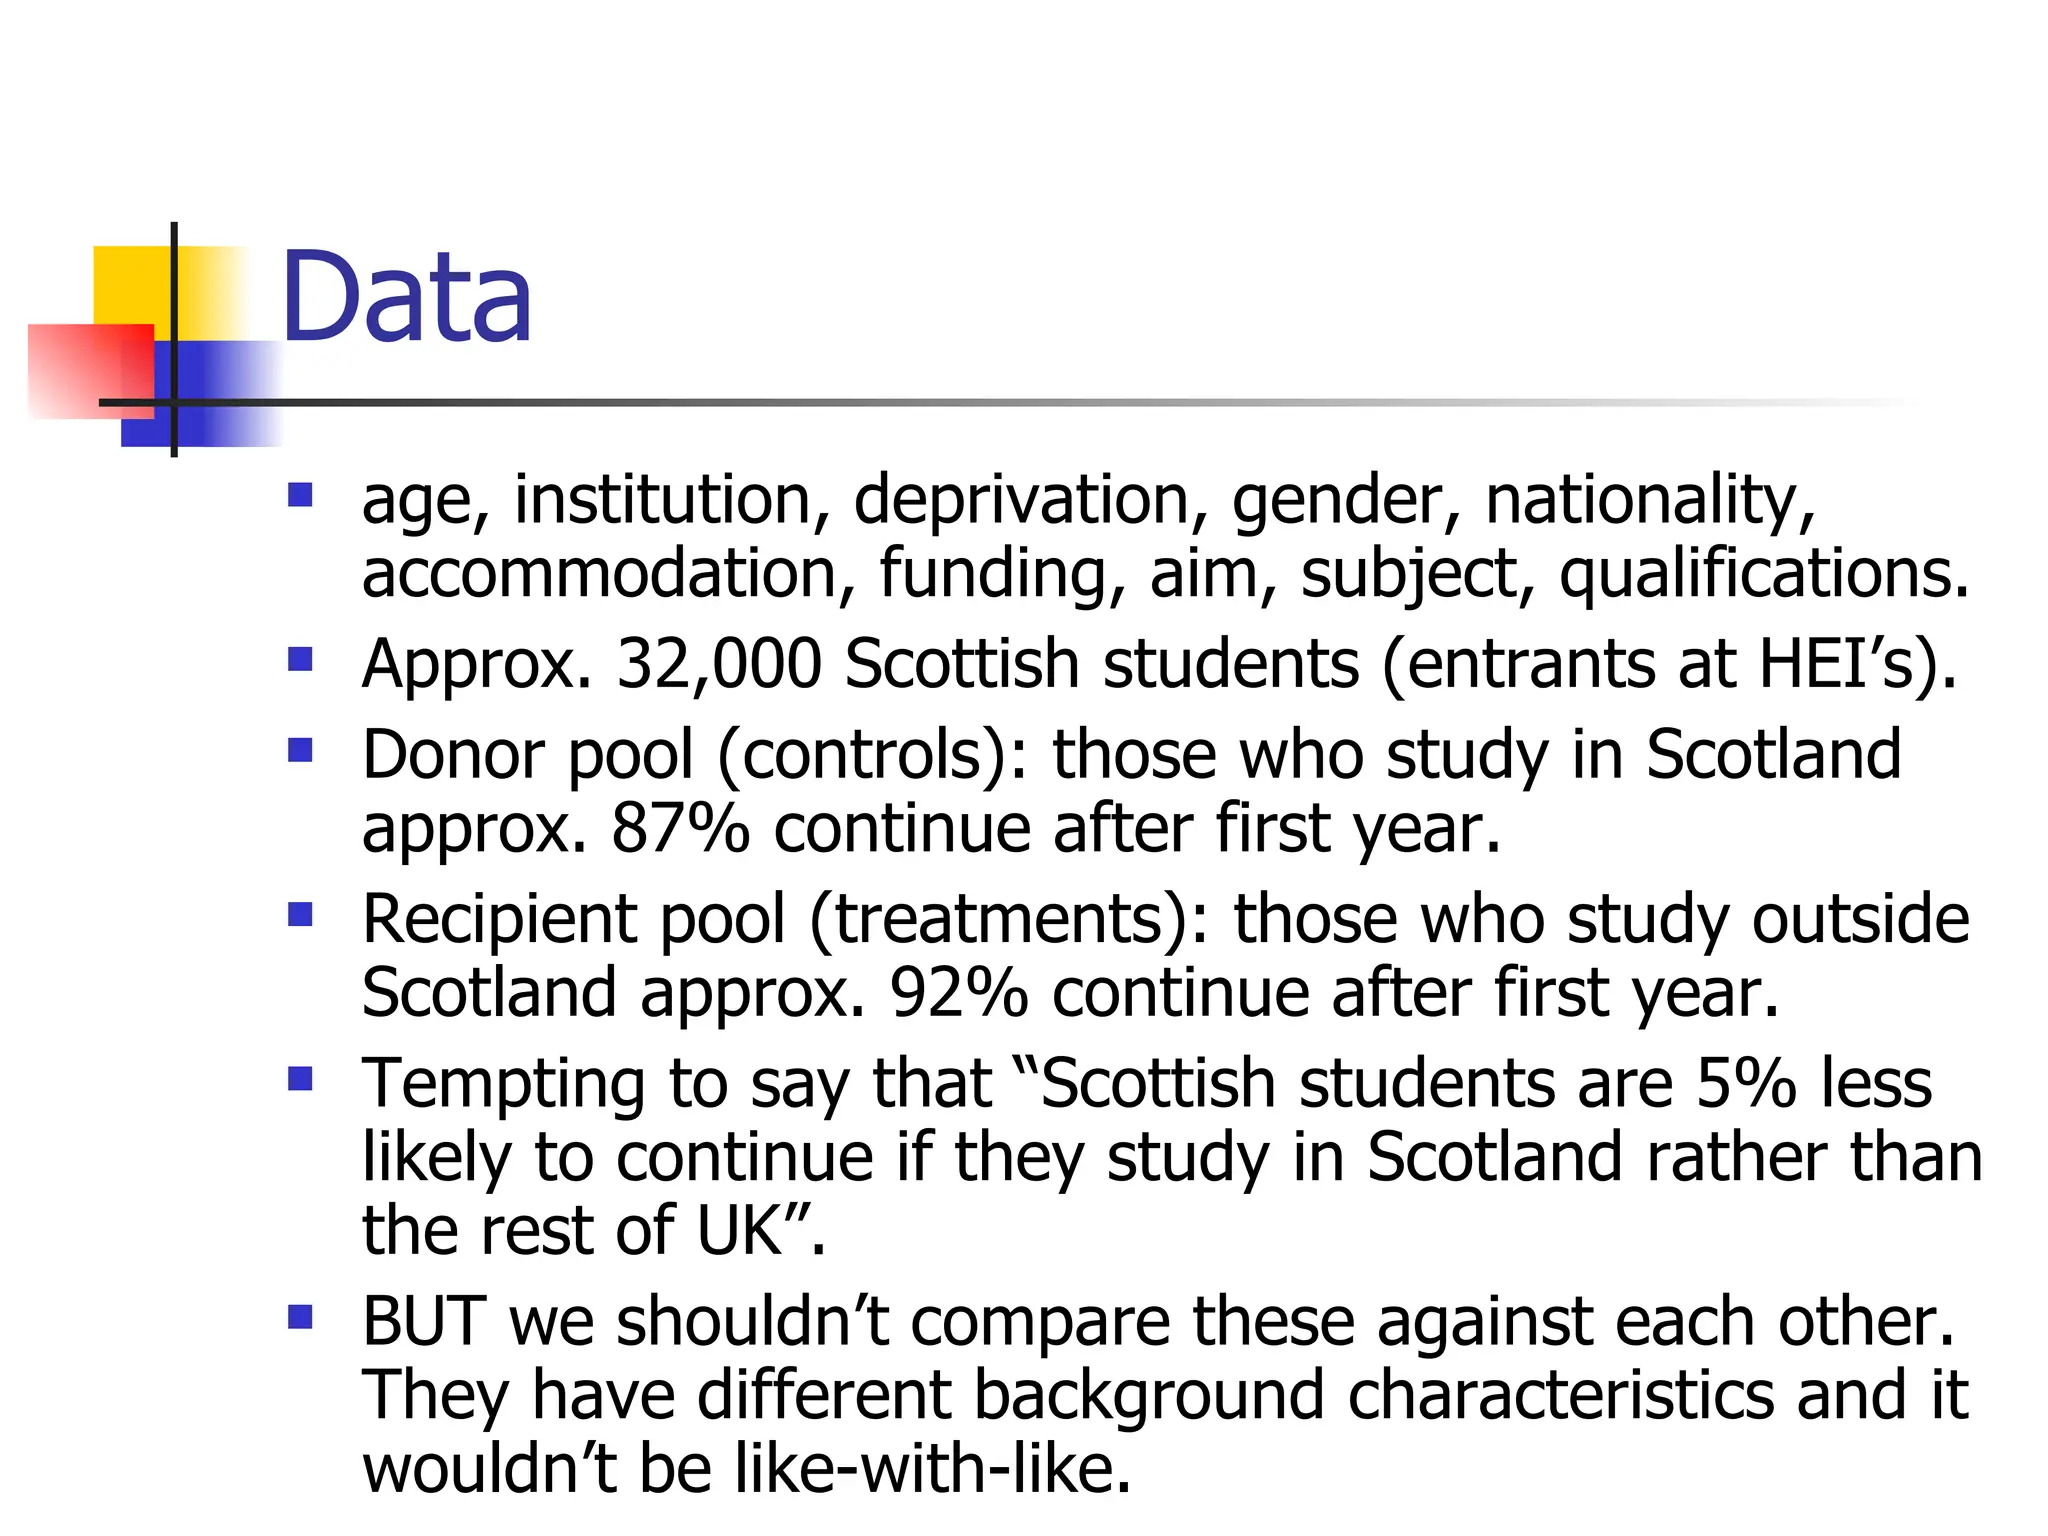
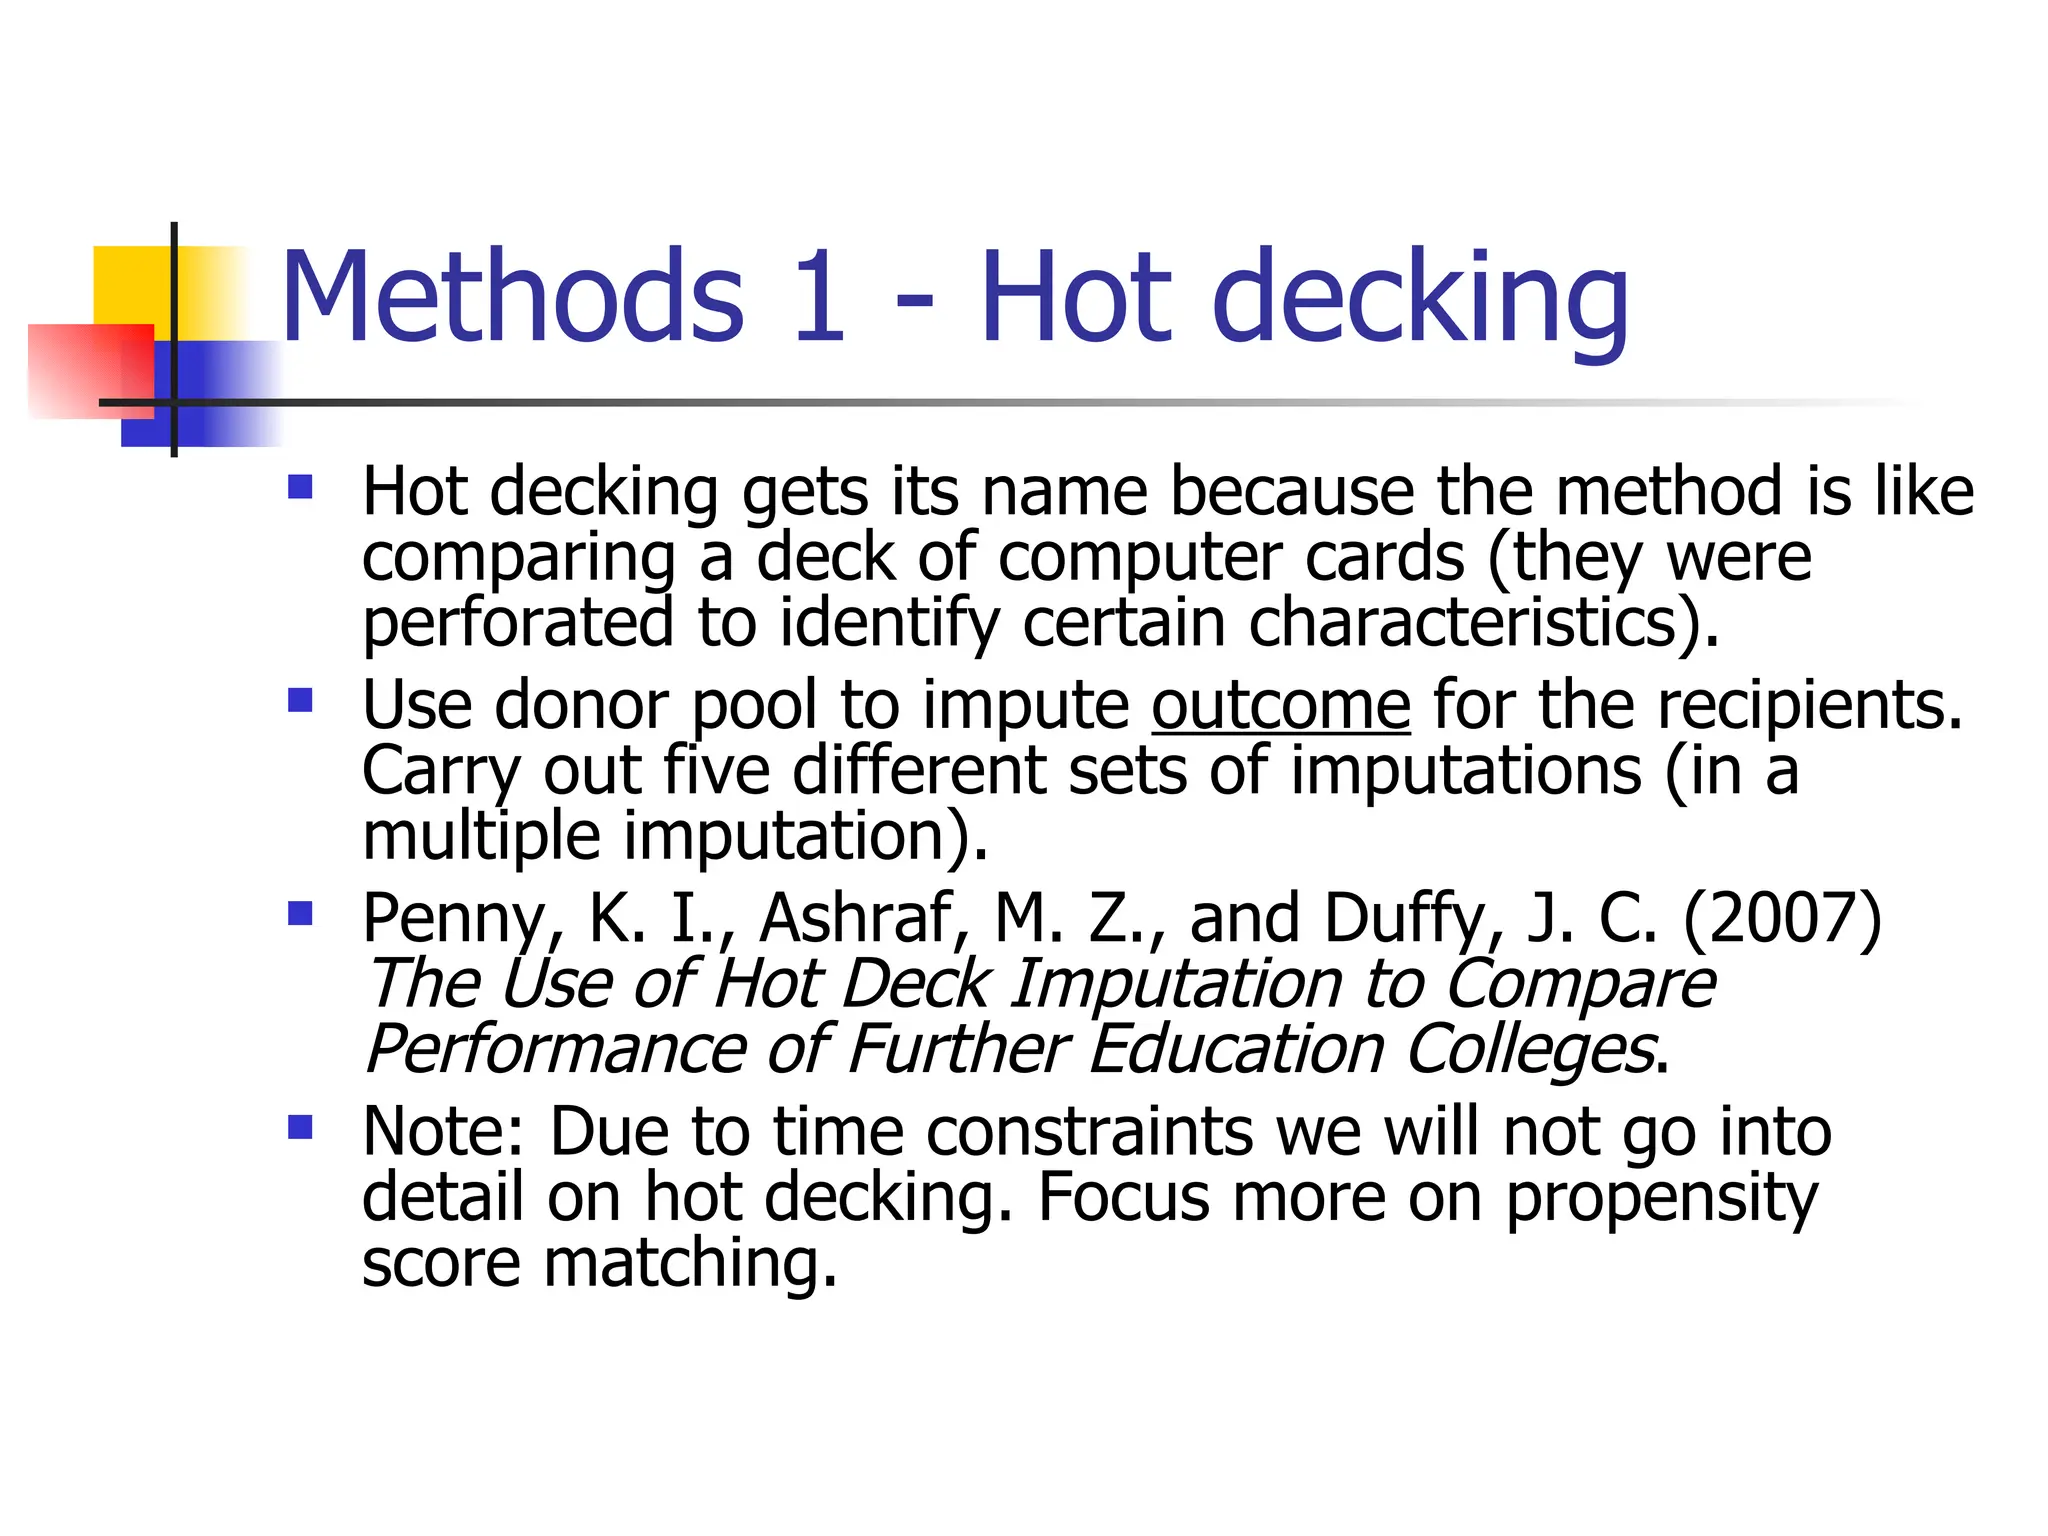
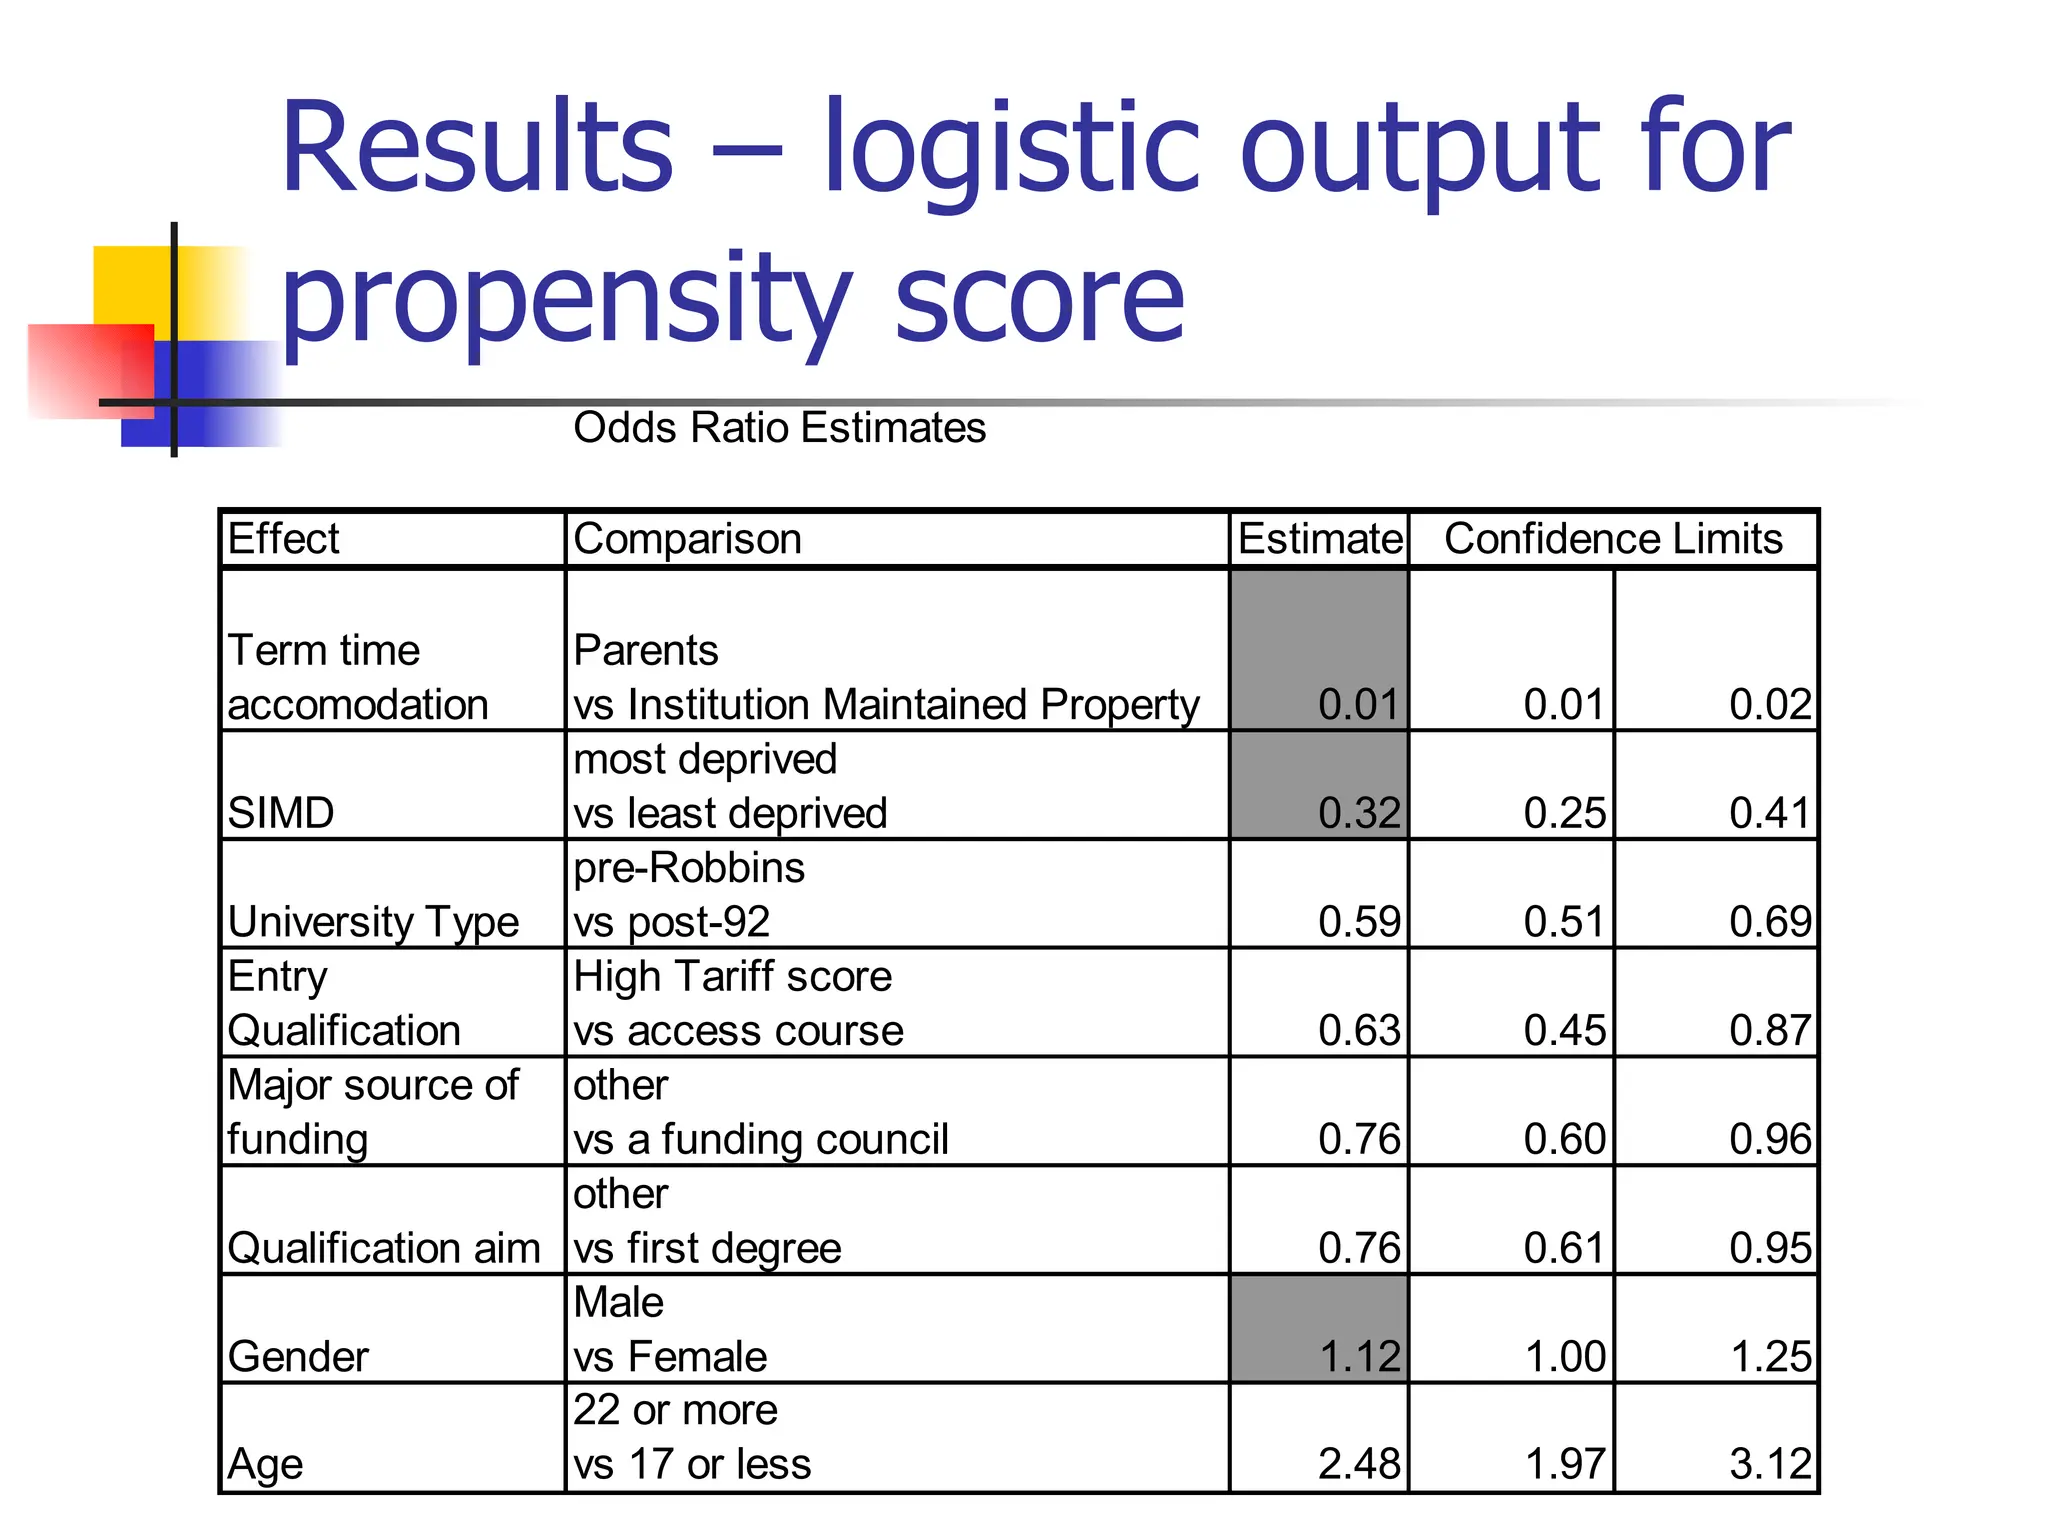
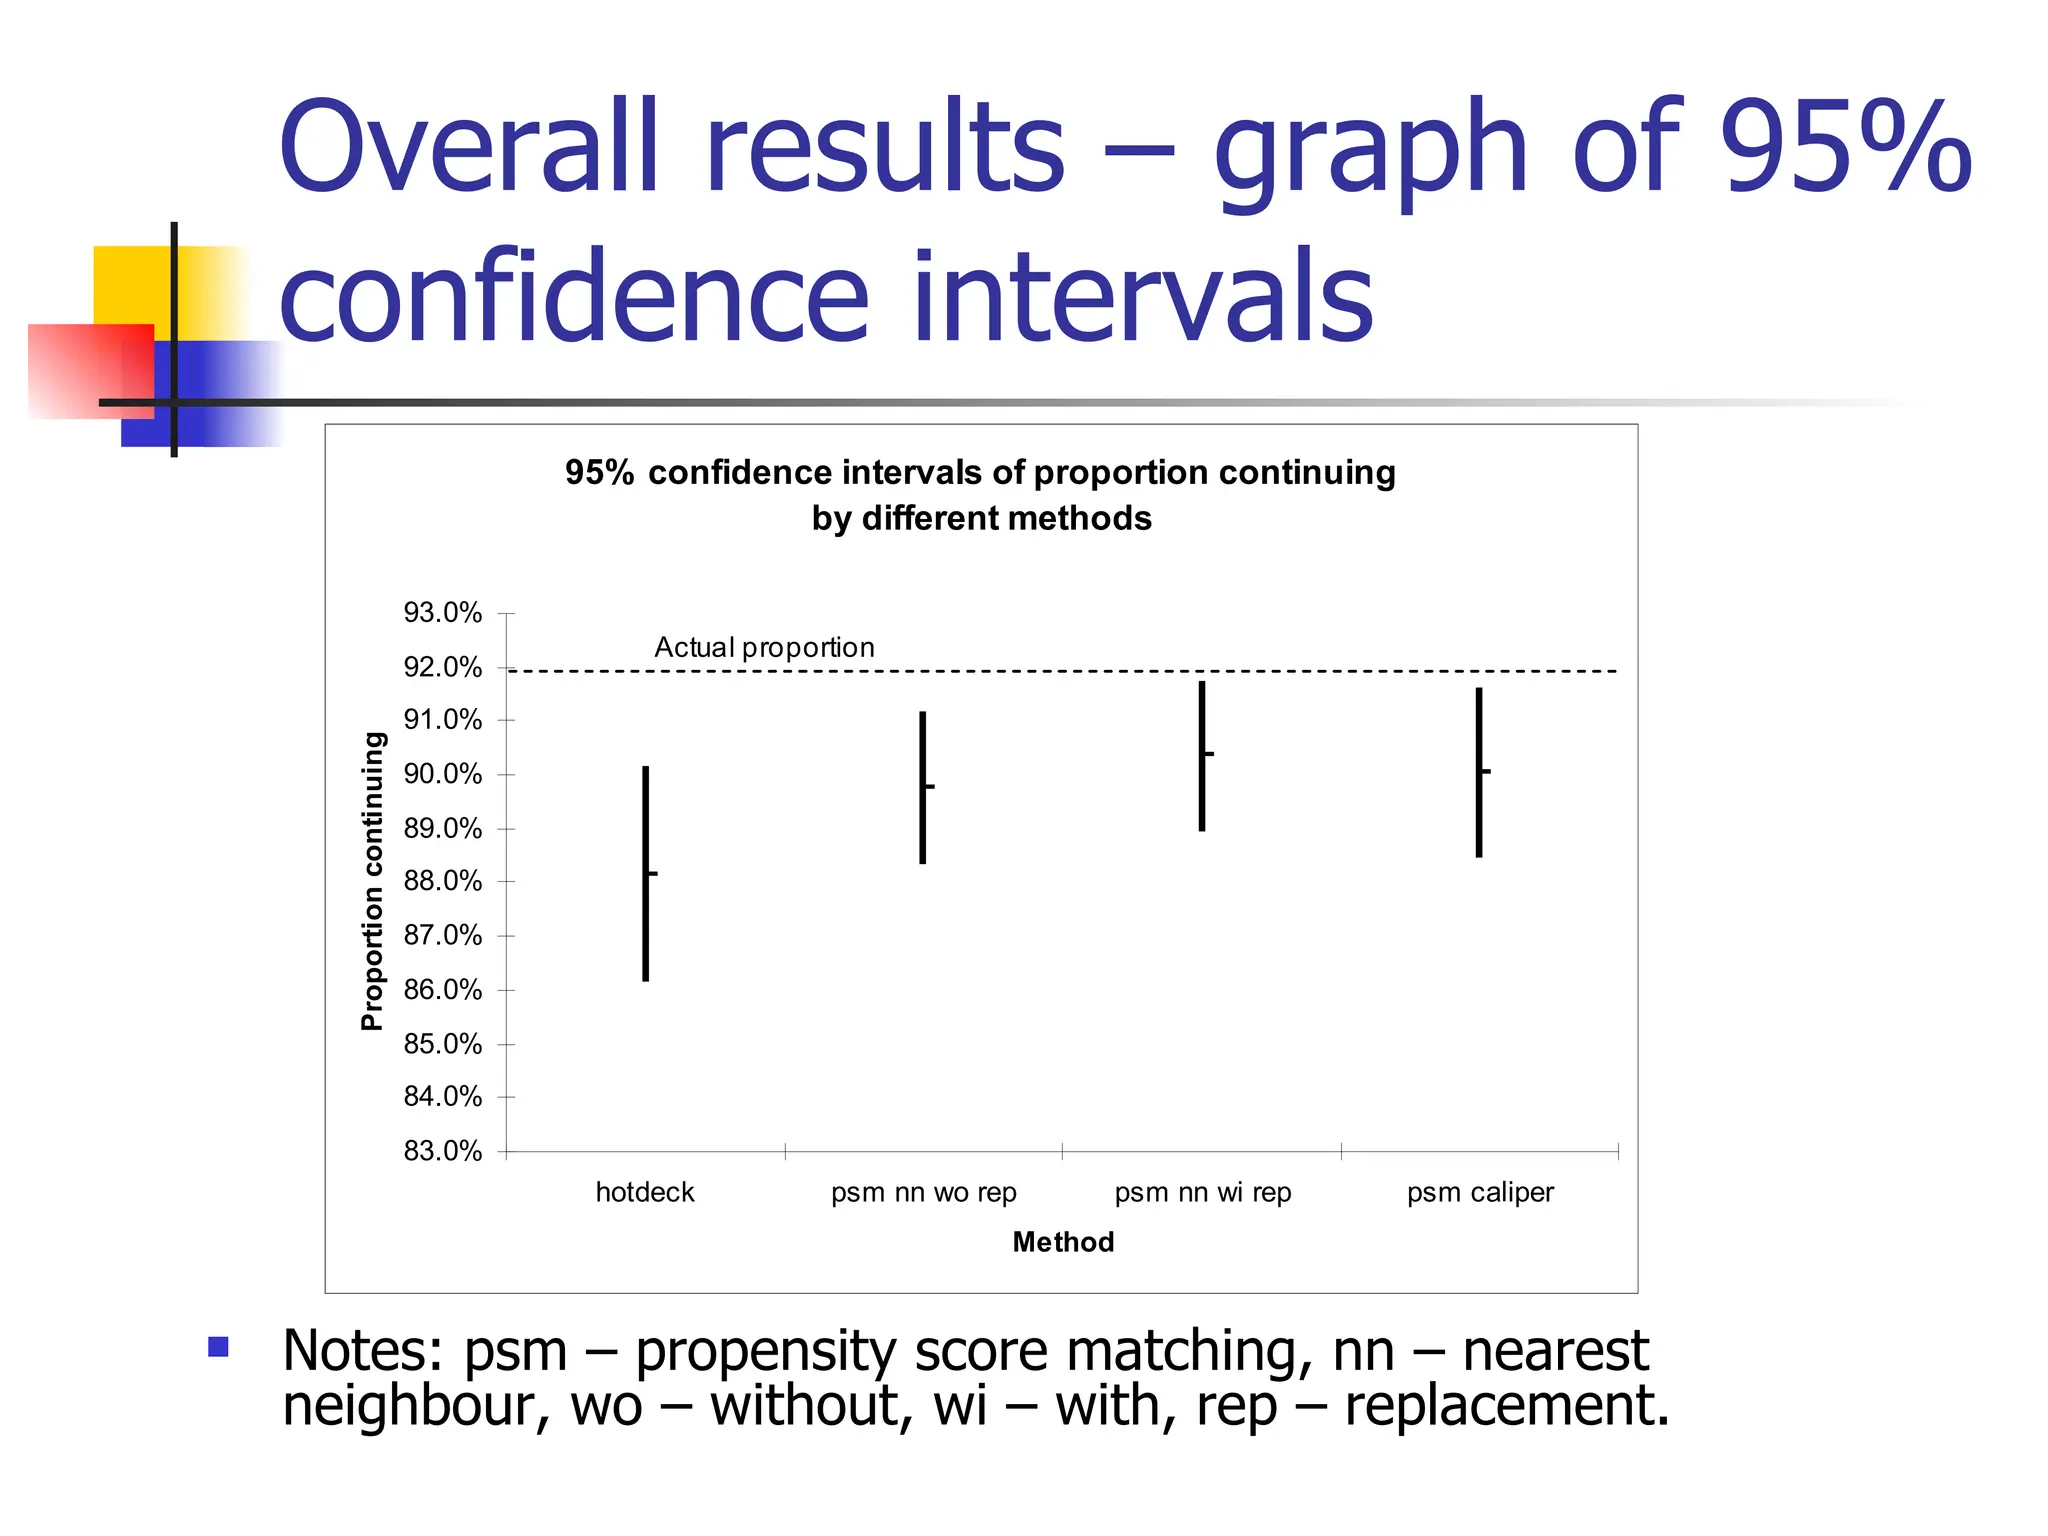
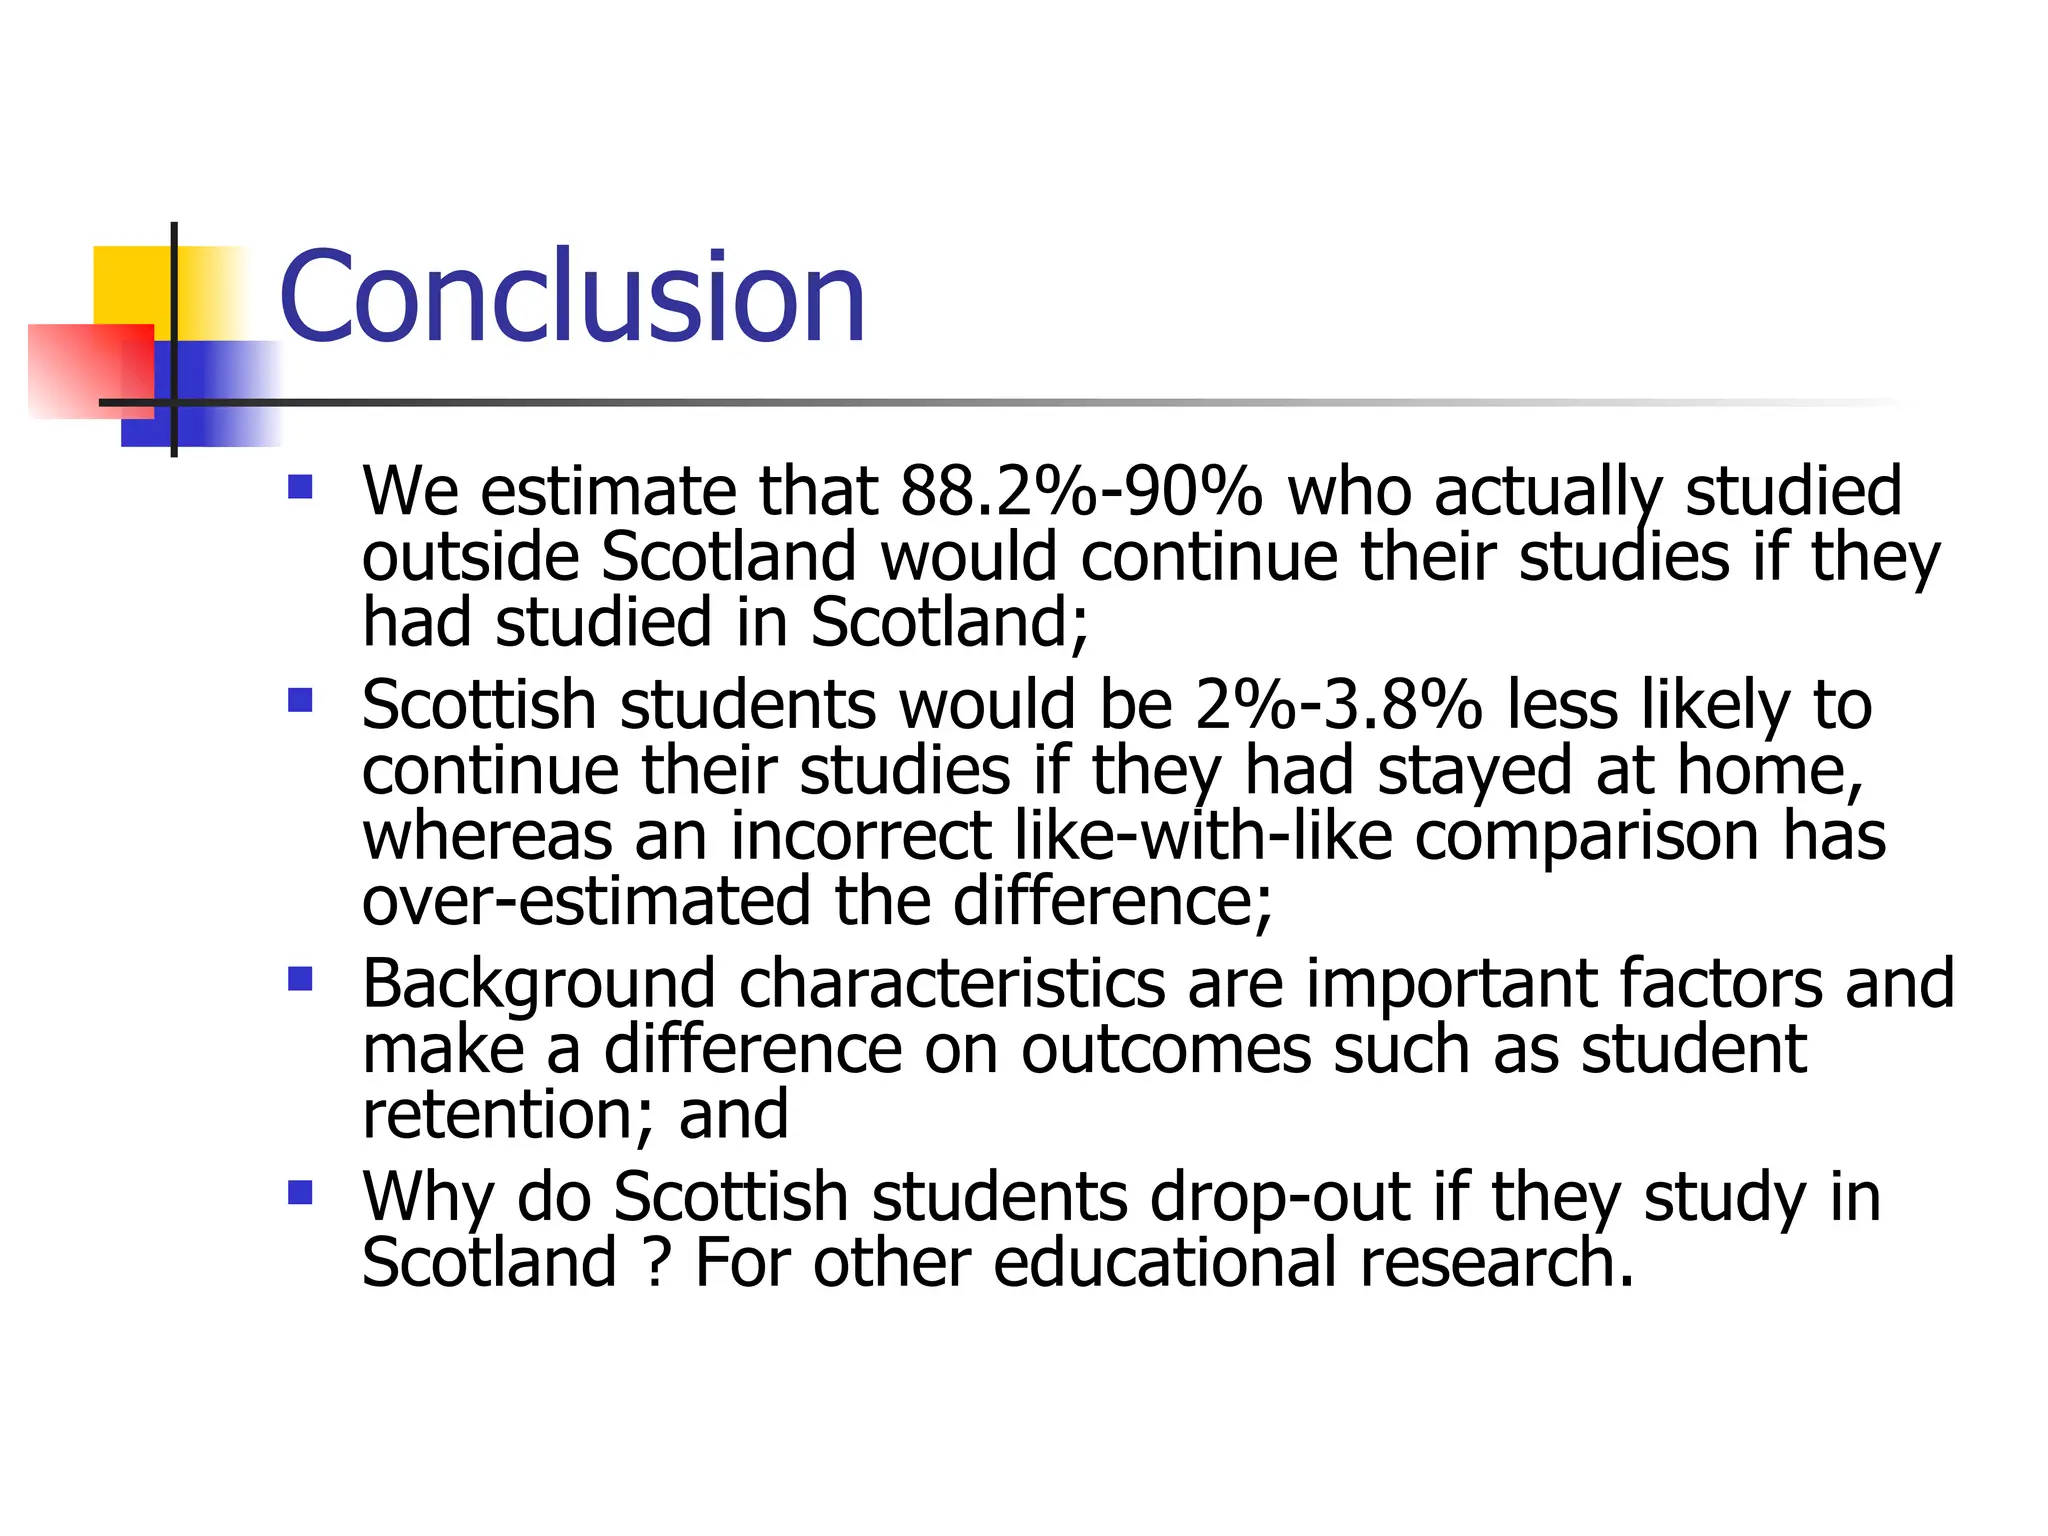
The Use of Hot Decking and Propensity Score Matching in Comparing Student Outcomes. By Ian Morton, RSS 2009 Conference, Thursday 10 th  September 2009. Joint authors: Kay Penny at Edinburgh Napier University, Zeg Ashraf & John Duffy at Scottish Funding Council.
Contents Description of the problem. How performance has been tackled in the past. Solution: Data, methods and programs; Results and conclusions; and Further work.
What is the problem ? Student retention at higher education institutions. Key point: We do not know what would have happened to those who studied outside Scotland if they had studied in Scotland – this is what we want to estimate.
How performance has been tackled in the past Example is with school and college league tables. Constructed using performance indicators. They do not properly compare like-with-like. Pupils at school w have different background characteristics to pupils at schools x, y, z etc, etc. References:  Wilson, D. and Piebalga, A. (2008)  Accurate performance measure but meaningless ranking exercise? An analysis of the English school league tables . Goldstein, H. and Leckie, G. (2009)  School league tables: what can they really tell us?  Significance 5(2).
Our solution We still want to compare like-with-like but it isn’t a league table. One set of treatments (recipients in hot decking) and one set of controls (donors in hot decking) study outside Scotland (treatment) and; study in Scotland (control). Use causal inference Rosenbaum, P. R. and Rubin, D. B. (1983)  The central role of the propensity score in observational studies for causal effects. Longford, N. T. and Rubin, D. B. (2005)  Performance assessment and league tables. Comparing like with like .
Data age, institution, deprivation, gender, nationality, accommodation, funding, aim, subject, qualifications. Approx. 32,000 Scottish students (entrants at HEI’s). Donor pool (controls): those who study in Scotland approx. 87% continue after first year. Recipient pool (treatments): those who study outside Scotland approx. 92% continue after first year. Tempting to say that “Scottish students are 5% less likely to continue if they study in Scotland rather than the rest of UK”. BUT we shouldn’t compare these against each other. They have different background characteristics and it wouldn’t be like-with-like.
Basic information 41% of the subjects are male and 59% are female; 24% are aged 17 or less, 31% are 18 years of age; 85% have an aim of obtaining a first degree; 33% live with parents, 18% stay in institution maintained properties, and 28% live in their own home; 86% are funded by a funding council, the remainder are funded by other means; and 25% are studying at a pre-Robbins institution (e.g. Cambridge), 25% at a post-Robbins (e.g. Lancaster) and 42% are at a post-92 type of institution (e.g. Edinburgh Napier).
Likelihood of continuing
Methods 1 - Hot decking Hot decking gets its name because the method is like comparing a deck of computer cards (they were perforated to identify certain characteristics). Use donor pool to impute  outcome  for the recipients. Carry out five different sets of imputations (in a multiple imputation). Penny, K. I., Ashraf, M. Z., and Duffy, J. C. (2007)  The Use of Hot Deck Imputation to Compare Performance of Further Education Colleges . Note: Due to time constraints we will not go into detail on hot decking. Focus more on propensity score matching.
Methods 2 – propensity score matching in general Rosenbaum and Rubin (1983) proposed the use of propensity scores. Aim: ensure  “balance”  between those who have received a treatment and those who haven’t (controls). Require: from those controls who  balance  with the treatments, calculate proportion continuing to study. Two steps: logistic and then matching.
Methods 2.1 – propensity score Use logistic regression to estimate probability (propensity score) of the treatment: Provides a probability (propensity score) for all students; treatment and control. The logistic equation is below, where  Ti  is the treatment status,  Xi  are the observations and  h ( Xi ) is made up of the covariates (age, institution, deprivation etc).
Methods 2.2 - matching Need to match treatments to controls by propensity score. There are different matching methods Once a match has been found for the treatments in the controls, use information on the latter's outcome for inference.
Methods 2.3 - Diagram of matching (caliper)
Results – logistic output for propensity score
Overall results – graph of 95% confidence intervals Notes: psm – propensity score matching, nn – nearest neighbour, wo – without, wi – with, rep – replacement.
Conclusion We estimate that 88.2%-90% who actually studied outside Scotland would continue their studies if they had studied in Scotland; Scottish students would be 2%-3.8% less likely to continue their studies if they had stayed at home, whereas an incorrect like-with-like comparison has over-estimated the difference; Background characteristics are important factors and make a difference on outcomes such as student retention; and Why do Scottish students drop-out if they study in Scotland ? For other educational research.
Further work Hot deck method.  How sensitive is the imputation, can the program be speeded up ? PSM method.  How sensitive is the method? What is the best method ? Hot deck or PSM ? What is the best matching algorithm ? Which students would do worse if they had stayed at home ? Application to other areas e.g. finance.
A re-cap Description of the problem. How it has been tackled in the past. How we solve it. Findings. Further work.
References 1 Morton, I.D. (2009)  The Use of Hot Decking and Propensity Score Matching in Comparing Student Outcomes  Dissertation for MSc in Applied Statistics, Napier University, July 2009. Penny, K., Morton, I.D., Ashraf, M.Z. and Duffy, J.C. (2009)  The Use Of Propensity Score Matching in Comparing Student Progression in Higher Education  To be presented at the EURISBIS’09 conference, Cagliari, Italy, May 30 – June 3, 2009.
Questions ?

The Use of Hot Decking and Propensity Score Matching in Comparing Student Outcomes

  • 1.
    The Use ofHot Decking and Propensity Score Matching in Comparing Student Outcomes. By Ian Morton, RSS 2009 Conference, Thursday 10 th September 2009. Joint authors: Kay Penny at Edinburgh Napier University, Zeg Ashraf & John Duffy at Scottish Funding Council.
  • 2.
    Contents Description ofthe problem. How performance has been tackled in the past. Solution: Data, methods and programs; Results and conclusions; and Further work.
  • 3.
    What is theproblem ? Student retention at higher education institutions. Key point: We do not know what would have happened to those who studied outside Scotland if they had studied in Scotland – this is what we want to estimate.
  • 4.
    How performance hasbeen tackled in the past Example is with school and college league tables. Constructed using performance indicators. They do not properly compare like-with-like. Pupils at school w have different background characteristics to pupils at schools x, y, z etc, etc. References: Wilson, D. and Piebalga, A. (2008) Accurate performance measure but meaningless ranking exercise? An analysis of the English school league tables . Goldstein, H. and Leckie, G. (2009) School league tables: what can they really tell us? Significance 5(2).
  • 5.
    Our solution Westill want to compare like-with-like but it isn’t a league table. One set of treatments (recipients in hot decking) and one set of controls (donors in hot decking) study outside Scotland (treatment) and; study in Scotland (control). Use causal inference Rosenbaum, P. R. and Rubin, D. B. (1983) The central role of the propensity score in observational studies for causal effects. Longford, N. T. and Rubin, D. B. (2005) Performance assessment and league tables. Comparing like with like .
  • 6.
    Data age, institution,deprivation, gender, nationality, accommodation, funding, aim, subject, qualifications. Approx. 32,000 Scottish students (entrants at HEI’s). Donor pool (controls): those who study in Scotland approx. 87% continue after first year. Recipient pool (treatments): those who study outside Scotland approx. 92% continue after first year. Tempting to say that “Scottish students are 5% less likely to continue if they study in Scotland rather than the rest of UK”. BUT we shouldn’t compare these against each other. They have different background characteristics and it wouldn’t be like-with-like.
  • 7.
    Basic information 41%of the subjects are male and 59% are female; 24% are aged 17 or less, 31% are 18 years of age; 85% have an aim of obtaining a first degree; 33% live with parents, 18% stay in institution maintained properties, and 28% live in their own home; 86% are funded by a funding council, the remainder are funded by other means; and 25% are studying at a pre-Robbins institution (e.g. Cambridge), 25% at a post-Robbins (e.g. Lancaster) and 42% are at a post-92 type of institution (e.g. Edinburgh Napier).
  • 8.
  • 9.
    Methods 1 -Hot decking Hot decking gets its name because the method is like comparing a deck of computer cards (they were perforated to identify certain characteristics). Use donor pool to impute outcome for the recipients. Carry out five different sets of imputations (in a multiple imputation). Penny, K. I., Ashraf, M. Z., and Duffy, J. C. (2007) The Use of Hot Deck Imputation to Compare Performance of Further Education Colleges . Note: Due to time constraints we will not go into detail on hot decking. Focus more on propensity score matching.
  • 10.
    Methods 2 –propensity score matching in general Rosenbaum and Rubin (1983) proposed the use of propensity scores. Aim: ensure “balance” between those who have received a treatment and those who haven’t (controls). Require: from those controls who balance with the treatments, calculate proportion continuing to study. Two steps: logistic and then matching.
  • 11.
    Methods 2.1 –propensity score Use logistic regression to estimate probability (propensity score) of the treatment: Provides a probability (propensity score) for all students; treatment and control. The logistic equation is below, where Ti is the treatment status, Xi are the observations and h ( Xi ) is made up of the covariates (age, institution, deprivation etc).
  • 12.
    Methods 2.2 -matching Need to match treatments to controls by propensity score. There are different matching methods Once a match has been found for the treatments in the controls, use information on the latter's outcome for inference.
  • 13.
    Methods 2.3 -Diagram of matching (caliper)
  • 14.
    Results – logisticoutput for propensity score
  • 15.
    Overall results –graph of 95% confidence intervals Notes: psm – propensity score matching, nn – nearest neighbour, wo – without, wi – with, rep – replacement.
  • 16.
    Conclusion We estimatethat 88.2%-90% who actually studied outside Scotland would continue their studies if they had studied in Scotland; Scottish students would be 2%-3.8% less likely to continue their studies if they had stayed at home, whereas an incorrect like-with-like comparison has over-estimated the difference; Background characteristics are important factors and make a difference on outcomes such as student retention; and Why do Scottish students drop-out if they study in Scotland ? For other educational research.
  • 17.
    Further work Hotdeck method. How sensitive is the imputation, can the program be speeded up ? PSM method. How sensitive is the method? What is the best method ? Hot deck or PSM ? What is the best matching algorithm ? Which students would do worse if they had stayed at home ? Application to other areas e.g. finance.
  • 18.
    A re-cap Descriptionof the problem. How it has been tackled in the past. How we solve it. Findings. Further work.
  • 19.
    References 1 Morton,I.D. (2009) The Use of Hot Decking and Propensity Score Matching in Comparing Student Outcomes Dissertation for MSc in Applied Statistics, Napier University, July 2009. Penny, K., Morton, I.D., Ashraf, M.Z. and Duffy, J.C. (2009) The Use Of Propensity Score Matching in Comparing Student Progression in Higher Education To be presented at the EURISBIS’09 conference, Cagliari, Italy, May 30 – June 3, 2009.
  • 20.