Effortless Driving Experience Premier Mercedes Sprinter Suspension Service
A New Approach to Driver Education
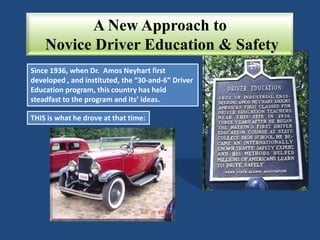
1. Since 1936, when Dr. Amos Neyhart first
developed , and instituted, the “30-and-6” Driver
Education program, this country has held
steadfast to the program and its’ ideas.
A New Approach to
Novice Driver Education & Safety
THIS is what he drove at that time:
2. A New Approach to
Novice Driver Education & Safety
Activists and scare tacticians like to use “Fatality Rate /100,000 Population”
which is HIGHLY inaccurate. Since we are talking about DRIVERS, we
should, instead, look at “ Fatality Rate/100 Million Miles Traveled” or “VMT”.
year deaths
vehicle miles
traveled
(v.m.t.)(billions)
fatalities per 100
million v.m.t.
population
fatalities per
100,000 population
%change
1936 36,126 252.13 14.33 128,053,180 28.212 4.07%
In 1936, this is what traffic fatalities looked like:
REALISTIC
NOT REALISTIC
3. A New Approach to
Novice Driver Education & Safety
Did things change much in the next few decades?
1956 37,965 627.84 6.05 168,903,031 22.477 1.66%
1966 50,894 925.90 5.50 196,560,338 25.892 6.84%
1976 45,523 1,402.38 3.25 218,035,164 20.879 1.27%
year deaths
vehicle miles
traveled
(v.m.t.)(billions)
fatalities per 100
million v.m.t.
population
fatalities per
100,000 population
%change
1936 36,126 252.13 14.33 128,053,180 28.212 4.07%
1946 31,874 340.88 9.35 141,388,566 22.544 17.77%
1986 46,087 1,834.87 2.51 240,132,887 19.192 4.19%
1996 42,065 2,486 1.69 265,228,572 15.8599 -0.33%
2006 42,708 3,014 1.42 299,398,484 14.31 -2.79%
2011 32,367 2,930 1.10 311,591,917 10.3876 -2.5%
Keep in mind that these numbers reflect ALL
vehicle occupants , pedestrians, cyclists, etc.,
NOT just drivers.
4. A New Approach to
Novice Driver Education & Safety
VMT POPULATIONIn roughly 75 years, from 1936 – 2011:
RAW NUMBERS
FATALITY RATE
INCREASED by
116.2%
INCREASED by
24.3%
DECREASED by
92.3%
DECREASED by
37%
QUOTED BY
MEDIA &
“EXPERTS”.
IGNORED BY
MEDIA &
“EXPERTS”.
5. A New Approach to
Novice Driver Education & Safety
As interesting, or confusing, these statistics may or may
not be, ONE thing is common to them all:
NONE of them reveal the HUMAN and ECONOMIC costs to this
country, which is staggering, and which NEEDS to be taught to our
novice drivers as a VERY REAL , and GROWING parasite, affecting each
and every one of us.
We have successfully decreased deaths due to SMOKING in
this country. HOW? We didn’t use semi-useless information like the
previous charts; we educated the people on the HEALTH risks, at the
same time as SMOKING became more expensive.
THAT is the approach we need to help stem the tide of Traffic
Fatalities and Injuries.
Don’t take MY word for it, see what others are saying on the next
slide:
6. A New Approach to
Novice Driver Education & Safety
The World Health Center has named Road Safety a Worldwide Public
Health Issue
CDC calls traffic fatalities and injuries a serious public health
problem
CDC data shows more than $70 BILLION in direct medical/work loss
costs
Death and injury from traffic crashes continue to be among the most
serious public health problems facing our country.
And while the number of US traffic fatalities has declined in recent
years, traffic safety remains a major health issue both in US and
around the world.
7. A New Approach to
Novice Driver Education & Safety
More than 2.3 million ADULT drivers and passengers were treated in emergency
departments as the result of being injured in motor vehicle crashes in 2009 [1]
The lifetime costs of crash-related deaths and injuries among drivers and
passengers were $70 billion in 2005 [1]
That includes $3.6 billion annually toward injuries to children. [2]
On average, each licensed driver in the United States pays about $500 a year
toward the total costs. [2]
Every hour, nearly 150 children between ages 0 and 19 are treated in emergency
departments for injuries sustained in motor vehicle crashes. [3]
8. A New Approach to
Novice Driver Education & Safety
REFERENCES
1. CDC Report: Injury Prevention & Control: Motor Vehicle Safety
2. CNN Report: CDC: Motor vehicle crashes cost the US $100 billion a year
3. CDC Report: Road Traffic Injuries: The Reality
END OF PART 1 – PART 2 coming soon!
Editor's Notes
Traditional Driver Education, in the USA, grew from Dr. Neyhart’s program of 30 hours of classroom knowledge and 6 hours of practical experience driving a vehicle. When he started this training program, he personally added a secondary set of controls to his own car. Most state DMV and Education Departments STILL use this 30/6 program, but updated to account for advances in road and vehicle technology. THAT fact begs a question: if Dr. Neyhart assumed 30 hours was enough to learn the 1936-era world of transportation, what has been changed/altered/removed from it to accommodate TODAY’s massive changes?......or has it?
If I am curious as to how many fatalities occurred because of sky-diving, for example, do I look for a representative fatality rate, based on the population of the USA, or do I look at the fatality rate based on how many sky-divers made a jump in any particular year? Each year, 35 people in the USA die (fatalities) sky-diving, with over 2 million jumps (VMT or more accurately, JMA-Jumps Made Annually) made annually.This corresponds to a Fatality Rate JMA of 0.00175% and with a population of 312 million, the FR/100,000 Population becomes 1.1%Which “stat” makes it sound more deadly?
Study THIS slide carefully. What OTHER non-reported events have happened to create these numbers?For Example: 1956 - Eisenhower signed into law the Federal-Aid Highway Act of 1956 and the Highway Revenue Act of 1956, authorizing the National System of Interstate and Defense Highways, and creating the Federal Highway Trust Fund. (VMT DOUBLED in the next 20 years, Fatality rate HALVED!)1968 - The U.S. National Highway Safety Bureau first required automobile manufacturers to install lap belts for all seats and shoulder belts for front seats. Between 1966 and 1976, VMT rates dropped by 40%, and FATALITIES/POP dropped by 20% 1970 - NHTSA was officially established in 1970 by the Highway Safety Act of 1970 - ALL rates began a steady drop
VMT INCREASED by 116.2% (1.55% per year)REDUCED the Fatality rate/VMT from 14.33 to 1.10 (92.3%) (about 1.2% per year) POPULATION increased by 24.3% (0.32% per year)REDUCED the Fatality rate/population from 28.212 to 10.39 (37%)(about .5% per year)