Submit Search
Upload
Clive Palmer
•
0 likes
•
210 views
LJ Gilland Real Estate Pty Ltd
Follow
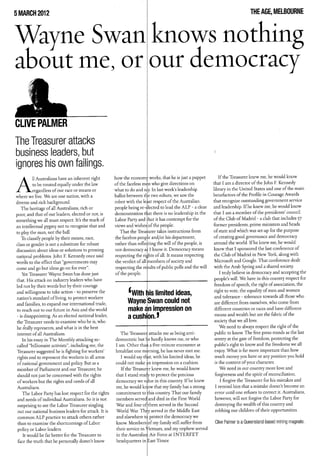
Article received in the post today from Clive Palmer.
Read less
Read more
Report
Share
Report
Share
1 of 1
Download now
Download to read offline
Recommended
5 de febrero
5 de febrero
directioner_latina
Triptico gakami 2
Triptico gakami 2
joanna14
Código de Derecho Canónico II
Derechos y deberes de los fieles 208 223
Ernesto V. Pérez
asdd
Diagrama de flujo
Diagrama de flujo
yulexiandreina
Informe 652
Informe 652
Siemprefm Cientouno Punto Cinco
Proyecto de formación para el sector productivo ( instructora Grace Cuervo)
JeniferAlarcon
Unidad iv y v grelys
Alicia F.
Referencias bibliográficas maricela chacasaguay
Mary J. Alejandro
Trabajo practico n10
tommyalbornoz
Venta
Venta
obed_emmanuelle
Doc121
Doc121
Angelica Matuz Rivera
La Prairie Life Day Spa CT Part 2
Robyn Mileham
Benefits of outreach work
Laurel Blond
7192811
7192811
Coudy Venadero
Hoy mostrare sobre las desigualdades
Desigualdades y sus propiedades
Eduardo Pincheira
Estos son los comportamientos digitales
Comportamientos 2
Comportamientos 2
karengonzalez.morales21
Best Spy Camera
Best Spy Camera
Aliley
Fisica
Fisica
Bryann Sotto Castañeda
Logo
Logo
mariohernandezflorez
Mcc 005
Mcc 005
marlborocheer
Australia's home prices likely rose at a slightly faster pace in August (+1%) compared with July (+0.8%), based on CoreLogic's daily 5 capital city index. Brisbane (inc Gold Coast) prices are up 1.4% with Sydney and Adelaide prices both 1.1% higher. Adelaide and Perth are the only capital cities at new highs, Brisbane is still below it's high in March 2022 based on this data (which includes the Gold Coast), though on the ground in Brisbane we are seeing data points of new all time highs in our target areas.
CoreLogic-HVI-Sep-2023-FINAL.pdf
LJ Gilland Real Estate Pty Ltd
CoreLogic Research Director, Tim Lawless, noted the most substantial reduction in growth has occurred in Sydney. “After leading the upswing, the monthly pace of growth in Sydney housing values has halved from a recent high of 1.8% in May to 0.9% in July. Sydney has also seen a significant rise in the number of fresh listings added to the market, 9.9% higher than the same time last year and 18.0% above the previous five-year average. An increased flow of new listings provides more choice and may be working to reduce some of the urgency felt among prospective buyers,” he said. Brisbane and Adelaide saw the monthly pace of growth accelerate in July, leading the pace of gains across the capitals with housing values up 1.4% across both cities. Although the trend in new listings has risen in these cities, Mr Lawless said the number remains well below levels from a year ago and the previous five year average. Canberra was the only capital city to record a decline in values in July, down -0.1%, while Hobart values were unchanged. The slowdown in value growth has mostly been driven by an easing in gains across the upper quartile of the market.
CoreLogic’s national Home Value Index (HVI) rose 0.7% in July marking a fift...
LJ Gilland Real Estate Pty Ltd
Brisbane (1.4%) CoreLogic’s national Home Value Index (HVI) has recorded a third consecutive monthly rise, with the pace of growth accelerating sharply to 1.2% in May. After finding a floor in February, home values increased 0.6% and 0.5% through March and April respectively. Sydney continues to lead the recovery trend, posting a 1.8% lift in values over the month, recording the city’s highest monthly gain since September 2021. Since moving through a trough in January, home values have risen by 4.8%, or the equivalent of a $48,390 lift in the median dwelling value. Brisbane (1.4%) and Perth (1.3%) are the only other capitals to record a monthly gain of more than 1.0%, however, the rise in values was broad-based with the rate of growth accelerating across every capital city last month. CoreLogic’s Research Director, Tim Lawless, noted the positive trend is a symptom of persistently low levels of available housing supply running up against rising housing demand. “Advertised listings trended lower through May with roughly 1,800 fewer capital city homes advertised for sale relative to the end of April. Inventory levels are -15.3% lower than they were at the same time last year and -24.4% below the previous five-year average for this time of year,” he said. “With such a short supply of available housing stock, buyers are becoming more competitive and there’s an element of FOMO creeping into the market. Amid increased competition, auction clearance rates have trended higher, holding at 70% or above over the past three weeks. For private treaty sales, homes are selling faster and with less vendor discounting.” The trend in regional housing values has also picked up, with the combined regionals index rising half a percent in April, following a 0.2% and 0.1% rise in March and April. “Although regional home values are trending higher, the rate of gain hasn’t kept pace with the capitals. Over the past three months, growth in the combined capitals index was more than triple the pace of growth seen across the combined regionals at 2.8% and 0.8% respectively,” Mr Lawless said. “Although advertised housing supply remains tight across regional Australia, demand from net overseas migration is less substantial. ABS data points to around 15% of Australia’s net overseas migration being centered in the regions each year. Additionally, a slowdown in internal migration rates across the regions has helped to ease the demand side pressures on housing.” Premium housing markets in Sydney continue to lead the recovery trend. After recording a larger drop in values, Sydney’s upper quartile (the most expensive quarter) stands out with the highest rate of growth, gaining 5.6% over the past three months compared with a 2.6% rise in more affordable lower quartile values. “Buyers targeting the premium sector of the market are still buying at well below peak prices,” Mr Lawless said. “Although values across more expensive homes are rising more rapidly, ......
CoreLogic-HVI-JUN-2023-FINAL.pdf
LJ Gilland Real Estate Pty Ltd
January marked a new record for how much and how fast dwelling values have fallen in Australia. Based on the monthly index, the national HVI is down -8.9% since peaking in April last year, making this the largest and fastest decline in values since at least 1980 when CoreLogic’s records began. So far, Brisbane (-10.8%* ) and Hobart (-10.8%) have registered the largest declines on record for those cities. Sydney home values are down -13.8% and not far from surpassing the 2017-19 drop of -14.9% to set a new decline record.
CoreLogic-home-value-index-FEB-23-FINAL.pdf
LJ Gilland Real Estate Pty Ltd
The third edition of the CoreLogic Women and Property report provides an update to the state of home ownership for men and women across Australia and New Zealand as of January 2023. Best Regards, Linda 姬琳达珍 and Carlos Debello (LREA) LJ Gilland Real Estate Pty Ltd Debello LREA推荐书LJ Gilland房地产 http://ljgrealestate.com.au/testimonials/
AU_Women_and_Property_2023_Research
LJ Gilland Real Estate Pty Ltd
Via Corelogic RPData 2022 was a tumultuous year for Australia’s housing market. Following outstanding capital growth over 2021 and into early 2022, successive interest rate rises, surging inflation, low consumer sentiment and deteriorating affordability drove a shift in the performance of residential real estate. Today, we released our annual Best of the Best report; a seminal publication which sums up the country’s annual property performance and provides an outlook for the year ahead.
Best of the Best 2022 Property Report
LJ Gilland Real Estate Pty Ltd
The national monthly increase of 1.3% is the slowest rate of growth since January 2021 when values rose 0.9%. The annual increase of 22.2% has added approximately $126,700 to the median value of an Australian home in the last 12 months. Beyond the headline figure, capital city and regional home values are diversifying as stock levels rise and affordability decreases. Houses continue to outperform units, regional markets and rental growth remain strong and a rise in listings is contributing to a subtle softening in vendor metrics such as days on market and auction clearance rates. Will it be a hot, warm or cool summer for the market?
Corelogic home value index dec 1 2021 final
LJ Gilland Real Estate Pty Ltd
ACCOR VACATION CLUB #timeshare #rip-off #lifetime #exhorbitant #fees #buyer #beware #ASIC #INVESTIGATING Holiday timeshare schemes - CHOICE https://www.choice.com.au/travel/accommodation/timeshare/articles/timeshare-schemes-are-a-life-sentence
ASIC REPORT RE TIMESHARE 642 published-6-december-2019
LJ Gilland Real Estate Pty Ltd
Foreign nationals bought up more than $55.8 billion worth of Australian property during the last financial year, down 33% as the pandemic shut the country’s borders. The Foreign Investment Board’s annual report shows property approvals were down again, having almost halved in the space of just four years. The report shows Chinese investment was up 16% over the same period, while Queensland is quickly becoming a “top destination” for foreign investment.
FIRB 2019 20 ANNUAL REPORT - Queensland is quickly becoming the a choice dest...
LJ Gilland Real Estate Pty Ltd
According to a variety of reported opinions, it’s Brisbane’s time to shine. The city has seen a stop- start-stagnate property market for close to a decade, with myriad factors (floods, unit oversupply, high unemployment, global pandemic) keeping our values
Htw month-in-review-march-2021-residential
LJ Gilland Real Estate Pty Ltd
More Related Content
Viewers also liked
Trabajo practico n10
tommyalbornoz
Venta
Venta
obed_emmanuelle
Doc121
Doc121
Angelica Matuz Rivera
La Prairie Life Day Spa CT Part 2
Robyn Mileham
Benefits of outreach work
Laurel Blond
7192811
7192811
Coudy Venadero
Hoy mostrare sobre las desigualdades
Desigualdades y sus propiedades
Eduardo Pincheira
Estos son los comportamientos digitales
Comportamientos 2
Comportamientos 2
karengonzalez.morales21
Best Spy Camera
Best Spy Camera
Aliley
Fisica
Fisica
Bryann Sotto Castañeda
Logo
Logo
mariohernandezflorez
Mcc 005
Mcc 005
marlborocheer
Viewers also liked
(12)
Trabajo practico n10
Venta
Venta
Doc121
Doc121
La Prairie Life Day Spa CT Part 2
Benefits of outreach work
7192811
7192811
Desigualdades y sus propiedades
Comportamientos 2
Comportamientos 2
Best Spy Camera
Best Spy Camera
Fisica
Fisica
Logo
Logo
Mcc 005
Mcc 005
More from LJ Gilland Real Estate Pty Ltd
Australia's home prices likely rose at a slightly faster pace in August (+1%) compared with July (+0.8%), based on CoreLogic's daily 5 capital city index. Brisbane (inc Gold Coast) prices are up 1.4% with Sydney and Adelaide prices both 1.1% higher. Adelaide and Perth are the only capital cities at new highs, Brisbane is still below it's high in March 2022 based on this data (which includes the Gold Coast), though on the ground in Brisbane we are seeing data points of new all time highs in our target areas.
CoreLogic-HVI-Sep-2023-FINAL.pdf
LJ Gilland Real Estate Pty Ltd
CoreLogic Research Director, Tim Lawless, noted the most substantial reduction in growth has occurred in Sydney. “After leading the upswing, the monthly pace of growth in Sydney housing values has halved from a recent high of 1.8% in May to 0.9% in July. Sydney has also seen a significant rise in the number of fresh listings added to the market, 9.9% higher than the same time last year and 18.0% above the previous five-year average. An increased flow of new listings provides more choice and may be working to reduce some of the urgency felt among prospective buyers,” he said. Brisbane and Adelaide saw the monthly pace of growth accelerate in July, leading the pace of gains across the capitals with housing values up 1.4% across both cities. Although the trend in new listings has risen in these cities, Mr Lawless said the number remains well below levels from a year ago and the previous five year average. Canberra was the only capital city to record a decline in values in July, down -0.1%, while Hobart values were unchanged. The slowdown in value growth has mostly been driven by an easing in gains across the upper quartile of the market.
CoreLogic’s national Home Value Index (HVI) rose 0.7% in July marking a fift...
LJ Gilland Real Estate Pty Ltd
Brisbane (1.4%) CoreLogic’s national Home Value Index (HVI) has recorded a third consecutive monthly rise, with the pace of growth accelerating sharply to 1.2% in May. After finding a floor in February, home values increased 0.6% and 0.5% through March and April respectively. Sydney continues to lead the recovery trend, posting a 1.8% lift in values over the month, recording the city’s highest monthly gain since September 2021. Since moving through a trough in January, home values have risen by 4.8%, or the equivalent of a $48,390 lift in the median dwelling value. Brisbane (1.4%) and Perth (1.3%) are the only other capitals to record a monthly gain of more than 1.0%, however, the rise in values was broad-based with the rate of growth accelerating across every capital city last month. CoreLogic’s Research Director, Tim Lawless, noted the positive trend is a symptom of persistently low levels of available housing supply running up against rising housing demand. “Advertised listings trended lower through May with roughly 1,800 fewer capital city homes advertised for sale relative to the end of April. Inventory levels are -15.3% lower than they were at the same time last year and -24.4% below the previous five-year average for this time of year,” he said. “With such a short supply of available housing stock, buyers are becoming more competitive and there’s an element of FOMO creeping into the market. Amid increased competition, auction clearance rates have trended higher, holding at 70% or above over the past three weeks. For private treaty sales, homes are selling faster and with less vendor discounting.” The trend in regional housing values has also picked up, with the combined regionals index rising half a percent in April, following a 0.2% and 0.1% rise in March and April. “Although regional home values are trending higher, the rate of gain hasn’t kept pace with the capitals. Over the past three months, growth in the combined capitals index was more than triple the pace of growth seen across the combined regionals at 2.8% and 0.8% respectively,” Mr Lawless said. “Although advertised housing supply remains tight across regional Australia, demand from net overseas migration is less substantial. ABS data points to around 15% of Australia’s net overseas migration being centered in the regions each year. Additionally, a slowdown in internal migration rates across the regions has helped to ease the demand side pressures on housing.” Premium housing markets in Sydney continue to lead the recovery trend. After recording a larger drop in values, Sydney’s upper quartile (the most expensive quarter) stands out with the highest rate of growth, gaining 5.6% over the past three months compared with a 2.6% rise in more affordable lower quartile values. “Buyers targeting the premium sector of the market are still buying at well below peak prices,” Mr Lawless said. “Although values across more expensive homes are rising more rapidly, ......
CoreLogic-HVI-JUN-2023-FINAL.pdf
LJ Gilland Real Estate Pty Ltd
January marked a new record for how much and how fast dwelling values have fallen in Australia. Based on the monthly index, the national HVI is down -8.9% since peaking in April last year, making this the largest and fastest decline in values since at least 1980 when CoreLogic’s records began. So far, Brisbane (-10.8%* ) and Hobart (-10.8%) have registered the largest declines on record for those cities. Sydney home values are down -13.8% and not far from surpassing the 2017-19 drop of -14.9% to set a new decline record.
CoreLogic-home-value-index-FEB-23-FINAL.pdf
LJ Gilland Real Estate Pty Ltd
The third edition of the CoreLogic Women and Property report provides an update to the state of home ownership for men and women across Australia and New Zealand as of January 2023. Best Regards, Linda 姬琳达珍 and Carlos Debello (LREA) LJ Gilland Real Estate Pty Ltd Debello LREA推荐书LJ Gilland房地产 http://ljgrealestate.com.au/testimonials/
AU_Women_and_Property_2023_Research
LJ Gilland Real Estate Pty Ltd
Via Corelogic RPData 2022 was a tumultuous year for Australia’s housing market. Following outstanding capital growth over 2021 and into early 2022, successive interest rate rises, surging inflation, low consumer sentiment and deteriorating affordability drove a shift in the performance of residential real estate. Today, we released our annual Best of the Best report; a seminal publication which sums up the country’s annual property performance and provides an outlook for the year ahead.
Best of the Best 2022 Property Report
LJ Gilland Real Estate Pty Ltd
The national monthly increase of 1.3% is the slowest rate of growth since January 2021 when values rose 0.9%. The annual increase of 22.2% has added approximately $126,700 to the median value of an Australian home in the last 12 months. Beyond the headline figure, capital city and regional home values are diversifying as stock levels rise and affordability decreases. Houses continue to outperform units, regional markets and rental growth remain strong and a rise in listings is contributing to a subtle softening in vendor metrics such as days on market and auction clearance rates. Will it be a hot, warm or cool summer for the market?
Corelogic home value index dec 1 2021 final
LJ Gilland Real Estate Pty Ltd
ACCOR VACATION CLUB #timeshare #rip-off #lifetime #exhorbitant #fees #buyer #beware #ASIC #INVESTIGATING Holiday timeshare schemes - CHOICE https://www.choice.com.au/travel/accommodation/timeshare/articles/timeshare-schemes-are-a-life-sentence
ASIC REPORT RE TIMESHARE 642 published-6-december-2019
LJ Gilland Real Estate Pty Ltd
Foreign nationals bought up more than $55.8 billion worth of Australian property during the last financial year, down 33% as the pandemic shut the country’s borders. The Foreign Investment Board’s annual report shows property approvals were down again, having almost halved in the space of just four years. The report shows Chinese investment was up 16% over the same period, while Queensland is quickly becoming a “top destination” for foreign investment.
FIRB 2019 20 ANNUAL REPORT - Queensland is quickly becoming the a choice dest...
LJ Gilland Real Estate Pty Ltd
According to a variety of reported opinions, it’s Brisbane’s time to shine. The city has seen a stop- start-stagnate property market for close to a decade, with myriad factors (floods, unit oversupply, high unemployment, global pandemic) keeping our values
Htw month-in-review-march-2021-residential
LJ Gilland Real Estate Pty Ltd
Australian housing values finished the year 3.0% higher according to data released by @corelogicau today. The growth rate for regional housing values (+6.9%) was more than three times higher than the pace of growth across the capital cities (+2.0%)
Core logic home value index jan 2021 final
LJ Gilland Real Estate Pty Ltd
Our Sunshine State capital is looking even brighter as at the time of writing. While we’ve had our challenges during COVID-19 (particularly in recent weeks when a few dubious border crossings have left our population holding its collective breath……………
Htw month-in-review-september-2020-residential
LJ Gilland Real Estate Pty Ltd
“The blowout in rental vacancy rates for the major CBDs suggests a mass exodus of tenants occurred over the course of March and April. This might be attributed to the significant loss in employment in our CBDs plus the drop off in international students,” he said. Brisbane and Adelaide both saw their CBD vacancy rate double as well, albeit from smaller bases, jumping to 11.3% and 6.6% apiece. Looking at the capital city markets as a whole, Darwin proved the only exception to rising rates across the board.
12 05 20 national vacancy rate increase in apr 2020_media release
LJ Gilland Real Estate Pty Ltd
CoreLogic head of research Tim Lawless said, “Although housing values were generally slightly positive over the month, the trend has clearly weakened since mid-to-late March, when social distancing policies were implemented and consumer sentiment started to plummet.” The capital city markets generally showed a weaker performance relative to the regional markets, with the combined capital cities index up 0.2% in April compared with a 0.5% rise across the combined regional markets.
Core logic home value index may 2020 final
LJ Gilland Real Estate Pty Ltd
View the COVID-19 V Australian Property Report here. At a Glance: Even with the impact of COVID-19, the experts most commonly believe in 12 months prices will be higher than they are now (27 percent of respondents). Overwhelmingly, (72 percent) of respondents, felt that NSW would be the hardest hit. Short Term residential rental properties, like AIRBNB and holiday homes, are in the firing line, whilst high cashflow and diversified rooming houses on fixed-term leases are highlighted as the most resilient. Respondents said the peak COVID-19 impact would be felt between the 3 to 12-month mark from mid-March 2020
Covid 19_vs_property_2020
LJ Gilland Real Estate Pty Ltd
Valuing experts explore what buyers are looking for in each housing market. This is especially useful knowledge as the market establishes its direction for 2020.
htw-month-in-review-march-2020-residential
LJ Gilland Real Estate Pty Ltd
Corelogic January 2020 Home Value Index: Housing Values Rose Across Every Capital City In January Despite Slower Growth.
Core logic home value index feb 2020 final 0
LJ Gilland Real Estate Pty Ltd
Dwelling values rose by 1.1% over the month of December and by 4.0% over the quarter to finish out 2019 on a positive note according to the CoreLogic national home value index. This result represents the fastest rate of national dwelling value growth over any three month period since November 2009. Darwin was the only region amongst the capital cities and ‘rest-of-state’ areas to record a fall in values over the month, with a -0.5% decline
Core logic home value index jan 2020 final
LJ Gilland Real Estate Pty Ltd
Some of the recent Brisbane sales will be of real interest for readers who are interested in home values
htw-month-in-review-november-2019 v2-residential
LJ Gilland Real Estate Pty Ltd
The CoreLogic Home Value Index results for October out today confirm a 1.2% rise in national dwelling values over the month, delivering the fourth straight month of rising values. The October result was the largest month-on-month gain in the national index since May 2015. The recent gains come after a broad-based decline in housing values, with the national index declining 8.4% between October 2017 and June 2019. The positive October result takes national dwelling values 2.9% off their June 2019 floor, however values remain 5.7% below their peak, highlighting that despite the recent gains, home values are at a similar level to where they were three years ago. According to CoreLogic research director Tim Lawless, the stronger rebound in Melbourne and Sydney can be attributed to a blend of factors; tighter labour market conditions and stronger population growth relative to the other capitals, coupled with the stimulatory effect of the lowest mortgage rates since the 1950’s, and improved access to credit.
Core logic home value index Nov 19 final
LJ Gilland Real Estate Pty Ltd
More from LJ Gilland Real Estate Pty Ltd
(20)
CoreLogic-HVI-Sep-2023-FINAL.pdf
CoreLogic’s national Home Value Index (HVI) rose 0.7% in July marking a fift...
CoreLogic-HVI-JUN-2023-FINAL.pdf
CoreLogic-home-value-index-FEB-23-FINAL.pdf
AU_Women_and_Property_2023_Research
Best of the Best 2022 Property Report
Corelogic home value index dec 1 2021 final
ASIC REPORT RE TIMESHARE 642 published-6-december-2019
FIRB 2019 20 ANNUAL REPORT - Queensland is quickly becoming the a choice dest...
Htw month-in-review-march-2021-residential
Core logic home value index jan 2021 final
Htw month-in-review-september-2020-residential
12 05 20 national vacancy rate increase in apr 2020_media release
Core logic home value index may 2020 final
Covid 19_vs_property_2020
htw-month-in-review-march-2020-residential
Core logic home value index feb 2020 final 0
Core logic home value index jan 2020 final
htw-month-in-review-november-2019 v2-residential
Core logic home value index Nov 19 final
Download now