Ferrovial Executive Summary Jan Sep 2014
•
1 like•540 views

Financial results Jan Sep 2014 main figures

Recommended
Recommended
More Related Content
What's hot
What's hot (20)
Similar to Ferrovial Executive Summary Jan Sep 2014
Similar to Ferrovial Executive Summary Jan Sep 2014 (20)
More from Ferrovial
More from Ferrovial (15)
Recently uploaded
Recently uploaded (20)
Ferrovial Executive Summary Jan Sep 2014
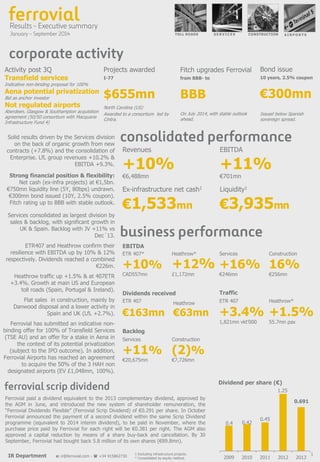
- 1. Heathrow* +1.5% 55.7mn pax Projects awarded I-77 $655mn North Carolina (US) Awarded to a consortium led by Cintra. IR Department e: ir@ferrovial.com - +34 915862730 1 AIRPORTS CONSTRUCTION SERVICES TOLL ROADS Dividends received ETR 407 €163mn Heathrow €63mn Backlog ETR 407* +10% CAD557mn Services +16% €246mn Heathrow* +12% £1,172mn Construction 16% €256mn EBITDA Revenues +10% €6,488mn EBITDA +11% €701mn Ex-infrastructure net cash1 €1,533mn Services consolidated as largest division by sales & backlog, with significant growth in UK & Spain. Backlog with JV +11% vs Dec´13. ETR407 and Heathrow confirm their resilience with EBITDA up by 10% & 12% respectively. Dividends reached a combined €226m. Heathrow traffic up +1.5% & at 407ETR +3.4%. Growth at main US and European toll roads (Spain, Portugal & Ireland). Flat sales in construction, mainly by Danwood disposal and a lower activity in Spain and UK (LfL +2.7%). Ferrovial has submitted an indicative non- binding offer for 100% of Transfield Services (TSE AU) and an offer for a stake in Aena in the context of its potential privatization (subject to the IPO outcome). In addition, Ferrovial Airports has reached an agreement to acquire the 50% of the 3 HAH non designated airports (EV £1,048mn, 100%). Solid results driven by the Services division on the back of organic growth from new contracts (+7.8%) and the consolidation of Enterprise. LfL group revenues +10.2% & EBITDA +9.3%. Strong financial position & flexibility: Net cash (ex-infra projects) at €1,5bn. €750mn liquidity line (5Y, 80bps) undrawn. €300mn bond issued (10Y, 2.5% coupon). Fitch rating up to BBB with stable outlook. Liquidity1 €3,935mn Traffic ETR 407 +3.4% 1,821mn vkt’000 1 Excluding infrastructure projects. * Consolidated by equity method. Services +11% €20,675mn Construction (2)% €7,726mn Fitch upgrades Ferrovial from BBB- to BBB On July 2014, with stable outlook ahead. Bond issue 10 years, 2.5% coupon €300mn Issued below Spanish sovereign spread. Ferrovial paid a dividend equivalent to the 2013 complementary dividend, approved by the AGM in June, and introduced the new system of shareholder remuneration, the “Ferrovial Dividendo Flexible” (Ferrovial Scrip Dividend) of €0.291 per share. In October Ferrovial announced the payment of a second dividend within the same Scrip Dividend programme (equivalent to 2014 interim dividend), to be paid in November, where the purchase price paid by Ferrovial for each right will be €0.381 per right. The AGM also approved a capital reduction by means of a share buy-back and cancellation. By 30 September, Ferrovial had bought back 5.8 million of its own shares (€89.8mn). 2009 2010 2011 2012 2013 1.25 0.45 0.42 0.4 0.691 Dividend per share (€) Activity post 3Q Transfield services Indicative non-binding proposal for 100% Aena potential privatization Bid as anchor investor Not regulated airports Aberdeen, Glasgow & Southampton acquisition agreement (50/50 consortium with Macquarie Infrastructure Fund 4)
- 2. Sales are up on the back of both +7.8% organic growth (+11.3% Spain, +5.3% UK, +30.3% Int’l) and of higher Enterprise contribution (9 months vs 6 in 2013). EBITDA margin continues to improve (7.7% in 3Q & 6.7% in 1Q) supported by contracts initiated this year & higher synergies in UK. Backlog including JV up +11% (€20,675mn) vs Dec’13. Revenues +22.2% 3.202mn Spain: Sales up from start of contracts won in 2013. EBITDA -4.0% on provisions for overdue accounts released in ‘13 (€8mn) & increase in social security contributions given legislation changes (€5mn), excluding this impacts the EBITDA growth would be +5%. EBITDA +16.5% 246mn/7.7% UK: Revenue & EBITDA growth driven by strong organic growth & 9 months contribution of Enterprise vs 6 months in 2013. Integration costs (€13mn in 9M14 vs €17mn in 13) expected to reach GBP17mn in 2014, with no significant costs anticipated for 2015. Excluding integration costs & FX, Revenue and EBITDA growth would be +22.9% and +31.5%. The backlog including JV reached to €13,641mn. Backlog +11.0% 20,675mn International: This division includes Chile (35mn), Portugal (19mn) and Poland (6mn). Positive 9M traffic in all key assets (Canada, USA & Europe), Chicago was the exception mainly by the adverse weather conditions in 1Q in USA, and in spite of the growth in the 2Q and 3Q. NTE managed lanes opened in October, 9 months ahead of schedule. Active pipeline in core markets (North America & Australia). ITR filed for chapter 11 pre-packaged; debt restructuring agreed with lenders. Revenues +1.6% 323mn EBITDA +1.5% 203mn/62.7% Positive performance on +2.0% traffic growth (+1.5% Heathrow, +5.0% regional), 2013 tariff increase (+10,4% April´13 and +11.3% July´14). Retail revenues +3.3%. New Heathrow T2 (The Queen's Terminal) opened on June 4 (approx. 350m daily flights). Double 2014 traffic growth estimate +1.5% (vs +0.7%) reaching 73.4mn passengers. Corporate transactions; Ferrovial has presented an offer for a stake in Aena, in the context of its potential privatization. Ferrovial has reached an agreement to acquire, in a 50/50 consortium with Macquarie Infrastructure Fund 4, 100% of Aberdeen, Glasgow and Southampton airports. Revenues +8.1% £2.125mn EBITDA +11.2% £1.199mn/56.4% Chicago Skyway Stake 55% (0.6)% 41,424 1.2mn Ausol ** Stake 80% +3.3% 12,177 (1.7)% 38mn 0.4mn M4 Stake 66% +3.6% 26,670 +4.4% 17mn 0.1mn 407ETR* Stake 43% +3.4% 1,821mn VKT +10.5% 446mn 4.2mn Traffic Revenues EBITDA Net debt € Ferrovial controls 25% of HAH Consolidated by equity method Glasgow Heathrow +1.5% 56mn +8.2% 1,986mn Traffic Revenues EBITDA +12.4% 1.172mn/59.0% +3.7% 5.9mn +4.4% 72mn +10.5% 28mn/38.4% +0.8% 46mn 8.7% 30mn/79.9% +4.4% 12mn/68.7% +10.2% 377mn/84.4% +0.4% 40mn/87.1% Debt £12.8bn RAB £14.8bn * Consolidated by equity method **Ausol I Flat sales, affected by Danwood disposal (Budimex, 4Q13) & lower activity in Spain & UK. LfL Sales & EBITDA +2.7% & +15%. International turnover represents 77% of revenues. Backlog (-1.8% vs Dec 13) doesn’t account for €800mn that will enter in coming months. EBITDA grew significantly compared to last year (+16.1%) driven by strong performance in Budimex and Webber. Budimex: Excluding Danwood, revenues & EBITDA would have grown by +17% & +42% on better cost management. Revenues (0.2)% 2,936mn Webber: Slight decline in revenues (-1.1%) affected by FX, LFL +1.2%. Robust EBITDA growth from risk mitigation in main toll road construction contracts that are being completed. EBITDA +16.1% 256mn/8.7% Backlog (1.8)% 7,726mn F. Agroman: New contracts in new countries (Brazil & Australia) provide visibility on future growth, although still in initial phase. +29.9% 1,968mn +19.1% 61mn (26.6)% 3mn/5.6% +11.3% 1,173mn (4.0)% 122mn/10.4% Revenues EBITDA Backlog +52.0% 120mn/6.1% +7.2% 337mn +0.2% 6,697mn +17.3% 13,641mn Revenues EBITDA Backlog (1.1)% 518mn +143.9% 50mn/9.6% (14.0)% 941mn (3.7)% 1.558mn +0.5% 169mn/10.8% (1.2)% 5,669mn +7.5% 860mn +16.2% 38mn/4.4% +7.6% 1.123mn New regulatory period (Q6) started on 1st April 2014 until 31th December 2018. Maximum allowable yield per passenger will be RPI minus 1.5%. Var % in local currency. Spain UK International IR Department e: ir@ferrovial.com - +34 915862730 2 F. Agromán RoW Budimex Poland Webber US Aberdeen +8.2% 2.8mn +9.8% 48mn +13.8% 19mn/38.6% Southampton +4.2% 1.4mn +1.4% 21mn -3.9% 6mn/28.5% Algarve Stake 85% +10.0% 10,384 +37.0% 36mn 0.1mn +45.3% 33mn/90.8% Developing assets: NTE.- (Section 1 & 2) were completed in 4th Oct 2014. LBJ.- 90% of construction is now complete, opening expected in 2015. 407 East.- 45% of construction is complete, opening expected end 2015. I-77.- The project received its NTP1 (Notice to proceed) on 22 August.
- 3. •total Fixed Assets 18.8bn Current Assets 6.4bn 25.2bn Equity 7.1bn Non current Liabilities & others 12.7bn Current Liabilities 5.4bn Gross cash 3.1bn • 1.5bn Gross debt 1.5bn Ex. Infrastructure Projects (1.5)bn Infrastructure Projects 7.6bn corporate 43mn 2014 14mn 2015 18mn 2016 11mn 2017 Total cash 3.1bn Total liquidity 3.9bn Undrawn lines 0.9bn 1.4bn 2018+ Strong balance sheet and liquidity position to finance future growth opportunities. At the end of September´14, Ferrovial’s net cash position, excluding infrastructure projects, amounted to EUR1,533mn. The dividends received from Infrastructure projects reached to €238mn (€355mn in 9M 13). Standard & Poor’s BBB / stable Fitch BBB / stable IR Department e: ir@ferrovial.com - +34 915862730 3 85% Bonds (last upgrade July 2014) (last upgrade 9 May 2013) Total 6.1bn
- 4. Women in the company 28,2% (14% of management) Spain 55% America 7% UK 28% Poland 6% RoW 4% Employees worldwide 66,088 2013 52mn Investment In infrastructure & technologies to reduce environment impact Lower energy consumption 2009 - 2013 -31.9% Reduction of carbon footprint Management of new business opportunities Priorities The combination of talent and commitment made by Ferrovial’s professionals is one of the pillars of its success and future sustainability. Professional development, transversal management of talent and the increasing internationalisation are among the company’s strategic priorities, in an environment that guarantees equal opportunities on the basis of merit. 2013: balanced contribution between fix, variable and long term incentives: Metrics of The Long Term Incentive Grant 2013 are a mix of: EBITDA / Net Productive Asset , Cash Flow , TSR * in comparison with 16 international listed companies: *ACS, OHL, FCC, Abertis, Serco, Carrillion, Vinci, Skanska, Strabag, Eiffage, Balfour Beatty, Bilfinger Berger, SNC Lavalin, Transurban, ADP, Fraport. 22% Fixed 39% Variable 39% Long Term incentives 2010 Grant Ferrovial compares with IBEX35 and is in the average compensation of that group. Euros 0 200,000 400,000 Percentile 75 0-25%il 25-50%il 50-75%il 75-90%il Percentile 25 Percentile 90 Mean Media Board remuneration non executive President & CEO remuneration Source: Towers Watson IR Department e: ir@ferrovial.com - +34 915862730 4 8 out of 10 employees would recommend Ferrovial as a good company to work for. Percentage satisfaction 90,000 100,000 110,000 120,000 130,000 370,000 380,000 390,000 400,000 410,000 420,000 2009 2010 2011 2012 2013 Fossil Fuels Electricity •For the last 13 consecutive years Ferrovial has been included in the DJSI (Dow Jones Sustainability Index) •With a mark of 99 out of 100, Ferrovial leads worldwide the CDP (Carbon Disclosure Project) ratings in its areas of activity •The Norwegian classification society DNV GL has ranked Ferrovial as one of the five most responsible infrastructure companies in the world R&D Investment Million Euros 2013 2012 2011 2010 32.9 32.6 51.32 45 Living LAB Guadalajara Conceived as a space to unfold new technologies that transform and improve urban services. BINDOGS pilot and TUCIUDAPP platform. Projects with MIT The “System for Waste Separation and Evaluation” project started with the objective of improving the operations and design of the urban waste separation and treatment plants. Ferrovial innovation awards Inviting its employees to offer solutions to four challenges ,one for each business unit. The results of this second edition are: 636 Participants 677 Ideas 45% teams Madrid smart LAB The city competition Centre links as equals the local council, the entrepreneur and the services company. As a result 59 proposals submitted. 31 Mobility proposals and 28 Quality of life 83% 81% 75% General satisfaction Commitment Leadership style 1 Risk management and environment responsibility 2