Unemployment euro
•
0 likes•364 views

Document used by www.euxtra.com as informationon to its users Document created and on the behalf of the European Commission

Recommended
More Related Content
More from EUmobilitydocumentation
More from EUmobilitydocumentation (20)
Recently uploaded
Recently uploaded (20)
Unemployment euro
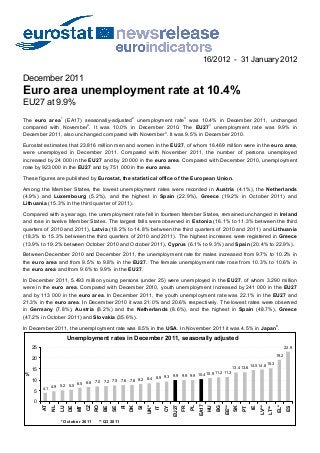
- 1. 16/2012 - 31 January 2012 December 2011 Euro area unemployment rate at 10.4% EU27 at 9.9% The euro area1 (EA17) seasonally-adjusted2 unemployment rate3 was 10.4% in December 2011, unchanged compared with November4 . It was 10.0% in December 2010. The EU271 unemployment rate was 9.9% in December 2011, also unchanged compared with November4 . It was 9.5% in December 2010. Eurostat estimates that 23.816 million men and women in the EU27, of whom 16.469 million were in the euro area, were unemployed in December 2011. Compared with November 2011, the number of persons unemployed increased by 24 000 in the EU27 and by 20 000 in the euro area. Compared with December 2010, unemployment rose by 923 000 in the EU27 and by 751 000 in the euro area. These figures are published by Eurostat, the statistical office of the European Union. Among the Member States, the lowest unemployment rates were recorded in Austria (4.1%), the Netherlands (4.9%) and Luxembourg (5.2%), and the highest in Spain (22.9%), Greece (19.2% in October 2011) and Lithuania (15.3% in the third quarter of 2011). Compared with a year ago, the unemployment rate fell in fourteen Member States, remained unchanged in Ireland and rose in twelve Member States. The largest falls were observed in Estonia (16.1% to 11.3% between the third quarters of 2010 and 2011), Latvia (18.2% to 14.8% between the third quarters of 2010 and 2011) and Lithuania (18.3% to 15.3% between the third quarters of 2010 and 2011). The highest increases were registered in Greece (13.9% to 19.2% between October 2010 and October 2011), Cyprus (6.1% to 9.3%) and Spain (20.4% to 22.9%). Between December 2010 and December 2011, the unemployment rate for males increased from 9.7% to 10.2% in the euro area and from 9.5% to 9.8% in the EU27. The female unemployment rate rose from 10.3% to 10.6% in the euro area and from 9.6% to 9.9% in the EU27. In December 2011, 5.493 million young persons (under 25) were unemployed in the EU27, of whom 3.290 million were in the euro area. Compared with December 2010, youth unemployment increased by 241 000 in the EU27 and by 113 000 in the euro area. In December 2011, the youth unemployment rate was 22.1% in the EU27 and 21.3% in the euro area. In December 2010 it was 21.0% and 20.6% respectively. The lowest rates were observed in Germany (7.8%), Austria (8.2%) and the Netherlands (8.6%), and the highest in Spain (48.7%), Greece (47.2% in October 2011) and Slovakia (35.6%). In December 2011, the unemployment rate was 8.5% in the USA. In November 2011 it was 4.5% in Japan8 . Unemployment rates in December 2011, seasonally adjusted 4.1 5.2 5.5 6.5 6.8 7.0 7.2 7.5 7.8 8.2 8.4 8.9 9.3 9.9 10.9 11.2 11.3 13.4 13.6 14.5 15.3 19.2 22.9 7.6 9.9 14.8 10.4 4.9 9.9 0 5 10 15 20 25 AT NL LU DE MT CZ RO BE SE FI DK SI UK* IT CY EU27 FR PL EA17 HU BG EE** SK PT IE LV** LT** EL* ES % * October 2011 ** Q3 2011
- 2. 1. The euro area (EA17) consists of Belgium, Germany, Estonia, Ireland, Greece, Spain, France, Italy, Cyprus, Luxembourg, Malta, the Netherlands, Austria, Portugal, Slovenia, Slovakia and Finland. The EU27 includes Belgium (BE), Bulgaria (BG), the Czech Republic (CZ), Denmark (DK), Germany (DE), Estonia (EE), Ireland (IE), Greece (EL), Spain (ES), France (FR), Italy (IT), Cyprus (CY), Latvia (LV), Lithuania (LT), Luxembourg (LU), Hungary (HU), Malta (MT), the Netherlands (NL), Austria (AT), Poland (PL), Portugal (PT), Romania (RO), Slovenia (SI), Slovakia (SK), Finland (FI), Sweden (SE) and the United Kingdom (UK). 2. Non-seasonally adjusted and trend data can be found in the statistical database on the Eurostat website. 3. Eurostat produces harmonised unemployment rates for individual EU Member States, the euro area and the EU. These unemployment rates are based on the definition recommended by the International Labour Organisation (ILO). The measurement is based on a harmonised source, the European Union Labour Force Survey (LFS). Based on the ILO definition, Eurostat defines unemployed persons as persons aged 15 to 74 who: - are without work; - are available to start work within the next two weeks; - and have actively sought employment at some time during the previous four weeks. The unemployment rate is the number of people unemployed as a percentage of the labour force. The labour force is the total number of people employed plus unemployed. The numbers of unemployed and the monthly unemployment rates are estimates based on results of the LFS which is a continuous household survey carried out in Member States on the basis of agreed definitions. These results are interpolated/extrapolated to monthly data using national survey data and/or national monthly series on registered unemployment. The most recent figures are therefore provisional; results from the Labour Force Survey are available 90 days after the end of the reference period for most Member States. Monthly unemployment and employment series are calculated first at the level of four categories for each Member State (males and females 15-24 years, males and females 25-74 years). These series are then seasonally adjusted and all the national and European aggregates are calculated. Member States may publish other rates such as register based unemployment rates, or rates based on national Labour Force Surveys or corresponding surveys. These rates may vary from those published by Eurostat due to a different definition or methodological choices. Current deviations from the definition of unemployment in the EU Labour Force Survey: Spain, Italy and United Kingdom: Unemployment is restricted to persons aged 16-74. In Spain and Italy the legal minimum age for working is 16. Employment data used for Italy includes also those above 74. 4. Compared with the rates published in News Release 5/2012 of 6 January 2012, the November 2011 unemployment rates for the EA17 were revised from 10.3% to 10.4% and for the EU27 from 9.8% to 9.9%. Among Member States, the rate has been revised by between 0.2 and 0.4 percentage points for Ireland, Italy and Finland. The revisions are primarily caused by the inclusion of the most recent EU Labour Force Survey data in the calculation process and updates to the seasonally adjusted series. The following LFS data are used in the calculations of the monthly unemployment rates published in this News Release: For Germany, Italy, the Netherlands, Austria, Romania, Finland and Sweden monthly data up to and including December 2011. For Greece monthly data up to and including October 2011. For the United Kingdom monthly data up to and including September-October-November 2011 (3-month rolling average). For Spain quarterly data up to and including Q4 2011. For Belgium, Bulgaria, the Czech Republic, Denmark, Estonia, Ireland, France, Cyprus, Latvia, Lithuania, Luxembourg, Hungary, Malta, Poland, Portugal, Slovenia and Slovakia quarterly data up to and including Q3 2011. 5. Italy has implemented a method to produce monthly unemployment data purely based on the LFS. For the moment, these data should be considered provisional. 6. Estonia, Latvia, Lithuania: quarterly data for all series. Cyprus, Romania and Slovenia: quarterly data for youth unemployment. 7. For Germany, Austria and Finland the trend component is used instead of the more volatile seasonally adjusted data. 8. Results for Japan including the three prefectures most affected by the earthquake are available again from September 2011. Figures from March 2011 to August 2011 exclude these three prefectures. Issued by: Eurostat Press Office Tim ALLEN Tel: +352-4301-33 444 eurostat-pressoffice@ec.europa.eu Eurostat news releases on internet: http://ec.europa.eu/eurostat For further information on data: Hubertus VREESWIJK Tel: +352-4301-34 323 Hannah KIIVER Tel: +352-4301-38 438 estat-monthly-unemployment@ec.europa.eu Selected Principal European Economic Indicators: http://ec.europa.eu/eurostat/euroindicators
- 3. Euro area and EU27 unemployment rates 6 7 8 9 10 I II III IV I II III IV I II III IV I II III IV I II III IV I II III IV I II III IV I II III IV I II III IV I II III IV I II III IV I II III IV 2000 2001 2002 2003 2004 2005 2006 2007 2008 2009 2010 2011 % Euro area (EA17), seasonally adjusted series EU27, seasonally adjusted series SEASONALLY ADJUSTED UNEMPLOYMENT RATES (%) TOTALS Dec 2010 Jun 2011 Jul 2011 Aug 2011 Sep 2011 Oct 2011 Nov 2011 Dec 2011 EA17 10.0 10.0 10.1 10.2 10.3 10.3 10.4 10.4 EU27 9.5 9.6 9.6 9.7 9.8 9.8 9.9 9.9 BE 7.6 7.2 7.3 7.4 7.4 7.3 7.2 7.2 BG 11.4 11.2 11.1 11.0 10.9 10.9 11.0 11.2 CZ 7.2 6.8 6.7 6.6 6.5 6.6 6.7 6.8 DK 7.6 7.5 7.5 7.5 7.6 7.7 7.8 7.8 DE 7 6.6 5.9 5.9 5.8 5.8 5.7 5.6 5.5 EE 6 14.5 12.7 11.3 11.3 11.3 : : : IE 14.5 14.4 14.6 14.6 14.4 14.4 14.4 14.5 EL 14.4 17.2 17.9 18.4 18.8 19.2 : : ES 20.4 21.3 21.7 22.1 22.4 22.7 22.9 22.9 FR 9.7 9.6 9.7 9.6 9.7 9.7 9.8 9.9 IT 5 8.1 8.2 8.3 8.3 8.6 8.5 8.8 8.9 CY 6.1 7.4 7.7 8.0 8.4 8.7 9.0 9.3 LV 6 17.0 16.1 14.8 14.8 14.8 : : : LT 6 17.4 15.6 15.3 15.3 15.3 : : : LU 4.8 4.8 4.9 4.9 5.0 4.9 4.9 5.2 HU 11.0 11.0 10.9 10.9 10.8 10.8 10.7 10.9 MT 6.6 6.5 6.5 6.4 6.4 6.4 6.5 6.5 NL 4.3 4.1 4.3 4.4 4.5 4.8 4.9 4.9 AT 7 4.2 3.9 3.7 3.7 3.9 4.1 4.1 4.1 PL 9.6 9.6 9.7 9.7 9.8 9.9 9.9 9.9 PT 12.4 e 12.5 12.6 12.6 12.8 13.0 13.2 13.6 RO 7.3 7.3 7.5 7.5 7.7 7.3 7.3 7.0 SI 8.0 8.0 8.1 8.0 8.2 8.2 8.2 8.2 SK 13.8 13.3 13.4 13.4 13.4 13.5 13.5 13.4 FI 7 8.1 7.8 7.8 7.7 7.7 7.6 7.6 7.6 SE 7.8 7.4 7.4 7.4 7.3 7.5 7.5 7.5 UK 7.8 8.0 8.1 8.3 8.3 8.4 : : NO 3.4 3.3 3.2 3.2 3.3 3.3 : : US 9.4 9.1 9.1 9.1 9.0 8.9 8.7 8.5 JP 8 4.9 4.6 4.7 4.3 4.1 4.5 4.5 : : Data not available e Estimate Source: Eurostat
- 4. SEASONALLY ADJUSTED UNEMPLOYMENT RATES (%) Youth (under 25's) Males Females Dec-10 Oct-11 Nov-11 Dec-11 Dec-10 Oct-11 Nov-11 Dec-11 Dec-10 Oct-11 Nov-11 Dec-11 EA17 20.6 21.1 21.4 21.3 9.7 10.1 10.2 10.2 10.3 10.6 10.7 10.6 EU27 21.0 21.9 22.1 22.1 9.5 9.7 9.8 9.8 9.6 9.9 10.0 9.9 BE 20.8 21.1 21.1 20.7 7.7 7.3 7.2 7.2 7.6 7.3 7.3 7.2 BG 26.0 25.0 25.8 26.8 12.2 11.8 12.0 12.3 10.5 9.8 9.9 10.1 CZ 17.1 18.7 19.1 19.5 6.4 5.8 5.9 6.1 8.3 7.7 7.7 7.7 DK 13.6 15.0 15.0 14.7 7.9 7.6 7.7 7.7 7.3 7.9 7.9 7.9 DE 7 9.1 8.2 8.0 7.8 6.9 5.8 5.7 5.6 6.2 5.5 5.4 5.3 EE 6 25.7 21.8* : : 15.7 11.4* : : 13.3 11.1* : : IE 29.5 28.7 28.8 29.0 17.8 17.2 17.2 17.3 10.4 10.9 11.0 11.1 EL 37.2 47.2 : : 11.6 17.2 : : 18.2 22.1 : : ES 43.5 48.3 48.7 48.7 20.0 22.3 22.5 22.4 20.9 23.2 23.3 23.4 FR 23.0 23.2 23.6 23.8 9.0 9.2 9.3 9.5 10.3 10.3 10.3 10.3 IT 5 28.1 30.0 31.2 31.0 7.4 7.8 8.0 8.4 9.2 9.5 10.0 9.6 CY 6 15.3 25.8 25.8 25.8 5.8 8.8 9.2 9.5 6.6 8.6 8.8 9.1 LV 6 30.8 30.0* : : 18.7 16.8* : : 15.2 12.8* : : LT 6 33.9 31.0* : : 20.0 17.5* : : 14.8 13.1* : : LU 15.2 14.5 14.4 15.2 3.8 3.7 3.7 4.0 6.2 6.4 6.4 6.6 HU 25.7 26.2 26.0 26.7 11.3 10.9 10.7 10.9 10.7 10.7 10.7 10.9 MT 13.6 13.9 14.2 14.2 6.6 6.1 6.1 6.2 6.7 7.0 7.1 7.1 NL 8.2 8.2 8.6 8.6 4.2 4.7 4.9 4.9 4.4 4.8 5.0 4.9 AT 7 8.0 8.7 8.5 8.2 4.1 4.0 3.8 3.8 4.2 4.2 4.3 4.4 PL 24.3 27.0 27.6 27.7 9.2 9.0 9.1 9.1 10.0 10.9 10.9 10.8 PT 26.9 e 30.4 30.6 30.8 12.1 e 12.7 12.9 13.3 12.7 e 13.3 13.5 13.9 RO 6 23.3 23.4* : : 8.0 8.1 7.7 7.4 6.3 6.4 6.7 6.5 SI 6 14.5 15.2 15.2 15.2 8.3 8.3 8.4 8.5 7.7 8.0 8.0 7.9 SK 33.2 34.7 35.2 35.6 13.8 13.5 13.6 13.6 13.9 13.4 13.3 13.2 FI 7 20.7 19.9 19.9 19.9 8.6 8.4 8.4 8.4 7.5 6.8 6.7 6.6 SE 24.1 22.3 23.2 22.9 7.7 7.7 7.5 7.6 7.8 7.3 7.4 7.3 UK 20.3 22.3 : : 8.5 9.1 : : 7.0 7.7 : : NO 9.0 8.6 : : 3.9 3.3 : : 2.8 3.4 : : US 18.0 16.7 16.8 16.7 10.0 9.4 8.9 8.7 8.6 8.4 8.3 8.3 JP 8 : : : : 5.3 4.8 4.8 : 4.4 4.0 4.1 : * Data for Q3 2011 : Data not available e Estimate Source: Eurostat SEASONALLY ADJUSTED NUMBER OF UNEMPLOYED (in millions) Dec 2010 Jun 2011 Jul 2011 Aug 2011 Sep 2011 Oct 2011 Nov 2011 Dec 2011 EA17 15.718 15.829 15.975 16.054 16.245 16.335 16.449 16.469 EU27 22.893 22.990 23.187 23.318 23.538 23.667 23.792 23.816 EA17 - youth 3.177 3.175 3.192 3.187 3.241 3.257 3.307 3.290 EU27 - youth 5.252 5.251 5.291 5.310 5.386 5.439 5.508 5.493 Euro area and EU27 unemployed (in millions) 10 12 14 16 18 20 22 24 I II III IV I II III IV I II III IV I II III IV I II III IV I II III IV I II III IV I II III IV I II III IV I II III IV I II III IV I II III IV 2000 2001 2002 2003 2004 2005 2006 2007 2008 2009 2010 2011 Euro area (EA17), seasonally adjusted series EU27, seasonally adjusted series