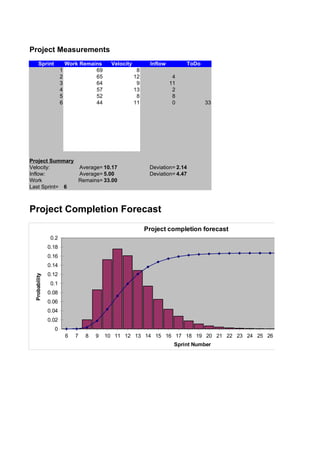
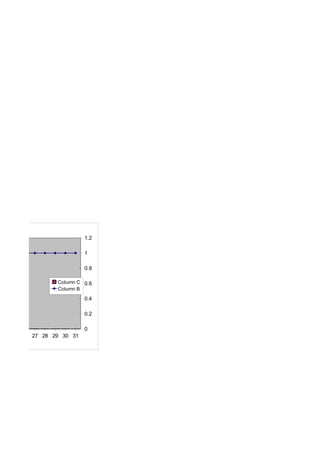
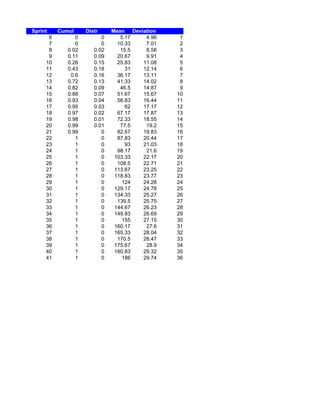
Project Measurements
      Sprint              Work Remains      Velocity         Inflow        ToDo
                      1             69                  8
                      2             65                 12              4
                      3             64                  9             11
                      4             57                 13              2
                      5             52                  8              8
                      6             44                 11              0          33


Project Summary
Velocity:       Average= 10.17                               Deviation= 2.14
Inflow:         Average= 5.00                                Deviation= 4.47
Work            Remains= 33.00
Last Sprint= 6


Project Completion Forecast
                                                            Project completion forecast
                0.2
               0.18
               0.16
               0.14
               0.12
 Probability


                0.1                                                                                 Column
                                                                                                    Column
               0.08
               0.06
               0.04
               0.02
                 0
                          6   7   8   9   10 11 12 13 14 15 16 17 18 19 20 21 22 23 24 25 26 27 28 29 30 3
                                                                       Sprint Number
1.2

                          1

                          0.8

                Column C 0.6
                Column B
                          0.4

                          0.2

                          0
24 25 26 27 28 29 30 31
Sprint    Cumul     Distr     Mean Deviation
      6         0         0      5.17   4.96    1
      7         0         0     10.33   7.01    2
      8      0.02      0.02      15.5   8.58    3
      9      0.11      0.09     20.67   9.91    4
     10      0.26      0.15     25.83  11.08    5
     11      0.43      0.18        31  12.14    6
     12       0.6      0.16     36.17  13.11    7
     13      0.72      0.13     41.33  14.02    8
     14      0.82      0.09      46.5  14.87    9
     15      0.88      0.07     51.67  15.67   10
     16      0.93      0.04     56.83  16.44   11
     17      0.95      0.03        62  17.17   12
     18      0.97      0.02     67.17  17.87   13
     19      0.98      0.01     72.33  18.55   14
     20      0.99      0.01      77.5   19.2   15
     21      0.99         0     82.67  19.83   16
     22         1         0     87.83  20.44   17
     23         1         0        93  21.03   18
     24         1         0     98.17   21.6   19
     25         1         0    103.33  22.17   20
     26         1         0     108.5  22.71   21
     27         1         0    113.67  23.25   22
     28         1         0    118.83  23.77   23
     29         1         0       124  24.28   24
     30         1         0    129.17  24.78   25
     31         1         0    134.33  25.27   26
     32         1         0     139.5  25.75   27
     33         1         0    144.67  26.23   28
     34         1         0    149.83  26.69   29
     35         1         0       155  27.15   30
     36         1         0    160.17   27.6   31
     37         1         0    165.33  28.04   32
     38         1         0     170.5  28.47   33
     39         1         0    175.67   28.9   34
     40         1         0    180.83  29.32   35
     41         1         0       186  29.74   36

FreakonomicsOfScrum spreadsheet

  • 1.
    Project Measurements Sprint Work Remains Velocity Inflow ToDo 1 69 8 2 65 12 4 3 64 9 11 4 57 13 2 5 52 8 8 6 44 11 0 33 Project Summary Velocity: Average= 10.17 Deviation= 2.14 Inflow: Average= 5.00 Deviation= 4.47 Work Remains= 33.00 Last Sprint= 6 Project Completion Forecast Project completion forecast 0.2 0.18 0.16 0.14 0.12 Probability 0.1 Column Column 0.08 0.06 0.04 0.02 0 6 7 8 9 10 11 12 13 14 15 16 17 18 19 20 21 22 23 24 25 26 27 28 29 30 3 Sprint Number
  • 2.
    1.2 1 0.8 Column C 0.6 Column B 0.4 0.2 0 24 25 26 27 28 29 30 31
  • 3.
    Sprint Cumul Distr Mean Deviation 6 0 0 5.17 4.96 1 7 0 0 10.33 7.01 2 8 0.02 0.02 15.5 8.58 3 9 0.11 0.09 20.67 9.91 4 10 0.26 0.15 25.83 11.08 5 11 0.43 0.18 31 12.14 6 12 0.6 0.16 36.17 13.11 7 13 0.72 0.13 41.33 14.02 8 14 0.82 0.09 46.5 14.87 9 15 0.88 0.07 51.67 15.67 10 16 0.93 0.04 56.83 16.44 11 17 0.95 0.03 62 17.17 12 18 0.97 0.02 67.17 17.87 13 19 0.98 0.01 72.33 18.55 14 20 0.99 0.01 77.5 19.2 15 21 0.99 0 82.67 19.83 16 22 1 0 87.83 20.44 17 23 1 0 93 21.03 18 24 1 0 98.17 21.6 19 25 1 0 103.33 22.17 20 26 1 0 108.5 22.71 21 27 1 0 113.67 23.25 22 28 1 0 118.83 23.77 23 29 1 0 124 24.28 24 30 1 0 129.17 24.78 25 31 1 0 134.33 25.27 26 32 1 0 139.5 25.75 27 33 1 0 144.67 26.23 28 34 1 0 149.83 26.69 29 35 1 0 155 27.15 30 36 1 0 160.17 27.6 31 37 1 0 165.33 28.04 32 38 1 0 170.5 28.47 33 39 1 0 175.67 28.9 34 40 1 0 180.83 29.32 35 41 1 0 186 29.74 36