Recommended

Recommended
More Related Content
Recently uploaded
Recently uploaded (20)
Featured
Featured (20)
Sparc bc aug 2014 vulnerable seniors infographics
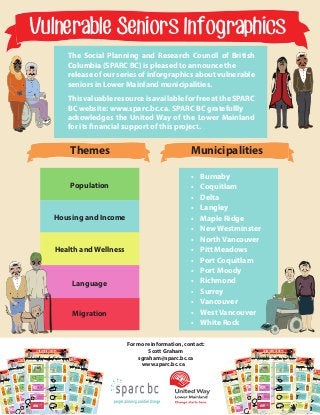
- 1. Spotlight on Vulnerable Seniors Vulnerable Seniors Infographics The Social Planning and Research Council of British Columbia (SPARC BC) is pleased to announce the release of our series of inforgraphics about vulnerable seniors in Lower Mainland municipalities. This valuable resource is available for free at the SPARC BC website: www.sparc.bc.ca. SPARC BC gratefullly ackowledges the United Way of the Lower Mainland for its nancial support of this project. Themes Municipalities • Burnaby • Coquitlam • Delta • Langley • Maple Ridge • New Westminster • North Vancouver • Pitt Meadows • Port Coquitlam • Port Moody • Richmond • Surrey • Vancouver • West Vancouver • White Rock Vulnerable Seniors SPOTLIGHT ON NEW WESTMINSTER SPOTLIGHT ON PORT MOODY POPULATIONHOUSING INCOME MIGRATION LANGUAGE HEALTH WELLNESS POPULATION HOUSING INCOME MIGRATION LANGUAGE HEALTH WELLNESS Vulnerable Seniors Vulnerable Seniors SPOTLIGHT ON PITT MEADOWS Seniors Population Unaordable Housing POPULATION HOUSING INCOME MIGRATION LANGUAGE HEALTH WELLNESS Population Unaordable Housing SPOTLIGHT ON LANGLEY 200% increase in number of seniors over 100 years of Seniors Population Unaordable Housing Aging Seniors Between 2001-2011, the number of people over the age of 100 increased from 10 to 25 seniors. age 4 senior households spend 30% or more of their income on housing. Between 2006 - 2011, this number increased from 2,125 to 2,510 seniors. Housing Waitlists Between Senior Newcomers Low Income In 2011, 2,005 seniors lived on a low income. Seniors living alone had after-tax incomes of approximately $19,500 or less. Seniors living in couples had after-tax incomes of approximately $27,250 or less. English Speaking Non-Between 2001- 2011, the number of seniors who could not speak English from 130 2% seniors 2009 - 2012, the number of seniors and persons with disabilities (PWD) on BC Housing’s social housing waitlist increased from 38 to 61 people. 61 Health Concerns POPULATION HOUSING INCOME MIGRATION LANGUAGE HEALTH WELLNESS 95 new immigrant seniors 12% of seniors live on a low income 38% increase in the number of seniors 18% increase in seniors at risk of losing their homes Housing Waitlists 61% increase in seniors PWD on social housing wait lists 150% increase in number of seniors over 100 years of age Between 2009 - 2012, the number of seniors and persons with disabilities (PWD) on BC Housing’s social housing waitlist increased from16 to 27 people. 189% increase in seniors who could not speak 30% increase in seniors who lived alone Lone Seniors Between 2001-2011, the number of seniors living alone increased from 3,470 to 4,505 seniors. 1/Between 2001 - 2011, the seniors population increased from 13,135 to 18,120 seniors. 1/4 seniors live alone Vulnerable Seniors Vulnerable Seniors SPOTLIGHT ON DELTA POPULATIONHOUSING INCOME MIGRATION LANGUAGE HEALTH WELLNESS SPOTLIGHT ON WEST VANCOUVER Vulnerable Seniors POPULATION HOUSING INCOME MIGRATION LANGUAGE HEALTH WELLNESS POPULATION HOUSING INCOME MIGRATION LANGUAGE HEALTH WELLNESS Vulnerable Seniors Seniors Population Unaordable Housing Seniors Population Unaordable Housing SPOTLIGHT ON WHITE ROCK Seniors Population Unaordable Housing Seniors Aging 33% increase in number of seniors over 100 years of age Between 2001-2011, the number of people over the age of 100 increased from 10 to 20 seniors. 4 senior households spend 30% or more of their income on housing. Between 2006 - 2011, this number decreased from 1,025 to 860 seniors. Housing Waitlists Low Income 4 senior households spend 30% or more of their income on housing. Between 2006 - 2011, this number rose from 1,725 to 1,890 seniors. Housing Waitlists 80% increase in number of seniors over 100 years of age Between 2009 - 2012, the number of seniors and persons with disabilities (PWD) on BC Housing’s social housing waitlist increased from 31 to 57 people. English Speaking Non-3% of seniors cannot speak English In 2011, 610 seniors lived on a low income. Seniors living alone had after-tax incomes of approximately $19,500 or less. Seniors living in couples had after-tax incomes of approximately $27,250 or less. English Speaking Non-Between 2001- 2011, of Between 2009 - 2012, the number of seniors and persons with disabilities (PWD) on BC Housing’s social housing waitlist increased from 13 to 19 people. 19 POPULATION HOUSING INCOME MIGRATION LANGUAGE HEALTH WELLNESS 12% of seniors live on a low income 2% increase in the number of seniors 16% decrease in seniors at risk of losing their homes Low Income 46% increase in seniors PWD on social housing wait lists Housing Waitlists Low Income immigrant seniors Non-43% increase in 100% increase in number of seniors over 100 years of 9% increase in seniors who lived alone age Lone Seniors Between 2001-2011, the number of seniors living alone increased from 1,890 to 2,055 seniors. 1/Between 2001 - 2011, the seniors population increased from 5,580 to 5,690 seniors. 2/5 seniors live alone Aging Seniors Between 2001 - 2011, the number of people over the age of 100 increased from 15 to 20 seniors. Seniors Population Unaordable Housing In 2011, 1,040 seniors lived on a low income. Seniors living alone had after-tax incomes of approximately $19,500 or less. Seniors living in couples had after-tax incomes of approximately $27,250 or less. Between 2001- 2011, the number of seniors who could not speak English increased from 175 to 260 seniors. First Languages Other Than English In 2011, German (585) and Farsi (425) were the most commonly spoken languages among seniors other than English. 27% of seniors do not speak English as their first language 57 Health Concerns 20% In 2011, the North Shore/ Coast Garibaldi Health Service Delivery Area found that 20% of seniors had perceived their health as fair to poor. 10% of seniors live on a low income 19% increase in the number of seniors 10% increase in seniors at risk of losing their homes 84% increase in seniors PWD on social housing wait lists 49% increase in seniors who could not speak English 16% increase in seniors who lived alone Lone Seniors Between 2001-2011, the number of seniors living alone increased from 2,515 to 2,920 seniors. Senior Newcomers 150 1/Between 2001 - 2011, the seniors population increased from 9,110 to 10,875 seniors. 1/4 seniors live alone For data source information, see data source sheet. that 33% POPULATION Vulnerable Seniors HOUSING INCOME LANGUAGE HEALTH WELLNESS Seniors Population Housing Waitlists Unaordable Housing Low Income Aging Seniors In 2011, Maple Ridge had 10 seniors over the age of 100. Housing Waitlists Between Low Income In 2011, 1,145 seniors lived on a low income. Seniors living alone had after-tax incomes of approximately $19,500 or less. Seniors living in couples had after-tax incomes of approximately $27,250 or less. Non-English Speaking 2009 - 2012, the number of seniors and persons with disabilities (PWD) on BC Housing’s social housing waitlist increased from 60 to 97 people. 97 Health Concerns 33% In 2011, the Fraser North Health Service Delivery Area found SPOTLIGHT ON MAPLE RIDGE 13% of seniors live on a low income 36% increase in the number of seniors Housing Waitlists 23% increase in seniors who lived alone Lone Seniors Between 2001- 2011, the number of seniors living alone increased from 1,885 to 2,310 seniors. 1/4 senior households 30% or more their income housing. Between 2006 - 2011, this number increased from 1,060 to 1,340 seniors. Between 2001 - 2011, the seniors population increased from 6,765 to 9,210 seniors. 1/4 seniors live alone Vulnerable Seniors SPOTLIGHT ON DELTA Seniors Population Housing Waitlists Unaordable Housing Aging Seniors In 2011, there were 10 people over the age of 100 in Delta. Housing Waitlists Low Income In 2011, 1,495 seniors lived on a low income. Seniors living alone had after-tax incomes of approximately $19,500 or less. Seniors living in couples had after-tax incomes of approximately $27,250 or less. Between 2009 - 2012, the number of seniors and persons with disabilities (PWD) on BC Housing’s social housing waitlist increased from 52 to 56 people. 56 Health Concerns 13% In 2011, the POPULATION HOUSING INCOME MIGRATION LANGUAGE HEALTH WELLNESS 10% of seniors live on a low income 44% increase in the number of seniors 5% increase in seniors at risk of losing their homes 8% increase in seniors PWD on social housing wait lists 17% increase in seniors who lived alone Lone Seniors Between 2001-2011, the number of seniors living alone increased from 2,510 to 2,935 seniors. 1/5 senior households spend 30% or more of their income on housing. Between 2006 - 2011, this number increased from 1,560 to 1,640 seniors. Between 2001 - 2011, the seniors population increased from 10,760 to 15,455 seniors. 1/5 seniors live alone Seniors Low Income First Languages other than English In 2011, German (120) and Farsi (75) were the most commonly spoken languages among seniors other than 32% of seniors do not speak English as their first language Non-English Speaking Between 2001- 2011, the number of seniors who could not speak English increased from 80 to 175 seniors. 6% of seniors cannot speak English 27 Vulnerable Seniors 10% of seniors live on a low income 90% increase in the number of seniors 66% increase in seniors at risk of losing their homes 69% increase in seniors PWD on social housing wait lists 119% increase in seniors who could not speak English 92% increase in seniors who lived alone Lone Seniors Between 2001 - 2011, the number of seniors living alone increased from 320 to 615 seniors. Between 2000 - 2010, 95 new immigrant seniors settled in Port Moody. 1/5 senior households spend 30% or more of their income on housing. Between 2006 - 2011, this number rose from 220 to 365 seniors. Between 2001 - 2011, the seniors population increased from 1,585 to 3,005 seniors. 1/5 seniors live alone For all data source information, see data source sheet. In 2011, 285 seniors lived on a low income. Seniors living alone had after-tax incomes of approximately $19,500 or less. Seniors living in couples had after-tax incomes of approximately $27,250 or less. Health Concerns 33% In 2011, the Fraser North Health Service Delivery Area found that 33% of seniors had perceived their health as fair to poor. Aging Seniors Between 2001-2011, the number of people over the age of 100 increased from 25 to 45 seniors. Low Income First Languages other than English do not speak Between 60% of seniors In 2011, 2000 - 2010, 1,375 new English Speaking Between 2001- 2011, the number of seniors who could not speak English increased from 3,135 to 5,140 seniors. 17% of seniors cannot speak English Between 2009 - 2012, the number of seniors and persons with disabilities (PWD) on BC Housing’s social housing waitlist increased from 319 to 482 people. 482 Health Concerns 33% In 2011, the Fraser North Health Service Delivery Area found that 33% of seniors had perceived their health as fair to poor. SPOTLIGHT ON BURNABY 18% of seniors live on a low income 19% increase in the number of seniors 13% increase in seniors at risk of losing their homes 51% increase in seniors PWD on social housing wait lists 64% increase in seniors who could not speak English 6% increase in seniors who lived alone Lone Seniors Between 2001-2011, the number of seniors living alone increased from 6,610 to 7,015 seniors. Senior Newcomers 1,375 new immigrant seniors 1/4 senior households spend 30% or more of their income on housing. Between 2006 - 2011, this number rose from 4,460 to 5,035 seniors. Between 2001 - 2011, the seniors population increased from 25,950 to 30,900 seniors. In 2011, 5,250 seniors lived on a low income. Seniors living alone had after-tax incomes of approximately $19,500 or less. Seniors living in couples had after-tax incomes of approximately $27,250 or less. 1/4 seniors live alone For data source information, see data source sheet. Seniors Population Unaordable Housing In 2011, 315 seniors lived on a low income. Seniors living alone had after-tax incomes of approximately $19,500 or less. Seniors living in couples had after-tax incomes of approximately $27,250 or less. Between 2000 - 2010, 15 new immigrant seniors settled in Pitt Meadows. Non-English Speaking Between 2001- 2011, the number of seniors who could not speak English increased from 60 to 90 seniors. 4% of seniors cannot speak English Between 2009 - 2012, the number of seniors and persons with disabilities (PWD) on BC Housing’s social housing waitlist increased from 2 to 8 people. 8 Health Concerns 33% In 2011, the Fraser North Health Service Delivery Area found that 33% of seniors had perceived their health as fair to poor. 15% of seniors live on a low income 42% increase in the number of seniors 48% increase in seniors at risk of losing their homes 300% increase in seniors PWD on social housing wait lists 50% increase in seniors who could not speak English 41% increase in seniors who lived alone Lone Seniors Between 2001 - 2011, the number of seniors living alone increased from 365 to 515 seniors. Senior Newcomers 15 new immigrant seniors 1/4 senior households spend 30% or more of their income on housing. Between 2006 - 2011, this number increased from 210 to 310 seniors. Between 2001 - 2011, the seniors population increased from 1,480 to 2,100 seniors. 1/4 seniors live alone For all data source information, see data source sheet. First Languages Other Than English 28% of seniors In 2011, (95) German and (75) Punjabi were commonly the most do not speak English as their first language Population Housing and Income Health and Wellness Language Migration For more information, contact: Scott Graham sgraham@sparc.bc.ca www.sparc.bc.ca Aging Seniors In 2011, there were 10 people over the age of 100 in Delta. In 2011, 1,495 seniors lived on a low income. Seniors living alone had after-tax incomes of approximately $19,500 or less. Seniors living in couples had after-tax incomes of approximately $27,250 or less. First Languages Other Than English In 2011, Punjabi (1,440) and German (800) were the most commonly spoken languages among seniors other than English. 33% of seniors do not speak English as their first language Between 2000 - 2010, 335 new immigrant seniors settled in Delta. Non-English Speaking Between 2001- 2011, the number of seniors who could not speak English increased from 785 to 1,210 seniors. 8% of seniors cannot speak English Between 2009 - 2012, the number of seniors and persons with disabilities (PWD) on BC Housing’s social housing waitlist increased from 52 to 56 people. 56 Health Concerns 13% In 2011, the Fraser South Health Service Delivery Area found that 13% of seniors had perceived their health as fair to poor. 10% of seniors live on a low income 44% increase in the number of seniors 5% increase in seniors at risk of losing their homes 8% increase in seniors PWD on social housing wait lists 54% increase in seniors who could not speak English 17% increase in seniors who lived alone Lone Seniors Between 2001-2011, the number of seniors living alone increased from 2,510 to 2,935 seniors. Senior Newcomers 335 new immigrant seniors 1/5 senior households spend 30% or more of their income on housing. Between 2006 - 2011, this number increased from 1,560 to 1,640 seniors. Between 2001 - 2011, the seniors population increased from 10,760 to 15,455 seniors. 1/5 seniors live alone For data source information, see data source sheet. Aging Seniors Between 2001 - 2011, the number of people over the age of 100 increased from 10 to 30 seniors. Low Income First Languages other than English In 2011, Punjabi (365) and German (275) were the most commonly spoken languages among seniors. 35% of seniors do not speak English as their first language Between 2000 - 2010, 230 new immigrant seniors settled in New Westminster. Non-English Speaking Between 2001- 2011, the number of seniors who could not speak English increased from 325 to 575 seniors. 7% of seniors cannot speak English Between 2009 - 2012, the number of seniors and persons with disabilities (PWD) on BC Housing’s social housing waitlist increased from 203 to 240 people. 240 Health Concerns 33% In 2011, the Fraser North Health Service Delivery Area found that 33% of seniors had perceived their health as fair to poor. 14% increase in the number of seniors 24% increase in seniors at risk of losing their homes 18% increase in seniors PWD on social housing wait lists 77% increase in seniors who could not speak English 9% increase in seniors who lived alone Lone Seniors Between 2001-2011, the number of seniors living alone increased from 3,005 to 3,265 seniors. Senior Newcomers 230 new immigrant seniors 1/3 senior households spend 30% or more of their income on housing. Between 2006 - 2011, this number rose from 1,550 to 1,920 seniors. Between 2001 - 2011, the seniors population increased from 7,755 to 8,835 seniors. 2/5 seniors live alone 16% of seniors live on a low income In 2011, 1,350 seniors lived on a low income. Seniors living alone had after-tax incomes of approximately $19,500 or less. Seniors living in couples had after-tax incomes of approximately $27,250 or less. For data source information, see data source sheet.