SlideShare a Scribd company logo
1 of 10
FYTD 2004 Freight Analysis
 3.5%                                                                                                                    $6,000,000


 3.0%
                                                                                                                         $5,000,000


 2.5%
                                                                                                                         $4,000,000

 2.0%

                                                                                                                         $3,000,000

 1.5%

                                                                                                                         $2,000,000
 1.0%


                                                                                                                         $1,000,000
 0.5%


 0.0%                                                                                                                    $0
        Feb 04   Mar 04   Apr 04   May 04     Jun 04      Jul 04   Aug 04   Sep 04   Oct 04   Nov 04   Dec 04   Jan 05

                                            FT OUT as % of Revenue          Monthly Revenue

THIS CHART ILLUSTRATES TOTAL FEIGHT OUT AS % OF REVENUE.

FREIGHT OUT RANGES FROM 1.5% IN FEB TO 3.0%IN AUG DOWN TO 1.9% IN NOVEMBER.

WHILE THE IMPLICATION IS THAT FREIGHT OUT HAS DOUBLED, IT HAS NOT, AS ILLUSTRATED IN THE NEXT CHART.
FYTD 2004 Freight Analysis
 $1.20                                                                                                                   $6,000,000


 $1.00                                                                                                                   $5,000,000


 $0.80                                                                                                                   $4,000,000


 $0.60                                                                                                                   $3,000,000


 $0.40                                                                                                                   $2,000,000


 $0.20                                                                                                                   $1,000,000


 $0.00                                                                                                                   $0
         Feb 04   Mar 04   Apr 04   May 04   Jun 04      Jul 04   Aug 04   Sep 04   Oct 04    Nov 04   Dec 04   Jan 05

                                       FT OUT Dollars/Unit                  Monthly Revenue


AS ILLUSTRATED ABOVE, FREIGHT OUT, EXPRESSED AS $/UNIT, HAS NOT DOUBLED AS IMPLIED BY THE % OF
REVENUE CHART.

IN THIS CHART, FREIGHT OUT HAS INCREASED FROM $0.78/UNIT TO $0.91/UNIT.

THE INCREMENT IN FREIGHT OUT, AS % OF REVENUE AND $/UNIT IS INVESTIGATED IN THE FOLLOWING CHARTS.
DC Shipments Freight Analysis
 $6,000,000                                                                                                                    2.5%


 $5,000,000
                                                                                                                               2.0%


 $4,000,000
                                                                                                                               1.5%

 $3,000,000

                                                                                                                               1.0%
 $2,000,000


                                                                                                                               0.5%
 $1,000,000


        $0                                                                                                                     0.0%
              Feb 04   Mar 04   Apr 04   May 04   Jun 04       Jul 04   Aug 04   Sep 04   Oct 04   Nov 04    Dec 04   Jan 05

                                          DC Revenue Dollars                     DC FT OUT as % of Revenue


DISTRIBUTION CENTER SHIPMENTS ARE ILLUSTRATED ABOVE AS % OF REVENUE.

THE FREIGHT OUT IS FAIRLY CONSTANT BETWEEN 1.2% TO 1.5% AS % OF REVENUE.

CLEARLY, THE VARIABILITY IN COST IS DUE TO THE VARIABILITY IN VOLUME. THAT IS, AS VOLUME GOES DOWN,
FREIGHT COST GOES UP.
DC Shipments Freight Analysis
 $6,000,000                                                                                                                    $1.20


 $5,000,000                                                                                                                    $1.00


 $4,000,000                                                                                                                    $0.80


 $3,000,000                                                                                                                    $0.60


 $2,000,000                                                                                                                    $0.40


 $1,000,000                                                                                                                    $0.20


        $0                                                                                                                     $0.00
              Feb 04   Mar 04   Apr 04   May 04   Jun 04       Jul 04   Aug 04   Sep 04   Oct 04    Nov 04   Dec 04   Jan 05

                                          DC Revenue Dollars                        DC FT OUT Dollars/Unit


THIS CHART ILLUSTRATES FREIGHT OUT AS COST/UNIT. AS ILLUSTRATED, COST/UNIT HAS VARIED FROM $0.69
TO $1.05.

THE COST/UNIT DROPPED IN MARCH AND APRIL, ALONG WITH OUR VOLUME, THAT IS INDICATIVE OF THE
REDUCTION IN FREIGHT BY VIRTUE OF THE FAK 72 RATE.
Store Direct Shipments Freight Analysis
 $2,000,000                                                                                                                      10.0%

 $1,800,000                                                                                                                      9.0%

 $1,600,000                                                                                                                      8.0%

 $1,400,000                                                                                                                      7.0%

 $1,200,000                                                                                                                      6.0%

 $1,000,000                                                                                                                      5.0%

  $800,000                                                                                                                       4.0%

  $600,000                                                                                                                       3.0%

  $400,000                                                                                                                       2.0%

  $200,000                                                                                                                       1.0%

        $0                                                                                                                       0.0%
              Feb 04   Mar 04   Apr 04   May 04     Jun 04     Jul 04   Aug 04   Sep 04    Oct 04    Nov 04    Dec 04   Jan 05

                                     Store Direct Revenue Dollars            Store Direct FT OUT as % of Revenue


ITEMIZING THE STORE-DIRECT SHIPMENTS YIELDED VERY INTERSTING INFORMATION AS ILLUSTRATED ABOVE.

ON A % OF REVENUE, STORE DIRECT SHIPMENTS ARE VERY HIGH. FROM 6.5% IN FEBRUARY TO 9.0% IN JULY.

THE COST DROP IN SEPTEMBER IS A DIRECT RESULT OF INCREASED VOLUME.

STORE DIRECT SHIPMENTS ARE THE BIGGEST FACTOR IN FREIGHT OUT COSTS.
Store Direct Shipments Freight Analysis
 $2,000,000                                                                                                                             $1.40

 $1,800,000
                                                                                                                                        $1.20
 $1,600,000

 $1,400,000                                                                                                                             $1.00


 $1,200,000
                                                                                                                                        $0.80
 $1,000,000
                                                                                                                                        $0.60
  $800,000

  $600,000                                                                                                                              $0.40

  $400,000
                                                                                                                                        $0.20
  $200,000

        $0                                                                                                                              $0.00
              Feb 04   Mar 04   Apr 04     May 04     Jun 04     Jul 04   Aug 04   Sep 04     Oct 04     Nov 04       Dec 04   Jan 05

                                         Store Direct Revenue Dollars              Store Direct FT OUT Dollars/Unit


LOOKING AT STORE DIRECT SHIPMENTS AS COST/UNIT EVOKES THE SAME CONCLUSION.

THE COST/UNIT GOES FROM $1.11 IN FREB TO $1.33 IN AUG AND DOWN TO $0.79 IN NOV.

COMPARED TO DC SHIPMENTS, THE DIFFERENCES IN % OF REVENUE AND $/UNIT ARE SIGNIFICANT.
Store Direct vs DC Shipments
 10.0%                                                                                                                     $6,000,000

  9.0%
                                                                                                                           $5,000,000
  8.0%

  7.0%
                                                                                                                           $4,000,000
  6.0%

  5.0%                                                                                                                     $3,000,000

  4.0%
                                                                                                                           $2,000,000
  3.0%

  2.0%
                                                                                                                           $1,000,000
  1.0%

  0.0%                                                                                                                     $0
         Feb 04   Mar 04   Apr 04    May 04     Jun 04     Jul 04   Aug 04   Sep 04   Oct 04    Nov 04   Dec 04   Jan 05

                     Store Direct FT OUT as % of Revenue            DC FT OUT as % of Revenue            Monthly Revenue


WHEN COMPARED AGAINST STORE DIRECT SHIPMENTS, DC SHIPMENTS ARE VERY STABLE AND PREDICTABLE.

CLEARLY, THE PROBLEM IS IN THE STORE DIRECT SHIPMENTS AND THEIR SIGNIFICANT VARIABILITY.
Impact of Non-Ttoyz Store-Direct Shipments
    10,000                                                                                                                        $60,000

     9,000
                                                                                                                                  $50,000
     8,000

     7,000
                                                                                                                                  $40,000
     6,000

     5,000                                                                                                                        $30,000

     4,000
                                                                                                                                  $20,000
     3,000

     2,000
                                                                                                                                  $10,000
     1,000

        0                                                                                                                         $0
             Feb 04   Mar 04    Apr 04    May 04    Jun 04   Jul 04    Aug 04    Sep 04   Oct 04      Nov 04    Dec 04   Jan 05

                               Store Direct Non-Ttoyz             Store Direct Ttoyz               Store Direct FT OUT


FURTHER DRILL-DOWN INTO STORE DIRECT SHIPMENTS REVEAL THAT SIGNIFICANT VOLUMES OF NON-TTOYZ
ARE SHIPPED STORE DIRECT.
APPROX 80% OF THE NON-TTOYZ SHIPPED STORE DIRECT ARE EXTERNAL OPTICAL DRIVES.

ANOTHER FACTOR IS THE HIGH COST OF FREIGHT INCLUDE STAND-ALONE POWER SUPPLY SHIPMENTS.
AS EVIDENCED BY THE CHART ABOVE, NON-TTOYZ SHIPMENTS HAVE SIGNIFICANTLYINCREASED SINCE JULY
AND LITERALLY SKYROCKETED IN OCTOBER.
YTD Average Sales Price
 $90.00                                                                                                                 10.0%


 $80.00                                                                                                                 9.0%

                                                                                                                        8.0%
 $70.00

                                                                                                                        7.0%
 $60.00
                                                                                                                        6.0%
 $50.00
                                                                                                                        5.0%
 $40.00
                                                                                                                        4.0%
 $30.00
                                                                                                                        3.0%

 $20.00
                                                                                                                        2.0%

 $10.00                                                                                                                 1.0%

  $0.00                                                                                                                 0.0%
          Feb 04   Mar 04   Apr 04    May 04    Jun 04    Jul 04   Aug 04     Sep 04      Oct 04      Nov 04   Dec 04

                                Non-Ttoyz ASP                       Store Direct FT OUT as % of Rev


THIS CHART ILLUSTRATES THE IMPACT OF NON-TTOYZ ASP ON FREIGHT OUT AS A % OF REVENUE.
NON-TTOYZ ASP, FROM OPTICAL DRIVES, ETC., ADDS SIGNIFICANT VARIABILITY TO FREIGHT OUT.

NON-TOYZ AVERAGE NEARLY $59/UNIT WHILE TTOYZ AVERAGE NEARLY $13/UNIT.
THIS DISPARITY IN ASP HAS A DETRIMENTAL EFFECT ON TTOYZ FT OUT % DUE TO THE MUCH HIGHER ASP OF
NON-TTOYZ (OPTICAL SOTRAGE, GRAPHICS, ETC.). TTOYZ METRIC SHOULD BE ON A $/UNIT BASIS.
SUMMARY AND ACTION ITEMS

DC SHIPMENTS ARE IN LINE WITH ESTABLISHED METRIC(S).

STORE DIRECT SHIPMENTS ARE OUT OF METRIC AND ARE A SIGNIFICANT FACTOR IN FREIGHT OUT COSTS.

STORE DIRECT SHIPMENTS OF NON-TTOYZ ARE A SIGNIFICANT COST-ADDER TO THE FREIGHT OUT METRIC.

ACTION ITEMS

       STOP SHIPPING NON-TTOYZ STORE DIRECT.

       STOP SHIPPING NON-TTOYZ EXPRESS (3-DAY) STORE DIRECT (OBVIOUS).

       SHIP TTOYZ IN 10-PACKS TO LOWER FT COST/UNIT.

       GET CUSTOMER(S) TO ORDER POWER SUPPLIES WITH TTOYZ (UNDER THE SAME PO).

       CHANGE TTOYZ FT OUT METRIC FROM % OF REVENUE TO $/UNIT

More Related Content

What's hot

Nevada Association For Court Career Advancement Presentation Final
Nevada Association For Court Career Advancement Presentation FinalNevada Association For Court Career Advancement Presentation Final
Nevada Association For Court Career Advancement Presentation Finalintegreat
 
Circulation Revenue - The other Revenue Stream
Circulation Revenue - The other Revenue StreamCirculation Revenue - The other Revenue Stream
Circulation Revenue - The other Revenue StreamEdward Baral
 
TREB Condo network presentation
TREB Condo network presentationTREB Condo network presentation
TREB Condo network presentationBrent Reid
 
State of Lending Release Slideshow
State of Lending Release SlideshowState of Lending Release Slideshow
State of Lending Release SlideshowM William Sermons
 
Irs Audit Activity Am Best Conference 3 23 11 Forray
Irs Audit Activity Am Best Conference 3 23 11 ForrayIrs Audit Activity Am Best Conference 3 23 11 Forray
Irs Audit Activity Am Best Conference 3 23 11 ForraySusanJF
 
Budget Forecast Project
Budget Forecast ProjectBudget Forecast Project
Budget Forecast Projectdavisdemers
 
progress energy 4/3/08
progress energy 4/3/08progress energy 4/3/08
progress energy 4/3/08finance25
 
Loopnet Q4 2009 Insight Report 1 16 09
Loopnet Q4 2009 Insight Report 1 16 09Loopnet Q4 2009 Insight Report 1 16 09
Loopnet Q4 2009 Insight Report 1 16 09aporrazzo
 

What's hot (14)

Nevada Association For Court Career Advancement Presentation Final
Nevada Association For Court Career Advancement Presentation FinalNevada Association For Court Career Advancement Presentation Final
Nevada Association For Court Career Advancement Presentation Final
 
Circulation Revenue - The other Revenue Stream
Circulation Revenue - The other Revenue StreamCirculation Revenue - The other Revenue Stream
Circulation Revenue - The other Revenue Stream
 
Manufacturing Economic Update
Manufacturing Economic UpdateManufacturing Economic Update
Manufacturing Economic Update
 
Toronto Condo Network Presentation by Jason Mercer
Toronto Condo Network Presentation by Jason MercerToronto Condo Network Presentation by Jason Mercer
Toronto Condo Network Presentation by Jason Mercer
 
TREB Condo network presentation
TREB Condo network presentationTREB Condo network presentation
TREB Condo network presentation
 
Berrett-Koehler Publishers - New Book P&L
Berrett-Koehler Publishers - New Book P&LBerrett-Koehler Publishers - New Book P&L
Berrett-Koehler Publishers - New Book P&L
 
State of Lending Release Slideshow
State of Lending Release SlideshowState of Lending Release Slideshow
State of Lending Release Slideshow
 
Trends 2012 Houston Market Slides
Trends 2012 Houston Market SlidesTrends 2012 Houston Market Slides
Trends 2012 Houston Market Slides
 
Irs Audit Activity Am Best Conference 3 23 11 Forray
Irs Audit Activity Am Best Conference 3 23 11 ForrayIrs Audit Activity Am Best Conference 3 23 11 Forray
Irs Audit Activity Am Best Conference 3 23 11 Forray
 
Budget Forecast Project
Budget Forecast ProjectBudget Forecast Project
Budget Forecast Project
 
Bemis mar13brief
Bemis mar13briefBemis mar13brief
Bemis mar13brief
 
progress energy 4/3/08
progress energy 4/3/08progress energy 4/3/08
progress energy 4/3/08
 
MHK07/03/07
MHK07/03/07MHK07/03/07
MHK07/03/07
 
Loopnet Q4 2009 Insight Report 1 16 09
Loopnet Q4 2009 Insight Report 1 16 09Loopnet Q4 2009 Insight Report 1 16 09
Loopnet Q4 2009 Insight Report 1 16 09
 

Viewers also liked

Ipc Ww Op Costs Presentation
Ipc Ww Op Costs PresentationIpc Ww Op Costs Presentation
Ipc Ww Op Costs PresentationArmandoDQ
 
Connect2Field and Windows Azure
Connect2Field and Windows AzureConnect2Field and Windows Azure
Connect2Field and Windows AzureConnect2Field
 
Field Service Software for Plumbers
Field Service Software for PlumbersField Service Software for Plumbers
Field Service Software for PlumbersConnect2Field
 
Scheduling Software For IT Consultants
Scheduling Software For IT ConsultantsScheduling Software For IT Consultants
Scheduling Software For IT ConsultantsConnect2Field
 
Connect2Field An Inside View
Connect2Field An Inside ViewConnect2Field An Inside View
Connect2Field An Inside ViewConnect2Field
 
Field Service Software for Computer Repair Company's
Field Service Software for Computer Repair Company'sField Service Software for Computer Repair Company's
Field Service Software for Computer Repair Company'sConnect2Field
 
Scheduling Software For Roofing
Scheduling Software For RoofingScheduling Software For Roofing
Scheduling Software For RoofingConnect2Field
 
Field Service Software for Cleaning Companys
Field Service Software for Cleaning CompanysField Service Software for Cleaning Companys
Field Service Software for Cleaning CompanysConnect2Field
 
Production Schedule
Production ScheduleProduction Schedule
Production ScheduleArmandoDQ
 
The Social Capital Effects: Resources, Ties, and Digital Divides
The Social Capital Effects: Resources, Ties, and Digital DividesThe Social Capital Effects: Resources, Ties, and Digital Divides
The Social Capital Effects: Resources, Ties, and Digital DividesWenhong Chen
 
Growth or Decline: Stocks and Changes of Social Capital in the Internet Age
Growth or Decline: Stocks and Changes of Social Capital in the Internet AgeGrowth or Decline: Stocks and Changes of Social Capital in the Internet Age
Growth or Decline: Stocks and Changes of Social Capital in the Internet AgeWenhong Chen
 
The Social Capital Effects: Resources, Tie Strength, & Digital Divides
The Social Capital Effects: Resources, Tie Strength, & Digital Divides The Social Capital Effects: Resources, Tie Strength, & Digital Divides
The Social Capital Effects: Resources, Tie Strength, & Digital Divides Wenhong Chen
 

Viewers also liked (12)

Ipc Ww Op Costs Presentation
Ipc Ww Op Costs PresentationIpc Ww Op Costs Presentation
Ipc Ww Op Costs Presentation
 
Connect2Field and Windows Azure
Connect2Field and Windows AzureConnect2Field and Windows Azure
Connect2Field and Windows Azure
 
Field Service Software for Plumbers
Field Service Software for PlumbersField Service Software for Plumbers
Field Service Software for Plumbers
 
Scheduling Software For IT Consultants
Scheduling Software For IT ConsultantsScheduling Software For IT Consultants
Scheduling Software For IT Consultants
 
Connect2Field An Inside View
Connect2Field An Inside ViewConnect2Field An Inside View
Connect2Field An Inside View
 
Field Service Software for Computer Repair Company's
Field Service Software for Computer Repair Company'sField Service Software for Computer Repair Company's
Field Service Software for Computer Repair Company's
 
Scheduling Software For Roofing
Scheduling Software For RoofingScheduling Software For Roofing
Scheduling Software For Roofing
 
Field Service Software for Cleaning Companys
Field Service Software for Cleaning CompanysField Service Software for Cleaning Companys
Field Service Software for Cleaning Companys
 
Production Schedule
Production ScheduleProduction Schedule
Production Schedule
 
The Social Capital Effects: Resources, Ties, and Digital Divides
The Social Capital Effects: Resources, Ties, and Digital DividesThe Social Capital Effects: Resources, Ties, and Digital Divides
The Social Capital Effects: Resources, Ties, and Digital Divides
 
Growth or Decline: Stocks and Changes of Social Capital in the Internet Age
Growth or Decline: Stocks and Changes of Social Capital in the Internet AgeGrowth or Decline: Stocks and Changes of Social Capital in the Internet Age
Growth or Decline: Stocks and Changes of Social Capital in the Internet Age
 
The Social Capital Effects: Resources, Tie Strength, & Digital Divides
The Social Capital Effects: Resources, Tie Strength, & Digital Divides The Social Capital Effects: Resources, Tie Strength, & Digital Divides
The Social Capital Effects: Resources, Tie Strength, & Digital Divides
 

Similar to Freight Out Analyses

Public Relations Budget Template
Public Relations Budget Template Public Relations Budget Template
Public Relations Budget Template Demand Metric
 
monsanto 06_25_08
monsanto 06_25_08monsanto 06_25_08
monsanto 06_25_08finance28
 
.monsanto 06_25_08
.monsanto 06_25_08.monsanto 06_25_08
.monsanto 06_25_08finance28
 
Canada's VC Challenge - A statistical overview - August 2012
Canada's VC Challenge - A statistical overview - August 2012Canada's VC Challenge - A statistical overview - August 2012
Canada's VC Challenge - A statistical overview - August 2012heri
 
pitney bowes Monahan_2
pitney bowes  Monahan_2pitney bowes  Monahan_2
pitney bowes Monahan_2finance47
 
Yahoo Q2 2009 Earnings
Yahoo Q2 2009 EarningsYahoo Q2 2009 Earnings
Yahoo Q2 2009 EarningsDaniel Lu
 
Social Media Marketing Budget Template
Social Media Marketing Budget TemplateSocial Media Marketing Budget Template
Social Media Marketing Budget TemplateDemand Metric
 
Gold correction represents buying opportunity skyrocketing u s federal debt ...
Gold correction represents buying opportunity skyrocketing u s  federal debt ...Gold correction represents buying opportunity skyrocketing u s  federal debt ...
Gold correction represents buying opportunity skyrocketing u s federal debt ...Lucas Litwiniuk, CFA
 
Finalista Demo Day Startup Farm SP - 2a edição
Finalista Demo Day Startup Farm SP - 2a ediçãoFinalista Demo Day Startup Farm SP - 2a edição
Finalista Demo Day Startup Farm SP - 2a ediçãoStartup Farm
 
Analysis Coversheet Final
Analysis Coversheet FinalAnalysis Coversheet Final
Analysis Coversheet FinalJohn_Nuckel1
 
Real Food Happens Here
Real Food Happens HereReal Food Happens Here
Real Food Happens HereTodd Sweet
 
Marketing Communications Budget Template
Marketing Communications Budget TemplateMarketing Communications Budget Template
Marketing Communications Budget TemplateDemand Metric
 
plains all american pipeline Annual Reports2007
plains all american pipeline  Annual Reports2007 plains all american pipeline  Annual Reports2007
plains all american pipeline Annual Reports2007 finance13
 

Similar to Freight Out Analyses (20)

Public Relations Budget Template
Public Relations Budget Template Public Relations Budget Template
Public Relations Budget Template
 
AR2004
AR2004AR2004
AR2004
 
monsanto 06_25_08
monsanto 06_25_08monsanto 06_25_08
monsanto 06_25_08
 
.monsanto 06_25_08
.monsanto 06_25_08.monsanto 06_25_08
.monsanto 06_25_08
 
Canada's VC Challenge - A statistical overview - August 2012
Canada's VC Challenge - A statistical overview - August 2012Canada's VC Challenge - A statistical overview - August 2012
Canada's VC Challenge - A statistical overview - August 2012
 
pitney bowes Monahan_2
pitney bowes  Monahan_2pitney bowes  Monahan_2
pitney bowes Monahan_2
 
Yahoo Q2 2009 Earnings
Yahoo Q2 2009 EarningsYahoo Q2 2009 Earnings
Yahoo Q2 2009 Earnings
 
Social Media Marketing Budget Template
Social Media Marketing Budget TemplateSocial Media Marketing Budget Template
Social Media Marketing Budget Template
 
Gold correction represents buying opportunity skyrocketing u s federal debt ...
Gold correction represents buying opportunity skyrocketing u s  federal debt ...Gold correction represents buying opportunity skyrocketing u s  federal debt ...
Gold correction represents buying opportunity skyrocketing u s federal debt ...
 
Tvtp
TvtpTvtp
Tvtp
 
Tvtp
TvtpTvtp
Tvtp
 
Finalista Demo Day Startup Farm SP - 2a edição
Finalista Demo Day Startup Farm SP - 2a ediçãoFinalista Demo Day Startup Farm SP - 2a edição
Finalista Demo Day Startup Farm SP - 2a edição
 
Analysis Coversheet Final
Analysis Coversheet FinalAnalysis Coversheet Final
Analysis Coversheet Final
 
Real Food Happens Here
Real Food Happens HereReal Food Happens Here
Real Food Happens Here
 
Marketing Communications Budget Template
Marketing Communications Budget TemplateMarketing Communications Budget Template
Marketing Communications Budget Template
 
Car Net Business Plan
Car Net Business PlanCar Net Business Plan
Car Net Business Plan
 
State of Lending 2012 - Mortgages Overview
State of Lending 2012 - Mortgages OverviewState of Lending 2012 - Mortgages Overview
State of Lending 2012 - Mortgages Overview
 
Google Earnings Slides 2009 Q2
Google Earnings Slides 2009 Q2Google Earnings Slides 2009 Q2
Google Earnings Slides 2009 Q2
 
plains all american pipeline Annual Reports2007
plains all american pipeline  Annual Reports2007 plains all american pipeline  Annual Reports2007
plains all american pipeline Annual Reports2007
 
Open House Flyer 22700 Mulholland Dr
Open House Flyer  22700  Mulholland  DrOpen House Flyer  22700  Mulholland  Dr
Open House Flyer 22700 Mulholland Dr
 

Freight Out Analyses

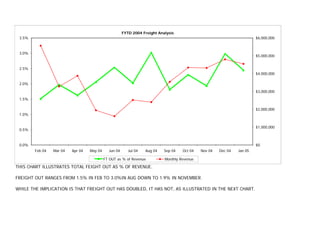
  • 1. FYTD 2004 Freight Analysis 3.5% $6,000,000 3.0% $5,000,000 2.5% $4,000,000 2.0% $3,000,000 1.5% $2,000,000 1.0% $1,000,000 0.5% 0.0% $0 Feb 04 Mar 04 Apr 04 May 04 Jun 04 Jul 04 Aug 04 Sep 04 Oct 04 Nov 04 Dec 04 Jan 05 FT OUT as % of Revenue Monthly Revenue THIS CHART ILLUSTRATES TOTAL FEIGHT OUT AS % OF REVENUE. FREIGHT OUT RANGES FROM 1.5% IN FEB TO 3.0%IN AUG DOWN TO 1.9% IN NOVEMBER. WHILE THE IMPLICATION IS THAT FREIGHT OUT HAS DOUBLED, IT HAS NOT, AS ILLUSTRATED IN THE NEXT CHART.
  • 2. FYTD 2004 Freight Analysis $1.20 $6,000,000 $1.00 $5,000,000 $0.80 $4,000,000 $0.60 $3,000,000 $0.40 $2,000,000 $0.20 $1,000,000 $0.00 $0 Feb 04 Mar 04 Apr 04 May 04 Jun 04 Jul 04 Aug 04 Sep 04 Oct 04 Nov 04 Dec 04 Jan 05 FT OUT Dollars/Unit Monthly Revenue AS ILLUSTRATED ABOVE, FREIGHT OUT, EXPRESSED AS $/UNIT, HAS NOT DOUBLED AS IMPLIED BY THE % OF REVENUE CHART. IN THIS CHART, FREIGHT OUT HAS INCREASED FROM $0.78/UNIT TO $0.91/UNIT. THE INCREMENT IN FREIGHT OUT, AS % OF REVENUE AND $/UNIT IS INVESTIGATED IN THE FOLLOWING CHARTS.
  • 3. DC Shipments Freight Analysis $6,000,000 2.5% $5,000,000 2.0% $4,000,000 1.5% $3,000,000 1.0% $2,000,000 0.5% $1,000,000 $0 0.0% Feb 04 Mar 04 Apr 04 May 04 Jun 04 Jul 04 Aug 04 Sep 04 Oct 04 Nov 04 Dec 04 Jan 05 DC Revenue Dollars DC FT OUT as % of Revenue DISTRIBUTION CENTER SHIPMENTS ARE ILLUSTRATED ABOVE AS % OF REVENUE. THE FREIGHT OUT IS FAIRLY CONSTANT BETWEEN 1.2% TO 1.5% AS % OF REVENUE. CLEARLY, THE VARIABILITY IN COST IS DUE TO THE VARIABILITY IN VOLUME. THAT IS, AS VOLUME GOES DOWN, FREIGHT COST GOES UP.
  • 4. DC Shipments Freight Analysis $6,000,000 $1.20 $5,000,000 $1.00 $4,000,000 $0.80 $3,000,000 $0.60 $2,000,000 $0.40 $1,000,000 $0.20 $0 $0.00 Feb 04 Mar 04 Apr 04 May 04 Jun 04 Jul 04 Aug 04 Sep 04 Oct 04 Nov 04 Dec 04 Jan 05 DC Revenue Dollars DC FT OUT Dollars/Unit THIS CHART ILLUSTRATES FREIGHT OUT AS COST/UNIT. AS ILLUSTRATED, COST/UNIT HAS VARIED FROM $0.69 TO $1.05. THE COST/UNIT DROPPED IN MARCH AND APRIL, ALONG WITH OUR VOLUME, THAT IS INDICATIVE OF THE REDUCTION IN FREIGHT BY VIRTUE OF THE FAK 72 RATE.
  • 5. Store Direct Shipments Freight Analysis $2,000,000 10.0% $1,800,000 9.0% $1,600,000 8.0% $1,400,000 7.0% $1,200,000 6.0% $1,000,000 5.0% $800,000 4.0% $600,000 3.0% $400,000 2.0% $200,000 1.0% $0 0.0% Feb 04 Mar 04 Apr 04 May 04 Jun 04 Jul 04 Aug 04 Sep 04 Oct 04 Nov 04 Dec 04 Jan 05 Store Direct Revenue Dollars Store Direct FT OUT as % of Revenue ITEMIZING THE STORE-DIRECT SHIPMENTS YIELDED VERY INTERSTING INFORMATION AS ILLUSTRATED ABOVE. ON A % OF REVENUE, STORE DIRECT SHIPMENTS ARE VERY HIGH. FROM 6.5% IN FEBRUARY TO 9.0% IN JULY. THE COST DROP IN SEPTEMBER IS A DIRECT RESULT OF INCREASED VOLUME. STORE DIRECT SHIPMENTS ARE THE BIGGEST FACTOR IN FREIGHT OUT COSTS.
  • 6. Store Direct Shipments Freight Analysis $2,000,000 $1.40 $1,800,000 $1.20 $1,600,000 $1,400,000 $1.00 $1,200,000 $0.80 $1,000,000 $0.60 $800,000 $600,000 $0.40 $400,000 $0.20 $200,000 $0 $0.00 Feb 04 Mar 04 Apr 04 May 04 Jun 04 Jul 04 Aug 04 Sep 04 Oct 04 Nov 04 Dec 04 Jan 05 Store Direct Revenue Dollars Store Direct FT OUT Dollars/Unit LOOKING AT STORE DIRECT SHIPMENTS AS COST/UNIT EVOKES THE SAME CONCLUSION. THE COST/UNIT GOES FROM $1.11 IN FREB TO $1.33 IN AUG AND DOWN TO $0.79 IN NOV. COMPARED TO DC SHIPMENTS, THE DIFFERENCES IN % OF REVENUE AND $/UNIT ARE SIGNIFICANT.
  • 7. Store Direct vs DC Shipments 10.0% $6,000,000 9.0% $5,000,000 8.0% 7.0% $4,000,000 6.0% 5.0% $3,000,000 4.0% $2,000,000 3.0% 2.0% $1,000,000 1.0% 0.0% $0 Feb 04 Mar 04 Apr 04 May 04 Jun 04 Jul 04 Aug 04 Sep 04 Oct 04 Nov 04 Dec 04 Jan 05 Store Direct FT OUT as % of Revenue DC FT OUT as % of Revenue Monthly Revenue WHEN COMPARED AGAINST STORE DIRECT SHIPMENTS, DC SHIPMENTS ARE VERY STABLE AND PREDICTABLE. CLEARLY, THE PROBLEM IS IN THE STORE DIRECT SHIPMENTS AND THEIR SIGNIFICANT VARIABILITY.
  • 8. Impact of Non-Ttoyz Store-Direct Shipments 10,000 $60,000 9,000 $50,000 8,000 7,000 $40,000 6,000 5,000 $30,000 4,000 $20,000 3,000 2,000 $10,000 1,000 0 $0 Feb 04 Mar 04 Apr 04 May 04 Jun 04 Jul 04 Aug 04 Sep 04 Oct 04 Nov 04 Dec 04 Jan 05 Store Direct Non-Ttoyz Store Direct Ttoyz Store Direct FT OUT FURTHER DRILL-DOWN INTO STORE DIRECT SHIPMENTS REVEAL THAT SIGNIFICANT VOLUMES OF NON-TTOYZ ARE SHIPPED STORE DIRECT. APPROX 80% OF THE NON-TTOYZ SHIPPED STORE DIRECT ARE EXTERNAL OPTICAL DRIVES. ANOTHER FACTOR IS THE HIGH COST OF FREIGHT INCLUDE STAND-ALONE POWER SUPPLY SHIPMENTS. AS EVIDENCED BY THE CHART ABOVE, NON-TTOYZ SHIPMENTS HAVE SIGNIFICANTLYINCREASED SINCE JULY AND LITERALLY SKYROCKETED IN OCTOBER.
  • 9. YTD Average Sales Price $90.00 10.0% $80.00 9.0% 8.0% $70.00 7.0% $60.00 6.0% $50.00 5.0% $40.00 4.0% $30.00 3.0% $20.00 2.0% $10.00 1.0% $0.00 0.0% Feb 04 Mar 04 Apr 04 May 04 Jun 04 Jul 04 Aug 04 Sep 04 Oct 04 Nov 04 Dec 04 Non-Ttoyz ASP Store Direct FT OUT as % of Rev THIS CHART ILLUSTRATES THE IMPACT OF NON-TTOYZ ASP ON FREIGHT OUT AS A % OF REVENUE. NON-TTOYZ ASP, FROM OPTICAL DRIVES, ETC., ADDS SIGNIFICANT VARIABILITY TO FREIGHT OUT. NON-TOYZ AVERAGE NEARLY $59/UNIT WHILE TTOYZ AVERAGE NEARLY $13/UNIT. THIS DISPARITY IN ASP HAS A DETRIMENTAL EFFECT ON TTOYZ FT OUT % DUE TO THE MUCH HIGHER ASP OF NON-TTOYZ (OPTICAL SOTRAGE, GRAPHICS, ETC.). TTOYZ METRIC SHOULD BE ON A $/UNIT BASIS.
  • 10. SUMMARY AND ACTION ITEMS DC SHIPMENTS ARE IN LINE WITH ESTABLISHED METRIC(S). STORE DIRECT SHIPMENTS ARE OUT OF METRIC AND ARE A SIGNIFICANT FACTOR IN FREIGHT OUT COSTS. STORE DIRECT SHIPMENTS OF NON-TTOYZ ARE A SIGNIFICANT COST-ADDER TO THE FREIGHT OUT METRIC. ACTION ITEMS STOP SHIPPING NON-TTOYZ STORE DIRECT. STOP SHIPPING NON-TTOYZ EXPRESS (3-DAY) STORE DIRECT (OBVIOUS). SHIP TTOYZ IN 10-PACKS TO LOWER FT COST/UNIT. GET CUSTOMER(S) TO ORDER POWER SUPPLIES WITH TTOYZ (UNDER THE SAME PO). CHANGE TTOYZ FT OUT METRIC FROM % OF REVENUE TO $/UNIT