Ernest: Efficient Performance Prediction for Advanced Analytics on Apache Spa...
CaseStudy_MonteCarloAnalysis
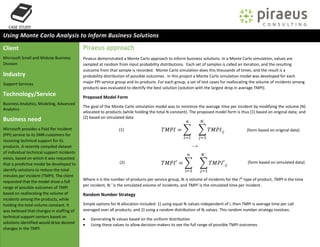
1. Piraeus approach
Piraeus demonstrated a Monte Carlo approach to inform business solutions. In a Monte Carlo simulation, values are
sampled at random from input probability distributions. Each set of samples is called an iteration, and the resulting
outcome from that sample is recorded. Monte Carlo simulation does this thousands of times, and the result is a
probability distribution of possible outcomes. In this project a Monte Carlo simulation model was developed for each
major PPI service group and its products. For each group, a set of test cases for reallocating the volume of incidents among
products was evaluated to identify the best solution (solution with the largest drop in average TMPI).
Proposed Model Form
The goal of the Monte Carlo simulation model was to minimize the average time per incident by modifying the volume (N)
allocated to products (while holding the total N constant). The proposed model form is thus (1) based on original data; and
(2) based on simulated data
Where n is the number of products per service group, Ni is volume of incidents for the ith
type of product, TMPI is the time
per incident, Ni ′ is the simulated volume of incidents, and TMPI′ is the simulated time per incident.
Random Number Strategy
Simple options for N allocation included: 1) using equal Ni values independent of i, then TMPI is average time per call
averaged over all products; and 2) using a random distribution of Ni values. This random number strategy involves:
Generating Ni values based on the uniform distribution
Using these values to allow decision-makers to see the full range of possible TMPI outcomes
Client
Microsoft Small and Midsize Business
Division
Industry
Support Services
Technology/Service
Business Analytics, Modeling, Advanced
Analytics
Business need
Microsoft provides a Paid Per Incident
(PPI) service to its SMB customers for
receiving technical support for its
products. A recently compiled dataset
of individual technical support incidents
exists, based on which it was requested
that a predictive model be developed to
identify solutions to reduce the total
minutes per incident (TMPI). The client
requested that the model show a full
range of possible outcomes of TMPI
based on reallocating the volume of
incidents among the products, while
holding the total volume constant. It
was believed that changes in staffing of
technical support centers based on
solutions identified would drive desired
changes in the TMPI.
CASE STUDY
Using Monte Carlo Analysis to Inform Business Solutions
(form based on original data)
(form based on simulated data)
(1)
(2)
--->
2. Continuing to create randomly-generated solutions while keeping track of the best ones
A demonstration of the method showed the impacts on total TMPI of 5 test cases of randomly-generated N values per major PPI service group.
Simulation Model Details
Using the model, the distribution of total TMPI was simulated for each set of randomly-generated N values. The average TMPI of each distribution was compared to
the average recently measured (or current) TMPI. The TMPI for each product was simulated based on the lognormal distribution using the mean and standard
deviation of the log-transformed data for each product. This is because the observed behavior of TMPI is log-normally distributed. The simulation was run 10,000
times. R code was used to execute the model.
Results
A Monte Carlo simulation model was successfully demonstrated
Cumulative probability distributions of the different scenarios for allocating Nwere produced for
the major service groups
The best solution for reallocating N (solution with largest drop in average TMPI) was identified
among the set of random number test cases for each major service group
Impact
While holding total N constant, reallocating Nvalues to products using randomly-generated
values can provide solutions that reduce TMPI
Test cases produced average TMPI decreases typical of a few percent to as much as 20%
Based on model predictions, decisions could be made about how to staff technical support
centers that would drive desired changes in the TMPI
Future work would include automating the random number generation model component to
allow for the creation of a full range of solutions
Example results of the model showing
simulated cumulative distributions of Total
TMPI for current, equal, and test cases of
randomly-generated N values. This suggests
that test case 1 of randomly-generated N
values is predicted to lead to the largest
decrease in total TMPI compared to current
N values.