1. Journal of Marketing Management
Vol. 26, Nos. 1–2, February 2010, 146–162
Measuring consumer vulnerability to perceived
product-similarity problems and its consequences
Gianfranco Walsh, University of Koblenz-Landau, Germany
Vincent-Wayne Mitchell, CASS Business School, UK
Thomas Kilian, University of Koblenz-Landau, Germany
Lindsay Miller, University of Strathclyde, UK
Abstract The brand clutter in many product categories and increasing numbers of
similar products, some of which are deliberate look-alikes, make it more difficult
for consumers to distinguish between brands, which can lead to more mistaken
and misinformed purchases. Moreover, increasing brand similarity is likely to
influence important consumer outcomes. To examine this phenomenon, a
perceived product-similarity scale developed in Germany was administered to
220 consumers in the United Kingdom. Following the formulation of testable
hypotheses and assessments of the scale’s reliability and validity, the scale was
used to measure perceived product similarity (PPS) across three different
product categories, while examining the impact of PPS on brand loyalty and
word of mouth. Structural equation modelling revealed that PPS significantly
affects word of mouth but not brand loyalty. In addition, cluster analysis
identified three meaningful and distinct PPS groups. Implications for marketing
managers, consumer policy makers, and marketing research are discussed.
Keywords cognitive vulnerability; perceived product similarity; structural
equation modelling
Introduction
Following Levitt’s (1966) portentous comment that most of what we see as new in the
US marketplace is not new at all but rather ‘innovative imitation’, the past few decades
have seen major European retailers beginning to feature private-label packages that
look very much like national brands (ACNielsen, 2001; Kapferer, 1995a, 1995b;
PLMA International, 2002). In terms of share, private labels in the UK have gained
28% of the market, making the UK the third biggest market for private labels
worldwide. This means that UK consumers have private labels in their shopping
baskets on 82% of their shopping trips (ACNielsen, 2005). Usually, these pioneer
and follower brands show a high degree of brand similarity and overall sameness
between the two brands (Kamins&Alpert, 1997;Walsh&Mitchell, 2005).Walsh and
ISSN 0267-257X print/ISSN 1472-1376 online
# 2010 Westburn Publishers Ltd.
DOI:10.1080/02672570903441439
http://www.informaworld.com
2. Walsh et al. Measuring consumer vulnerability to perceived product-similarity problems 147
Mitchell (2005, p. 143) define this perceived product similarity (PPS) as ‘the
consumer’s self-rated propensity to see products within the same category as similar’.
This tendency to perceive products as similar can result from four scenarios: (1) the
pioneer manufacturer brand is emulated by a retailer brand; (2) the pioneer
manufacturer brand is emulated by another manufacturer brand; (3) the pioneer
retailer brand is emulated by a manufacturer brand; (4) the pioneer retailer brand is
emulated by another retailer. From a consumer standpoint, all emulations can cause a
problem if consumers are not vigilant and have an orientation to see all brands as
similar. In these contexts, consumers often believe they are already familiar with the
emulator brand and able to assess it with regard to its attributes and quality and are
thus vulnerable to making mistakes (e.g. Loken, Ross, & Hinckle, 1986; Warlop &
Alba, 2004).Walsh and Mitchell (2005, p. 143) argue ‘that when consumers think that
all or many products are similar within a category, this can result in mistaken
purchases, product misuse, product misunderstanding or misattribution of various
product attributes which result in a non-maximisation of utility and consumer
vulnerability’. The ability to discriminate between brands has recently been
discussed as an aspect of consumers’ ‘cognitive vulnerability’, which Walsh and
Mitchell (2005) conceptualise as the consumer’s own cognitive limitations to
effectively execute a marketing exchange (see also Brenkert, 1998). They developed
and tested a PPS scale that could point a new direction in consumer vulnerability
research. This study furthers their work and aims to make three contributions.
First,Walsh and Mitchell (2005) acknowledge that the scale’s generalisability needs
to be tested further by administering it to different populations in other countries in
accordance with Hunter’s (2001) call for more replication studies in consumer-behaviour
research. As a result, this study tests the PPS scale on a sample of 220
British consumers to see if the psychometric properties of the PPS scale
(i.e. dimensionality and reliability) vary between samples. In addition, we extend
their study by drawing on the consumer-behaviour literature to hypothesise how PPS
is related to the relevant consumer-behaviour related constructs of brand loyalty and
word of mouth, which help to establish the scale’s nomological validity. Loyalty and
word of mouth have been reported to be important correlates of perceived similarity
confusion (e.g. Foxman, Berger,&Cote, 1992; Turnbull, Leek,&Ying, 2000) and are
considered two of the most important marketing outcomes (Hennig-Thurau, Gwinner,
& Gremler, 2002). Indeed, loyalty has become the key component measured by most
companies (Ambler, 2003), while word of mouth continues to be pursued as one of the
key promotional variables because of its influence on customers’ decision making
(Kumar, Petersen & Leone, 2007).
Second, previous research suggests that consumers’ likelihood of perceiving
products as similar varies with the importance of the purchase and the care with
which they evaluate product alternatives (e.g. Howard, Kerin, & Gengler, 2000).
Prior studies on PPS have concentrated on either similarity between different brands
of the same product or product categories of the same general importance level
(e.g. Balabanis & Craven, 1997), and have not considered how the importance of
the purchasemay affect the ability to distinguish between products. In addition, extant
empirical research has tended to focus on low-involvement products, such as soft
drinks, ketchup, washing-up liquid, and rice (e.g. Kapferer, 1995a, 1995b; Lomax,
Sherski, & Todd, 1999). Although Walsh and Mitchell (2005) propose that the scale
will be valid in all product categories, they did not examine this assumption in their
research. The present study examines this assumption by encompassing three product
categories representing high- and low-importance products.
3. 148 Journal of Marketing Management, Volume 26
Third, some consumers may be more vulnerable to perceiving products as similar
due to personal characteristics such as age, gender, education, race, and physical and
mental health (Andreasen, 1993), and previous vulnerability research has focused on
factors such as age (e.g. Benet, Pitts, & LaTour, 1993; Langenderfer & Shimp, 2001)
and consumers’ limited economic power (e.g. Andreasen, 1993; Goodin, 1985; Hill,
2002). This raises the question of whether segments of consumers exist that differ in
regards to how vulnerable they are to perceiving products as similar.
This study therefore attempts to contribute to the literature on consumer cognitive
vulnerability by replicating and extending the study by Walsh and Mitchell (2005) in
the UK. In doing so, we discuss how such a scale would be useful for marketing
managers and consumer policy makers to identify how widespread the perceived
product-similarity problem is and those consumers who are prone to it.
Background and hypotheses
PPS and its relation to consumer outcomes
Previous research suggests that consumers experience higher levels of perceived risk
when buying retailer own-label brands than with manufacturer-branded products
(Broadbridge & Morgan, 2001), and that as perceived risk increases, the preference
for branded products increases (e.g. Cunningham, 1956). It can be argued that when
consumers who are PPS prone see a look-alike brand, they will not automatically
perceive higher risk simply because they see the brands as similar. If they see no greater
risk, then they will see no reason to be loyal towards the manufacturer brand as a risk-reducing
strategy. Moreover, when consumers buy retailer brands, their perceived risk
might actually be low because of an increased quality of retailers’ own brands and their
competitive prices (Burt, 1992), which again will not motivate brand loyalty to the
manufacturer brands. Other research suggests that consumers’ attitude towards
private-label brands is negatively correlated with brand loyalty (Burton,
Lichtenstein, Netemeyer, & Garretson, 1998). A reason for this could be that not
knowing which alternative is preferred, while not being certain that one wants them
equally, may result in indecision and a tendency to avoid commitment (Dhar, 1997).
This appears a logical approach, because when consumers are unable to differentiate
products there is little reason, other than habit, for them to become brand loyal.
Therefore we propose:
H1: As PPS proneness increases, brand loyalty decreases.
Drawing on attribution theory, PPS-prone consumers may be as likely to seek as they
are to give word ofmouth. Attribution theory suggests that consumers assign causality to
an outside factor (i.e. external attribution) or they assign causality to an inside factor
(i.e. internal attribution) (Folkes, 1984; Heider, 1958). A PPS-prone consumerwill either
attribute her proneness to herself or to firms that sell similar brands. We argue that,
depending on the attribution, the PPS-prone consumers will seek (internal attribution) or
give (external attribution) word of mouth. Consumers who are prone to PPS are more
likely to have negative consumption experiences, which lead to dissatisfaction and
a desire to share their dissatisfying experiences with others. Although nowadays the
differences between manufacturer and retailer brands in terms of quality are fewer
(e.g. Jary & Wileman, 1998), when consumers buy the wrong brand, they will suffer
4. Walsh et al. Measuring consumer vulnerability to perceived product-similarity problems 149
forgone utility because they do not get the brand they had a satisfactory prior
consumption experience with. In order to avoid buying the wrong brand, PPS-prone
consumers aremore likely to engage in strategies that prevent this, such as to askothers to
help them or for their experiences (i.e. seeking word of mouth). In the case of external
attribution, the consumer will feel it is the marketplace’s fault that PPS occurs and
therefore will want to warn others. Buying the wrong brand could also motivate
consumers to want to warn others (i.e. giving word of mouth). This line of reasoning is
in agreement with the word-of-mouth literature. Sundaram,Mitra, and Webster (1998)
identified eight motives of word of mouth, four of which refer to positive (‘altruism’,
‘product involvement’, ‘self-enhancement’, ‘helping the company’) and four to negative
word of mouth (‘altruism’, ‘anxiety reduction’, ‘vengeance’, ‘advice seeking’).Consistent
with attribution theory, we believe that PPS-prone consumers engage in positive and
negative word of mouth to essentially help others (‘altruism’) and to make more-informed
choices (‘advice seeking’). Hence:
H2: As PPS proneness increases, word of mouth increases.
Product importance, involvement, and PPS
The importance of products and the consequent consumer involvement has been well
researched in previous years (e.g. Bloch & Richins, 1983; Rothschild, 1984;
Zaichkowsky, 1985), and it is generally suggested that perceived risk is positively
correlated with product involvement, which results in consumers being more
vigilant (Bloch & Richins, 1983). Walsh and Mitchell (2005) argue that when
consumers see products as more important, this added vigilance can give protection
against PPS because involved consumers may be better at recognising the differences
between brands. Consumers who have high involvement with a product class are
expected to possess a fuller knowledge base of the brands in the product category
and are therefore less likely to experience PPS from those brands that are imitators
(Foxman et al., 1992). However, high-involvement product categories tend to be very
competitive, and manufacturers tend to emphasise and communicate a large number
of product attributes and benefits, exposing the consumer to a large number of
potentially similar messages and products. More-complex products are seen to be
those products that have many attributes and numerous attribute levels such as colour
and size (Huffman & Kahn, 1998). For example, mobile phones, which come with
numerous services and different technology devices, are typically considered a high-involvement
product. When faced with overwhelming amounts of information to
process, consumers can often switch off and begin to simplify the decision and not
process all the brand-difference information. Therefore, even consumers in high-involvement
categories may be more prone to PPS because they cannot process or
understand all the relevant information. In contrast, for low-involvement goods with
lower prices that tend to be quickly purchased products, there is generally less
information to process and consumers can appreciate the fewer differences in these
less-complicated goods more easily. Thus, they can discriminate between brands more
easily. Even though they may devote less time, the features are fewer and much less
complicated. Given these considerations we hypothesise that:
H3: Consumers’ PPS scores will be higher for high-, and lower for low-involvement
products.
5. 150 Journal of Marketing Management, Volume 26
Method
The questionnaire
The questionnaire used in this study contained 10 PPS items (Walsh & Mitchell,
2005) as well as items measuring two constructs posited to be related to PPS,
namely consumers’ brand loyalty and word of mouth. Subjects rated most items
on a five-point scale (1 ¼ strongly disagree, 5 ¼ strongly agree). The two related
variables were operationalised with three (brand loyalty) and five (word of
mouth) items, respectively. The brand-loyalty measure was adapted from
Sproles and Kendall (1986), and word of mouth was measured with a five-item
measure from Feick and Price (1987).
The questionnaire was pre-tested to detect problematic items and ensure
reliability. Eleven respondents, students and non-students, completed the
questionnaire. One researcher was present at each pilot test to take note of any
problems that may have occurred from any of the questions. The general
feedback on the questionnaire was positive, being completed in just over 10
minutes. One research aim was to assess if consumers’ PPS score differed
amongst low- to high-involvement products. Accordingly, prior to the data
collection, 10 marketing students were asked to group 25 different products as
either ‘low-involvement product’, ‘moderate-involvement product’, or ‘high-involvement
product’. Three products (chocolate bars, beauty products, and
mobile telephones) were classified most consistently by the subjects and were
hence chosen for the survey. Respondents completing the questionnaire in this
research had to have the purchasing of one of these three products in mind,
namely chocolate bars (low involvement), beauty products (moderate
involvement), or mobile (cellular) telephones (high-involvement product).
The sample
To assess the reliability and validity of the PPS scale, a survey was carried out in
two major UK cities, using a qualified convenience sample of male and female
and different-aged consumers. The questionnaire was distributed by marketing
students from a major northern UK university. Students majoring in marketing
were instructed to recruit four people to fill out the survey. Three of the four
people had to be non-students and represent a range of ages, genders, and
professions. The data collection process lasted two weeks. A total of 220
people answered the questionnaire, representing approximately a 40% response
rate of those individuals asked to respond. A sample size of 220 was deemed
sufficient and is consistent with Bryant and Yarnold’s (1995) recommendation
that the subjects-to-variables ratio should be no lower than five. Appendix 1
provides a description of the sample characteristics.
Before completing the questionnaire, respondents were instructed to have the
purchasing of one of three products in mind, namely chocolate bars, beauty
products, or mobile (cellular) telephones. These products represent product
categories that are usually bought with low, moderate, and high levels of
involvement. Respondents were asked to choose the most recently purchased
product. Most respondents chose chocolate bars (36%), followed by cellular phones
(33%), and beauty products (31%).
6. Walsh et al. Measuring consumer vulnerability to perceived product-similarity problems 151
Results
Analysis
Walsh and Mitchell (2005) initially proposed a 10-item scale with reasonable
reliability (see column 1, Table 1). However, further validation procedures led to a
more parsimonious six-item scale. In this study, both the 10- and 6-item version of the
PPS scale were tested. The 10-item scale was subjected to a confirmatory factor
analysis (maximum likelihood technique). The overall fit was acceptable and most
fit indices met the recommended thresholds. The Goodness of Fit Statistics were:
GFI ¼ .93, AGFI ¼ .90, CFI ¼ .90, NNFI ¼ .88, RMSEA ¼ .08, and w2/df ¼ 2.19 (p <
.000). However, the average variance explained was well below the threshold of .50
Table 1 Summary results of confirmatory factor analyses.
Coefficient of
determination (from
Walsh & Mitchell, 2005)
Coefficient of
determination
(from CFA )
AVE ¼ .56 A ¼ .73
AVE ¼ .57 ¼ .80 –
eight-item PPS
scale
1 Sometimes I want to buy a product seen
in an advertisement, but I can’t clearly
identify it in the store among the
variety of similar products.
.58 .64
2 Most brands are very similar, making it
difficult to distinguish them.
.69 .69
3 After watching a series of commercials
on TV, it often happens that I cannot
remember the brand but only the
product.
.57 .43
4 Some brands look so similar that I don’t
know if they are made by the same
manufacturer.
.49 .58
5 Because of the great similarity of
brands, it is difficult to detect
differences.
.56 .73
6 Because of the great similarity of
brands, it is often difficult to detect
new products.
.47 .56
7 Inside a store I immediately recognize my
favourite brands.
.28 .44
8 Brands are unmistakable. .33 .50
9 One knows that when brands are similar,
the more expensive one is better.
.31 *
10 After watching a series of commercials on
TV, it often happens that I cannot
remember the product (category) but
only the brand.
.30 *
AVE ¼ Average Variance Extracted. Items that appear in italics were part of Walsh and Mitchell’s (2005)
10-item PPS scale but not the more parsimonious six-item scale.
7. 152 Journal of Marketing Management, Volume 26
(Bagozzi & Yi, 1988). Two indicators had coefficients of determination below .35
(Bagozzi & Yi, 1988), which led to their elimination from the scale. The starred items
in Table 1 are the two deleted items from the scale. Following this, another
confirmatory factor analysis was calculated for the remaining eight items, and model
identification was achieved. This eight-item scale included all six items from Walsh
and Mitchell’s (2005) final PPS scale. The fit of the model (eight-item scale) was
satisfying, and all but two indicators had a coefficient of determination equal to or
larger than .50. The average variance explained exceeds the threshold of .50 and the
Goodness of Fit Statistics were: GFI¼.95, AGFI¼.91, CFI¼.94, NFI¼.90, RMSEA
¼ .07, and w2/df ¼ 2.36 (p < .001). The results of the confirmatory factor analysis are
summarised in column 2, Table 1. The Cronbach alpha of the eight-item scale was .80.
A confirmatory factor analysis for the six-item model (Walsh and Mitchell’s final
scale), which is not reported here, resulted in a good overall fit. The Cronbach alpha
for the six-item PPS scale proposed byWalsh and Mitchell (2005) was also calculated
and was .78.
Nomological validity of the PPS scale
To establish nomological validity and to test the first two hypotheses, we examined
the impact of the PPS scale on consumer brand loyalty and general word-of-mouth
propensity. These measures have been postulated to be an outcome and correlate
of PPS (Walsh & Mitchell, 2005). To show a measure has nomological validity, the
correlation between the measure and other related constructs should behave as
expected in theory (Churchill, 1995). We hypothesised that consumers who are
prone to PPS are likely to become less brand loyal and more likely to engage in
word of mouth. PPS-prone consumers are likely to share their mistaken
experiences with others, as well as asking others for advice prior to purchasing.
Hence, a positive PPS–word-of-mouth relationship can be expected. Items for the
two outcome measures were based on prior items in the literature, as noted in
Appendix 2.
Two separate confirmatory factor analyses were performed to test the
appropriateness of the items measuring the two constructs. The overall fit for the
brand loyalty model was very good. The average variance extracted exceeds the
threshold of .50 and the Goodness of Fit Statistics were: GFI¼.99, AGFI ¼ .97, CFI
¼ .99, NFI ¼ .99, RMR ¼ .044, RMSEA ¼ .056, and w2/df ¼ 1.68 (p < .027). The
Cronbach alpha of the three-item scale was .76. The overall fit for the word-of-mouth
model was sound. The average variance explained exceeds the threshold of .50 and the
Goodness of Fit Statistics were: GFI¼.98, AGFI¼.92, CFI¼.98, NFI¼.98, RMSEA
¼ .09, and w2/df ¼ 3.07 (p < .027). The RMSEA value is a little too high. Browne and
Cudeck (1993) suggest RMSEA <.05 as close fit and values beyond .10 as poor. The
Cronbach alpha of the eight-item scale was .87.
The examination of the hypothesised relationships between PPS and the two
consumer outcomes was tested simultaneously with AMOS 6.0. The global fit
statistics indicated that the model represents the data well, with GFI ¼ .91, AGFI ¼
.87, RMR ¼ .08, RMSEA ¼ .06, CFI ¼ .94, and w2/df ¼ 1.84. PPS had the predicted
negative impact on brand loyalty. However, the path is not significant, leading to a
rejection of H1. The PPS word-of-mouth relationship is positive and strong,
supporting H2. The R2 values indicate that PPS explains 3% of the brand-loyalty
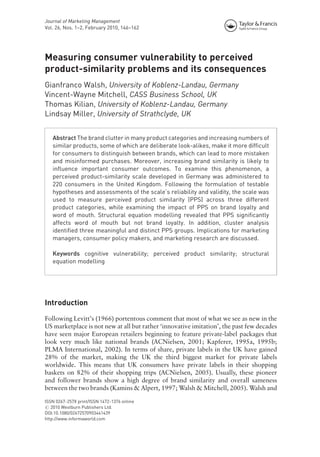
construct, and 9% of word of mouth. In Figure 1, the path coefficients for two of the
three hypotheses can be seen.
8. Walsh et al. Measuring consumer vulnerability to perceived product-similarity problems 153
Figure 1 A model of the relationship between PPS and consequences.
PPS across product types and multi-group analysis
A major objective of the research was to examine to what extent PPS levels may vary
across different products categories. The results in Table 2 show that the different
product categories varied considerably in their PPS means, with chocolate bars having
a PPS mean of 2.92 compared to mobile telephones with a mean of 3.35. It was found
that the PPS mean for chocolate bars differed significantly from beauty products (p ¼
.019) and mobile telephones (p ¼ .001). Only the mean difference between beauty
products and cellular phones is not significant. Overall, the results largely support H3.
Further, we conducted a multi-group analysis on the moderating effect of product
category, using AMOS 6.0. As expected, the comparison of the three models produced
interesting insights into how the relationship of PPS to loyalty and general word-of-mouth
propensity is moderated by product category. Only in the case of mobile phones
was the path from PPS to loyalty significant (.308; p .05). However, this path
coefficient is nearly double the value in the aggregate model shown in Figure 1. This
result suggests that when PPS-prone consumers buy high-involvement complex
products, they try to rely on simplifying heuristics, which allow them to make sound
buying decisions, with brand loyalty being one such heuristic.
For the relationship between PPS and word of mouth, the paths for chocolate bars
(.382) and beauty products (.381) are significant (p .05), with nearly identical path
coefficients to those in the aggregate model. However, in the case of mobile phones,
the PPS–word-of-mouth relationship was not significant.
Table 2 ANOVA results for PPS by product category.
Product PPS mean Product Mean difference Std. error Sig.
Chocolate bars 2.92 Beauty products .294* .124 .019
Mobile telephones .430* .122 .001
Beauty products 3.21 Chocolate bars .294* .124 .019
Mobile telephones .137 .126 .279
Mobile telephone 3.35 Chocolate bars .430* .122 .001
Beauty products .137 .126 .279
*The mean difference is significant at p .05.
9. 154 Journal of Marketing Management, Volume 26
Identifying PPS groups
Walsh and Mitchell (2005) argue that one way to better target cognitively vulnerable
consumers is to use a segmentation approach that combines PPS scores with
traditional segmentation. To identify PPS segments, a hierarchical cluster analysis
followed by a k-means analysis was conducted. The PPS items shown in Table 1
(column 2), representing the one-dimensional PPS scale, and the items measuring
brand loyalty and word of mouth were used as cluster variables in step 1. After
aggregating the eight items of the PPS scale, as well as the items measuring brand
loyalty and word of mouth, we used the respective mean values as input variables for
clustering. Distances between the clusters were calculated with the Euclidean
distance measure, and aggregation of clusters was conducted with Ward’s
procedure. To reflect the true structure of the data set, we used the elbow
criterion to decide on the number of clusters. Thresholds existed at three and four
clusters, and to decide on the appropriateness of each of the two alternative
solutions, a multiple discriminant analysis was performed. As the hit rate, or
proportion of customers correctly classified, was highest for the three-cluster
solution, it was considered the most adequate representation of existing consumer
PPS segments (see Table 3). In the next step, the identified clusters were described in
greater detail using demographic data. We now briefly describe these results.
Cluster 1 is the largest cluster. Members of this PPS prone, brand loyal cluster score
second highest on the PPS and brand-loyalty scale, indicating that they are relatively
vulnerable to not being able to distinguish between brands and therefore most
interesting from our point of view. Also, this is the least-educated cluster and the
one with the lowest income.
Cluster 2 is the smallest group, which scores lowly on the PPS scale and may be
labelled PPS immune. This group exhibits the second highest brand loyalty and lowest
word of mouth score, suggesting that they do not rely on others when choosing
brands. This cluster is the ‘oldest’, predominantly female, and the one with the
highest income.
Cluster 3 members score highest on the PPS scale compared with the first two
clusters, and may be viewed the most vulnerable group in terms of distinguishing
similar brands, which is why they were labelled PPS prone. This group is significantly
less brand loyal than consumers in the other two groups.
Discussion and implications
This article describes the validation of a one-dimensional PPS scale. The
motivation for our research is derived largely from the acknowledged limitations
of Walsh and Mitchell’s (2005) study on cognitive vulnerability. This study had
three objectives relating to: testing the PPS scale’s reliability and validity in the
UK; applying it to measure PPS in three different product categories; and
identifying whether a PPS-prone segment of consumers exists. The most
important finding is that there is an indication of generality of most scale items.
Given this finding, there is reason to believe that the PPS scale has elements of
construct validity and has potential use across international populations. The non-significant
results for brand loyalty might be explained by considering a familiarity
effect or by re-evaluating the proposed link between risk and brand loyalty. When
all brands are seen as similar and therefore substitutable, why would the consumer
10. Walsh et al. Measuring consumer vulnerability to perceived product-similarity problems 155
Table 3 Cluster centroids of cluster variables for the three PPS clusters identified.
Cluster 1: PPS-prone,
brand-loyal consumers
(n ¼ 91)
Cluster 2: PPS-immune
consumers
(n ¼ 62)
Cluster 3: PPS-prone
consumers
(n ¼ 67)
Cluster analysis results
PPS 3.22 (.73)a 2.69 (.75)b 3.48 (.77)a,c
Brand loyalty 4.27 (.45)a 4.05 (.45)b 2.71 (.84)c
Word of mouth 3.80 (.46)a 2.37 (.60)b 3.24 (.81)c
Profiling clusters
Age 27.56 (12.46)a 33.21 (14.87)b,c 29.33 (12.88)a,c
Gender (p .05)
Male 45 (49.5) 25 (40.3) 32 (47.8)
Female 46 (50.5) 37 (59.7) 35 (52.2)
Education (p .05)
Some high school
10 (11) 9 (14.5) 7 (10.4)
or less
High-school
graduate
26 (28.6) 12 (19.4) 12 (17.9)
Vocational school/
some college
23 (25.3) 8 (8.8) 10 (14.9)
College graduate/
graduate school
31 (34.1) 32 (51.6) 38 (56.7)
No formal
education
1 (1.1) 1 (1.6)
Income (p 0.05)
£10,000 56 (61.5) 30 (48.4) 31 (46.3)
£10,001–£20,000 21 (23.1) 10 (16.1) 17 (25.3)
£20,001–£30,000 11 (12.1) 11 (17.7) 13 (19.4)
£30,001–£40,000 3 (3.3) 8 (12.9) 5 (7.5)
£40,000 9 (14.5) 1 (1.5)
Product category
Chocolate bars 31 (34) 28 (45.2) 19 (28.4)
Beauty products 30 (33) 23 (37.1) 16 (23.9)
Mobile phones 30 (33) 11 (17.7) 32 (47.8)
Note: For the variables PPS, brand loyalty, and word of mouth, mean values with the same superscript
are not significantly different (p.05) from each other (based on ANOVA and a Scheffe test). SD values
are given in parentheses. Chi-square tests were applied to the gender variable (for this variable,
percentages within clusters are given in parentheses).
be brand loyal? One possible explanation might be habit. Even if no perceived
differences exist, some consumers might still purchase the same product to reduce
mental effort or for convenience. If some consumers do and some do not, the net
effect is no effect, which is the relationship we see. This explanation fits well with
the results we see from our segmentation analysis, where one PPS-prone group is
brand loyal while the highest PPS-prone group is not. As predicted on the basis of
attribution theory, which refers to the way consumers make inferences as to the
value and cause of things such as brands and their utility, PPS is found to affect
word of mouth behaviour positively. This is likely to be because consumers
11. 156 Journal of Marketing Management, Volume 26
attribute the ‘cause’ of seeing products as similar to manufacturers and are
motivated to either warn others about these similarities to avoid them
purchasing the wrong brand in the case of look-alike products or to advise them
that most products are similar and substitutable and therefore they can buy the
cheapest product thus saving them money.
When comparing our cluster-analysis results with those of Walsh and Mitchell
(2005), we see some differences. First, with regard to PPS, the German data shows
greater variation than the UK data. In the German sample, the highest PPS average is
4.5 for Cluster 1 (on a five-point scale ranging from 1 to 5), the lowest PPS average is
1.94 (Cluster 3). For our sample, the highest average is 3.5 (Cluster 3: PPS prone) and
the lowest average is 2.7 (Cluster 2: PPS immune).
Moreover, the PPS-prone clusters in Germany (Cluster 1) and the UK (Cluster 3)
differ in regards to their brand loyalty and word-of-mouth behaviour. In Germany,
PPS-prone consumers have a moderate brand loyalty with the second highest mean
(3.2) of the three clusters (highest mean: 3.5), whereas in the UK, the PPS prone have
the lowest mean (2.7) of the three clusters (highest mean: 4.3). In terms of word-of-mouth
behaviour, German PPS-prone consumers are moderately likely to use it (mean
2.8; highest mean: 2.9). UK PPS-prone consumers appear only slightly more likely to
engage in word of mouth (mean 3.2; highest mean: 3.8).
With amean age of 40 years, German PPS-prone consumers are the oldest of all three
clusters (youngest cluster: 30.6 years). In theUK, PPS-prone consumers do not appear to
differ from the other two clusters in terms of age (mean age: 29.3). One reason for this
difference could be that the UK sample is skewed towards younger consumers.
Our findings further show that the different product categories varied
considerably in their PPS means, with chocolate bars having the lowest and mobile
telephones the highest mean. One explanation for there being no difference between
beauty products and mobile phones is the role of frequency of purchase and brand
knowledge. If a consumer is purchasing beauty products weekly, even if he/she is not
involved with the category, he/she will eventually build up a repertoire of experience
that allows him/her to discriminate between products and brands. While for mobile
phones, these are only usually purchased once a year and therefore brand knowledge
is limited and all products thus seem more similar. It could also be that for this group
of consumers, beauty products were a more involving category and mobile phones a
slightly less involving category than was anticipated from the initial consumer panel
results.
An alternative explanation is that consumers have more difficulty perceiving
products as different within the mobile-telephone market. Consumers’ difficulty
in distinguishing between the brands could be a result of their cognitive inability
to effectively process the information obtained during the decision-making
process. Turnbull et al.’s (2000) study showed consumers exhibited signs of
brand-similarity confusion, leading them to become vulnerable to perceiving all
the mobile phones as similar. This would suggest that in some categories, higher
product involvement may not be an effective protection against PPS because
consumers cannot process all the information to reduce their perception of all
products being similar.
Regarding the PPS–word-of-mouth link, the results also suggest that the more people
see mobile phones as similar, they do not talk about them, and highlights product
category variations within our general framework. It might be that, unlike chocolate
and beauty products, mobile phones are not products that are talked about much. It is
also interesting to note that the significance of the paths were reversed compared with the
12. Walsh et al. Measuring consumer vulnerability to perceived product-similarity problems 157
other two product categories, perhaps suggesting that consumers either use other people
and word of mouth to help them decide when they see all brands as similar or they use
brand loyalty. This explanation fits with themobile-phonemarket, which is complicated
and changes so quickly, and therefore it is unlikely that other consumers have the
knowledge to advise properly. Thus, the only effective strategy is brand loyalty.
The results have implications for marketing practitioners and consumer policy on
how to deal with these vulnerable consumers, as well as marketing research.
Managerial and consumer-policy implications
Reducing consumer PPS proneness could be a major source of competitive advantage in
any market, but particularly in those markets where product similarity has already been
shown to exist. The PPS scale gives marketers and consumer policy makers guidance on
what to look for and the areas where attention may be required. There are two generic
strategies. One is to change the way brands are produced and marketed. The other is to
look towards educating consumers to be more brand savvy and brand discriminating.
On changing the way brands are produced and marketed, several findings are
important. The PPS–brand-loyalty relationship was negative but non-significant.
Nonetheless, this result is concerning because a negative relationship between the two
constructs could equate to a loss of business for brand manufacturers. One of the study’s
key findings is that PPS proneness affects consumer word of mouth, suggesting that PPS-prone
consumers need to engage in word of mouth when making buying decisions. This
could be to help them reduce their perceptions that all brands are similar or it could be to
complain and alert other customers to the problems of similar products. The latter is
more worrying because much of the word of mouth is likely to be negative or at least
create negative perceptions. However, to avoid negative outcomes of PPS, firms need to
avoid PPS first. Towards that end, firms can employ different product- and
communications-related strategies. Marketing communications that acknowledge and
deal with similarity perceptions, either through promotionalmaterial of personal selling,
can help to reduce PPS. In undertaking their ongoing market research, companies need to
be alerted to this possibility and attempt to find out if it is a problem for them, as these
PPS-prone consumers have higher transaction costs and relative utility.
Marketers could look at their communications and those of their competitors and
identify where they are insufficiently different and likely to be perceived by some
consumers as similar. They could also look at their products, product instructions,
and promotions to examine the amount of (similar) information they give and the
possibility of it leading to perceived similarity and whether all their information is
clear and unambiguous.
The results of the cluster analysis also have implications for marketers on how to
deal with these vulnerable consumers, in particular with respect to engendering brand
loyalty. The PPS measurement tool is suited to gathering benchmark data in retailing
firms regarding current levels of customers’ PPS, as well as conducting periodic checks
to measure PPS improvements. Practitioners can determine overall PPS, and the PPS
scale could serve as a diagnostic tool that will allow retailers to determine PPS-relevant
areas and product categories that are weakly differentiated and in need of attention.
PPS can also be tackled from the consumer side through consumer education and
policy. Knowing that many consumers feel that all the products within a category are
similar should enable consumer policy makers to impress upon marketers to develop
strategies to avoid the problem by making more effort to ensure that packaging and
visual appearance are more distinct and do not follow category norms, for example
13. 158 Journal of Marketing Management, Volume 26
white yoghurt cartons or red-and-white cola bottles. The difference between levels of
PPS between the product categories can provide policy makers with information on
which categories are most affected and can help them to prioritise their efforts on
which markets to focus on first.
Finally, the PPS scale was chosen for investigation because it can be a useful tool to
alert consumers to their susceptibility to see brands as similar. Being aware of this
proneness may help consumers avoid mistakes and become more effective shoppers.
From a consumer-protection perspective, it is not sufficient to know that some
consumers have a propensity for PPS; we need to know of whom this group consists.
For example, our results show that the PPS-prone group (Cluster 3) is significantly less
brand loyal than the other two PPS groups. However, before consumer policy makers
can use the scale, more work is needed, not least because the present study suffers from
limitations that could be addressed in future research.
Conclusion and further research
The PPS measure was tested in the UK, and contributes to a more sophisticated
understanding of how consumers are affected by product similarity and builds on
previous work by focusing on scale replication and extension into different product
categories. The paper makes three contributions. First, product similarity has always
been investigated in specific product contexts. Here, we have measured PPS
proneness in three product categories. Second, the reliability and validity tests on
the new scale suggest that the UK eight-item PPS scale has sound and stable
psychometric properties. However, more research is necessary to establish the PPS
scale in the literature.We agree with Flynn and Pearcy (2001, p. 413) who argue that
‘we must be careful of claims of a scale’s performance when there have not been
replications’. Third, we identified three groups that differ in terms of PPS proneness.
Thus, our study provides further evidence of the high relevance of cognitive
vulnerability and PPS.
However, there are several limitations and areas for further research. First, PPS
segments were examined in relation to demographic variables, and future studies
could consider psychographic and a larger number of demographic variables.
Second, the three product categories selected for this study were intended to
represent low- to high-involvement product categories. However, involvement was
not measured at an individual level. It is conceivable that buying a cellular phone is a
low-involvement decision for some consumers as much as buying a shampoo is a
high-involvement decision for others. Future studies can address this limitation by
measuring PPS as well as consumer involvement. Third, the extent to which our
findings may be extended to a greater number of product categories remains to be
explored. Fourth, more research is needed on outcomes and correlates of PPS. Fifth,
future studies could assess if the PPS scale is applicable to brand-related buying
purchases made over the Internet. As the Internet is becoming an increasingly
popular medium to deliver products, online retailers need to gain an
understanding of the consumers’ uncertainties that are involved with buying
branded products through the Internet and the role of PPS in (not) making those
buying decisions.
14. Walsh et al. Measuring consumer vulnerability to perceived product-similarity problems 159
Acknowledgements
The authors wish to thank the editor and anonymous reviewers for numerous valuable
comments.
References
ACNielsen (2005). The power of private label 2005. A review of growth trends around the
world [cited 14 June 2001]. Retrieved from http://www.acnielsen.de/pubs/documents/
ThePowerofPrivateLabel2005.pdf
Ambler, T. (2003). Marketing and the bottom line (2nd ed). London: Pearson Education.
Andreasen, A.R. (1993). Revisiting the disadvantaged: Old lessons and new problems. Journal of
Public Policy and Marketing, 12(2), 270–275.
Bagozzi, R.P., Yi, Y. (1988). On the evaluation of structural equation models. Journal of the
Academy of Marketing Science, 16(2), 74–94.
Balabanis, G., Craven, S. (1997). Consumer confusion from own brand lookalikes: An
exploratory investigation. Journal of Marketing Management, 13(4), 299–313.
Benet, S, Pitts, R.E.,LaTour, M. (1993). The appropriateness of fear appeal use for health care
marketing to the elderly: Is it OK to scare Granny? Journal of Business Ethics, 12(1), 45–55.
Bloch, P.H., Richins, M.L. (1983). A theoretical model for the study of product importance
perceptions. Journal of Marketing, 47, 69–81.
Brenkert, G. (1998). Marketing and the vulnerable. In L.P. Hartman (Ed.). Perspectives in
business ethics (pp. 515–526). Chicago: Irwin/McGraw Hill.
Broadbridge, A., Morgan, H.P. (2001). Retail-brand baby-products: What do consumers
think? Brand Management, 8(3), 196–210.
Browne, M.W.,Cudeck, R. (1993). Alternative ways of assessing model fit. In K.A. Bollen
J.S. Long (Eds.), Testing structural equation models (pp. 136–162). Newbury Park, CA: Sage.
Bryant, F.B., Yarnold, P.R. (1995). Principal components analysis and exploratory and
confirmatory factor analysis. In L.G. Grimm P.R. Yarnold (Eds.). Reading and
understanding multivariate statistics (pp. 99–109). Washington, DC: American
Psychological Association.
Burt, S. (1992). Retailer brands in British grocery retailing. Institute for Retail Studies Working
Paper 9204, University of Stirling, UK.
Burton, S., Lichtenstein, D.R., Netemeyer, R.G., Garretson, J.A. (1998). A scale for
measuring attitude toward private label products and an examination of its psychological
and behavioral correlates. Journal of the Academy of Marketing Science, 26(4), 293–306.
Churchill, G.A., Jr. (1995). Marketing research: Methodological foundations (6th ed). Chicago:
Dryden Press.
Cunningham, R.M. (1956). Brand loyalty – what, where, how much? Harvard Business Review,
39, 116–138.
Dhar, R. (1997). Consumer preference for a no-choice option. Journal of Consumer Research,
24(2), 215–231.
Feick, L.F., Price, L.L. (1987). The market maven: A diffuser of marketplace information.
Journal of Marketing, 51, 83–97.
Flynn, L.R., Pearcy, D. (2001). Four subtle sins in scale development: Some suggestions for
strengthening the current paradigm. International Journal of Market Research, 43(4),
409–423.
Folkes, V.S. (1984). Consumer reactions to product failure: An attributional approach. Journal
of Consumer Research, 10(4), 398–409.
Foxman, E.R., Berger, P.W., Cote, J.A. (1992). Consumer brand confusion: A conceptual
framework. Psychology and Marketing, 9(2), 123–140.
Goodin, R.E. (1985). Protecting the vulnerable. Chicago: University of Chicago Press.
15. 160 Journal of Marketing Management, Volume 26
Heider, F. (1958). The psychology of interpersonal relations. New York: Wiley.
Hennig-Thurau, T., Gwinner, K.P., Gremler, D.D. (2002). Understanding relationship
marketing outcomes: An integration of relational benefits and relationship quality. Journal
of Service Research, 4(3), 230–247.
Hill, R.P. (2002). Stalking the poverty consumer: A retrospective examination of modern ethical
dilemmas. Journal of Business Ethics, 37(2), 209–219.
Howard, D.J., Kerin, R.A.,Gengler, C. (2000). The effects of brand name similarity on brand
source confusion: Implications for trademark infringement. Journal of Public Policy and
Marketing, 19(2), 250–264.
Huffman, C., Kahn, B.E. (1998). Variety for sale: Mass customization or mass confusion?
Journal of Retailing, 74(4), 491–513.
Hunter, J.E. (2001). The desperate need for replications. Journal of Consumer Research, 28,
149–158.
Jary, M.,Wileman, A. (1998). Managing retail brands. In S. HartJ. Murphy (Eds.). Brands:
The new wealth creators (pp. 152–160). New York: New York University Press.
Kamins,M.,Alpert, F. (1997). Consumer-brand confusion: The prevalence, course, and impact
of misperception of market leader and market pioneer brand. World Marketing Congress. In
S.M.D. Sidin A.K. Manrai (Eds.). Proceedings of the Eighth Biennial World Marketing
Congress (p. 522). Kuala Lumpur, Malaysia: Academy of Marketing Science.
Kapferer, J.-N. (1995a). Stealing brand equity: Measuring perceptual confusion between national
brands and ‘copycat’ own label products. Marketing and Research Today, 23(2), 96–102.
Kapferer, J.-N. (1995b). Brand confusion: Empirical study of a legal concept. Psychology and
Marketing, 12(6), 551–568.
Kumar, V., Petersen, A., Leone, R.P. (2007). How valuable is the word of mouth? Harvard
Business Review, October, 139–146.
Langenderfer, J.,Shimp, T.A. (2001). Consumer vulnerability to scams, swindles, and fraud: A
new theory of visceral influences on persuasion. Psychology and Marketing, 18(7), 763–783.
Levitt, T. (1966). Innovative imitation. Harvard Business Review, 44(5), 63–70.
Loken, B., Ross, I., Hinkle, R.L. (1986). Consumer confusion of origin and brand similarity
perceptions. Journal of Public Policy and Marketing, 5(1), 195–211.
Lomax, W., Sherski, E., Todd, S. (1999). Assessing the risk of consumer confusion: Some
practical test results. Journal of Brand Management, 7(2), 119–132.
PLMA International (2002). Handelsmarken: Vereinigtes Ko¨nigreich f¨uhrt, gefolgt von Belgien
[Own Label Brands: The United Kingdom lead, followed by Belgium]. Retrieved December
16, 2002, from http://www.plmainternational.com/scanner/scanner.asp?language¼de
Rothschild, M.L. (1984). Perspectives on involvement: Current problems and future directions.
Advances in Consumer Research, 11, 216–217.
Sproles, G.B., Kendall, E. (1986). A methodology for profiling consumers’ decision-making
styles. The Journal of Consumer Affairs, 20(2), 267–279.
Sundaram, D.S., Mitra, K., Webster, C. (1998). Word-of-mouth communications: A
motivational analysis. Advances in Consumer Research, 25, 527–531.
Turnbull, P., Leek, S., Ying, G. (2000). Costomer confusion: The mobile phone market.
Journal of Marketing Management, 16(1–3), 143–163.
Walsh, G., Mitchell, V.-W. (2005). Customer vulnerable to perceived product similarity
problems: Scale development and identification. Journal of Macromarketing, 25(2), 140–152.
Warlop, L., Alba, J.W. (2004). Sincere flattery: Trade-dress imitation and consumer choice.
Journal of Consumer Psychology, 14(12), 21–27.
Zaichkowsky, J.L. (1985). Measuring the involvement construct. Journal of Consumer Research,
12(3), 341–352.
16. Walsh et al. Measuring consumer vulnerability to perceived product-similarity problems 161
Appendix 1. Demographic profile of the sample
UK sample (n ¼ 220)
Age (years)
16–26 125 (56.8%)
27–37 30 (13.6%)
38–48 31 (14.1%)
49–59 31 (14.1%)
60þ 3 (1.4%)
Gender
Male 46.4%
Female 53.5%
Education
Some high school or less 26 (11.8%)
High-school graduate 50 (22.7%)
Vocational school/some college 41 (18.6%)
College graduate/graduate school 101 (46.4%)
No formal education 2 (0.5%)
Income
£10,000 117 (53.2%)
£10,001–£20,000 48 (21.8%)
£20,001–£30,000 35 (15.9%)
£30,001–£40,000 16 (7.3%)
£40,000 4 (1.8%)
Appendix 2. Customer outcome variables of PPS
Source/adapted
from
Factor: Brand loyalty/a ¼ .76 Sproles and Kendall
(1986)
I have favourite brands I buy over and over again.
I change brands I buy regularly.
Once I find a product or brand that I like, I stick with it.
Factor: Word of mouth/a ¼ .87 Feick and Price
(1987)
I like introducing new brands and products to my friends.
My friends think of me as a good source of information
when it comes to new products or sales.
I like helping people by providing them with information when it
comes to new products.
If someone asked me where to get the best buy on several types of
products, I can tell them where to shop.
People ask me for information about products places to shop, or
sales.
17. 162 Journal of Marketing Management, Volume 26
About the authors
Gianfranco Walsh is a professor of marketing and electronic retailing in the Institute for
Management at the University of Koblenz-Landau and a visiting professor in marketing at the
University of Strathclyde Business School. His research focuses on consumer behaviour,
corporate reputation, e-commerce, and social marketing. His work has been published in,
amongst others, Academy of Management Journal, Journal of the Academy of Marketing
Science, Journal of Advertising, International Journal of Electronic Commerce, Journal of
Business Research, Journal of Interactive Marketing, and Journal of Macromarketing.
Corresponding author: GianfrancoWalsh, Institute for Management, University of Koblenz-
Landau, Universit¨atsstrasse 1, 56070 Koblenz, Germany.
T þ49 261 287 2852
E walsh@uni-koblenz.de
Vincent-Wayne Mitchell is the Sir JohnE. Cohen Chair of Consumer Marketing at Cass Business
School, City University London. He has done extensive research into marketing and consumer
behaviour, with particular focus on consumer decision making, complaining behaviour, and risk
taking. He has won eight Best Paper Awards and has published over 200 academic and
practitioner papers in journals such as Harvard Business Review, Journal of Business Research,
Journal of Economic Psychology, Journal of Consumer Affairs, Journal of Business Ethics, British
Journal of Management, as well as numerous conference papers. He sits on the Editorial Boards
of six international journals, is associate editor of the International Journal of Management
Reviews, as well as being an Expert Adviser for the Office of Fair Trading and Head of Marketing
at Cass.
T þ44 207 040 5108
E v.mitchell@city.ac.uk
Lindsay Miller was an Honours student at Strathclyde Business School.
E lindsaymiller64@hotmail.com
Thomas Kilian is an assistant professor of marketing in the Institute for Management at the
University of Koblenz-Landau.
T þ49 261 287 2623
E kilian@uni-koblenz.de
18. Copyright of Journal of Marketing Management is the property of Routledge and its content may not be copied
or emailed to multiple sites or posted to a listserv without the copyright holder's express written permission.
However, users may print, download, or email articles for individual use.