More Related Content
Similar to WEF Wettbewerksfähigkeit Tourismus wort lu
Similar to WEF Wettbewerksfähigkeit Tourismus wort lu (20)
More from Luxemburger Wort
More from Luxemburger Wort (20)
WEF Wettbewerksfähigkeit Tourismus wort lu
- 1. 2.1: Country/Economy Profiles
L ux emb ourg
K ey indicators
Population (millions), 2011 ....................................................................................................................... 0.5
Surface area (1,000 sq uare kilometers), 2011 ......................................................................................... 2.6
Gross domestic product (current US$ billions), 2011 ............................................................................. 59.6
Gross domestic product (current PPP, $) per capita, 2011 ............................................................. 80,558.8
Real GDP grow th (percent), 2011 ............................................................................................................ 1.6
Environmental Performance Index 2012, rank (out of 132 economies), 2011 ............................................. 4
Travel & Tourism indicators T&T industry
GDP growth forecast
T&T industry, 2012 estimates Absolute value Percent of total (2013–2022)
T&T industry GDP (US$ millions).......................................................1,186 .6 ................ 2.0 ...................– 0.3
T&T industry employment (1,000 jobs) ....................................................6 .1 ................ 2.6 ...................– 1.2
T&T economy, 2012 estimates
T&T economy GDP (US$ millions) .......................................................3,405 ................ 5.7 .................... 0.9
T&T economy employment (1,000 jobs) ...................................................17 ................ 7 .6 .................... 0.1
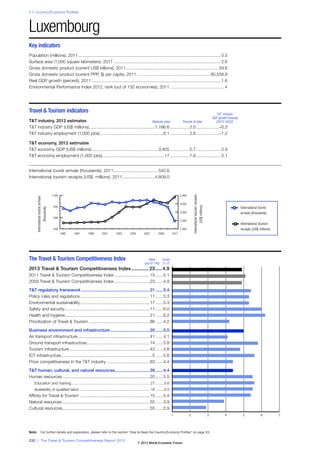
International tourist arrivals (thousands), 2011 .....................................542.6
International tourism receipts (US$, millions), 2011 ...........................4,809.0
1,000 5,000 International tourism receipts
International tourist arrivals
4,000
(US$ millions)
800 International tourist
(thousands)
3,000 arrivals (thousands)
600
2,000
International tourism
400 1,000 receipts (US$ millions)
1995 1997 1999 2001 2003 2005 2007 2009 2011
Th e Travel & Tourism C omp etitiveness I ndex Rank Score
(out of 140) (1–7)
2013 Travel & Tourism C omp etitiveness I ndex . . . . . . . . . . . . . 23 . . . . . 4 . 9
2011 Travel & Tourism Competitiveness Index ..............................15 ......5.1
2009 Travel & Tourism Competitiveness Index ..............................23 ......4.9
T&T reg ulatory framew ork . . . . . . . . . . . . . . . . . . . . . . . . . . . . . . . . . . . . . . . . . . . . . . . . . . . . . . . . . 21 . . . . . . 5 . 4
Policy rules and regulations ..........................................................11 ......5.3
Environmental sustainability ..........................................................17 ......5.3
Safety and security .......................................................................11 ......6 .0
Health and hygiene.......................................................................21 ......6 .2
Prioritization of Travel & Tourism ...................................................86 ......4.2
Business environment and infrastructure . . . . . . . . . . . . . . . . . . . . . . . . . . . . . . . . . 20 . . . . . . 5 . 0
Air transport infrastructure ............................................................41 ......4.1
Ground transport infrastructure.....................................................14 ......5.8
Tourism infrastructure ...................................................................43 ......4.8
ICT infrastructure ............................................................................5 ......5.6
Price competitiveness in the T&T industry ....................................83 ......4.4
T&T human, cultural, and natural resources . . . . . . . . . . . . . . . . . . . . . . . . . . . . . 39 . . . . . . 4 . 4
Human resources .........................................................................20 ......5.5
Education and training............................................................................21 ........5.6
Availability of q ualified labor ....................................................................18 ........5.5
Affinity for Travel & Tourism ..........................................................15 ......5.4
Natural resources .........................................................................55 ......3.9
Cultural resources.........................................................................55 ......2.9
1 2 3 4 5 6 7
Note: F or further details and ex p lanation, p lease refer to the section “ H ow to R ead the C ountry/ E conom y Profiles” on p age 8 3.
232 | The Travel & Toursim Competitiveness Report 2013
© 2013 World Economic Forum
- 2. 2.1: Country/Economy Profiles
Luxembourg
The Travel & Tourism Competitiveness Index in detail
INDICATOR SCORE RANK INDICATOR SCORE RANK
1st pillar: P o lic y ru le s and re g u latio ns ................ 5.3............11 8th pillar: To u rism inf rastru c tu re ......................... 4.8............ 43
1.01 Prevalence of foreign ownership .......................... 6.5 ..............1 8.01 Hotel rooms/100 pop.* ........................................ 1.7 ............14
1.02 Property rights ..................................................... 6.2 ..............4 8.02 Presence of maj or car rental co. (1–7)* ................... 6 ............32
1.03 Business impact of rules on FDI .......................... 5.7 ..............6 8.03 ATMs accepting Visa cards/million pop.* ........... 54.2 ..........103
1.04 Visa req uirements, no. of countries* .................. 71.0 ............58
1.05 Openness bilateral ASAs (0–38)* ....................... 14.1 ............35 9th pillar: ICT inf rastru c tu re ................................ 5.6.............. 5
1.06 Transparency of government policymaking .......... 5.5 ............10 9.01 ICT use for B-to-B transactions ........................... 5.9 ............16
1.07 No. of days to start a business*............................ 19 ............80 9.02 ICT use for B-to-C transactions ........................... 5.1 ............36
1.08 Cost to start a business, % GNI/capita* .............. 1.9 ............27 9.03 Individuals using the Internet, % * ....................... 90.9 ..............5
1.09 GATS commitment restrictiveness (0–100)* ....... 53.1 ............68 9.04 Fixed telephone lines/100 pop.* ........................ 54.1 ..............9
9.05 Broadband Internet subscribers/100 pop.* ........ 32.9 ............10
2nd pillar: Env iro nm e ntal su stainab ility .............. 5.3............17 9.06 Mobile telephone subscriptions/100 pop.* ....... 148.3 ............16
2.01 Stringency of environmental regulation................. 6.1 ..............7 9.07 Mobile broadband subscriptions/100 pop.* ....... 66.7 ............12
2.02 Enforcement of environmental regulation ............. 5.9 ..............8
2.03 Sustainability of T&T industry development .......... 4.9 ............40 10th pillar: P ric e c o m pe titiv e ne ss in T& T ind. ..... 4.4............ 83
2.04 Carbon dioxide emission, million tons/capita* .... 21.5 ..........134 10.01 Ticket taxes and airport charges (0–100)*.......... 97.2 ..............3
2.05 Particulate matter concentration, µg/m³* ........... 12.7 ............11 10.02 Purchasing power parity* ..................................... 1.3 ..........132
2.06 Threatened species, % * ....................................... 0.4 ..............1 10.04 Fuel price, US$ cents/liter* .............................. 136.0 ............96
2.07 Environm. treaty ratification (0–25)* ....................... 22 ............20 10.03 Extent and effect of taxation ................................ 4.8 ............12
10.05 Hotel price index, US$* ................................... 119.7 ............45
3rd pillar: Saf e ty and se c u rity ............................. 6.0............11
3.01 Business costs of crime and violence .................. 6.2 ..............6 11th pillar: H u m an re so u rc e s .............................. 5.5............20
3.02 Reliability of police services.................................. 5.9 ............21 Education and training ......................................... 5.6 ............21
3.03 Road traffic accidents/100,000 pop.* .................. 9.6 ............23 11.01 Primary education enrollment, net % * ................ 95.0 ............56
3.04 Business costs of terrorism ................................. 6.2 ............27 11.02 Secondary education enrollment, gross % * ....... 97.6 ............40
11.03 Quality of the educational system ........................ 4.4 ............36
4th pillar: H e alth and hy g ie ne ............................. 6.2............21 11.04 Local availability specialized research & training ... 5.2 ............22
4.01 Physician density/1,000 pop.* ............................. 2.8 ............37 11.05 Extent of staff training .......................................... 5.3 ..............4
4.02 Access to improved sanitation, % pop.* .......... 100.0 ..............1 A v ail ab il ity of q ual if ie d l ab or ................................. 5.5 ............18
4.03 Access to improved drinking water, % pop.* ... 100.0 ..............1 11.06 Hiring and firing practices .................................... 3.2 ..........118
4.04 Hospital beds/10,000 pop.*............................... 56.0 ............27 11.07 Ease of hiring foreign labor .................................. 5.2 ..............7
11.08 HIV prevalence, % adult pop.* ............................. 0.3 ............66
5th pillar: P rio ritiz atio n o f Trav e l & To u rism ........ 4.2............ 86 11.09 Business impact of HIV/AIDS............................... 6.3 ............16
5.01 Government prioritization of the T&T industry ...... 5.3 ............65 11.10 Life expectancy, years* ...................................... 80.1 ............22
5.02 T&T gov’t expenditure, % gov’t budget* .............. 2.7 ............86
5.03 Effectiveness of marketing to attract tourists ....... 4.5 ............68 12th pillar: Af f inity f o r Trav e l & To u rism ............. 5.4............15
5.04 Comprehensiveness of T&T data (0–120)* ......... 55.0 ............94 12.01 Tourism openness, % of GDP* .......................... 14.4 ............16
5.05 Timeliness of T&T data (0–18)* .......................... 13.5 ............71 12.02 Attitude of population toward foreign visitors ....... 6.4 ............49
12.03 Extension of business trips recommended .......... 5.2 ............83
6th pillar: Air transpo rt inf rastru c tu re .................. 4.1............ 41 12.04 Degree of customer orientation............................ 5.2 ............30
6.01 Quality of air transport infrastructure .................... 5.8 ............27
6.02 Airline seat kms/week, dom., millions* ................. 0.0 ..........105 13th pillar: Natu ral re so u rc e s .............................. 3.9............ 55
6.03 Airline seat kms/week, int’l, millions* .................. 21.9 ..........114 13.01 No. of W orld Heritage natural sites* ........................ 0 ............79
6.04 Departures/1,000 pop.* ..................................... 98.7 ..............3 13.02 Quality of the natural environment........................ 5.9 ............15
6.05 Airport density/million pop.* ................................. 1.9 ............24 13.03 Total known species* .......................................... 253 ..........132
6.06 No. of operating airlines*.................................... 12.5 ..........101 13.04 Terrestrial biome protection (0–17% )*................. 17.0 ..............1
6.07 International air transport network ....................... 5.2 ............50 13.05 Marine protected areas, % * ................................. n/a ...........n/a
7th pillar: G ro u nd transpo rt inf rastru c tu re .......... 5.8............14 14th pillar: Cu ltu ral re so u rc e s ............................. 2.9............ 55
7.01 Quality of roads ................................................... 5.9 ............15 14.01 No. of W orld Heritage cultural sites* ....................... 2 ............88
7.02 Quality of railroad infrastructure ........................... 5.2 ............14 14.02 Sports stadiums, seats/million pop.* ......... 175,307.5 ..............5
7.03 Quality of port infrastructure................................. 5.5 ............23 14.03 No. of int’l fairs and exhibitions* ......................... 18.7 ............69
7.04 Quality of ground transport network .................... 5.4 ............26 14.04 Creative industries exports, % of world total*....... 0.0 ............76
7.05 Road density/million pop.* ............................... 202.0 ............10
The Travel & Toursim Competitiveness Report 2013 | 233
© 2013 World Economic Forum