
Recommended
More Related Content
Featured
Featured (20)
Chart Of The Week 110510
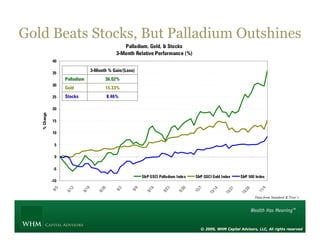
- 1. Palladium, Gold, & Stocks 3-Month Relative Performance (%) -10 -5 0 5 10 15 20 25 30 35 40 8/5 8/12 8/19 8/26 9/2 9/9 9/16 9/23 9/30 10/7 10/14 10/21 10/28 11/4 %Change S&P GSCI Palladium Index S&P GSCI Gold Index S&P 500 Index Gold Beats Stocks, But Palladium Outshines 8.46%Stocks 15.33%Gold 36.02%Palladium 3-Month % Gain/(Loss) © 2009, WHM Capital Advisors, LLC, All rights reserved Data from Standard & Poor’s