Polish Patenting in Biotechnology. Actual Landscape and Forecast
1. Polish patenting trends in Biotechnology.Polish patenting trends in Biotechnology.Polish patenting trends in Biotechnology.Polish patenting trends in Biotechnology.
Past, present and forecast.Past, present and forecast.Past, present and forecast.Past, present and forecast.
Werner Deichmann Juan, Scientific Analyst, Warsaw, 2015
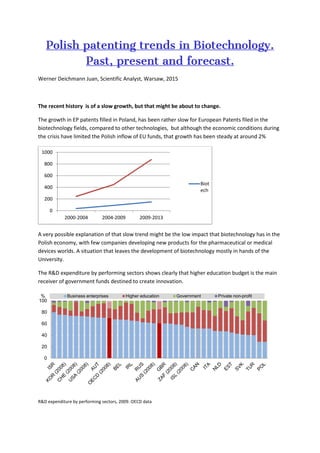
The recent history is of a slow growth, but that might be about to change.
The growth in EP patents filled in Poland, has been rather slow for European Patents filed in the
biotechnology fields, compared to other technologies, but although the economic conditions during
the crisis have limited the Polish inflow of EU funds, that growth has been steady at around 2%
A very possible explanation of that slow trend might be the low impact that biotechnology has in the
Polish economy, with few companies developing new products for the pharmaceutical or medical
devices worlds. A situation that leaves the development of biotechnology mostly in hands of the
University.
The R&D expenditure by performing sectors shows clearly that higher education budget is the main
receiver of government funds destined to create innovation.
R&D expenditure by performing sectors, 2009. OECD data
0
200
400
600
800
1000
2000-2004 2004-2009 2009-2013
Biot
ech
0
20
40
60
80
100
% Business enterprises Higher education Government Private non-profit
2. Patenting trends in relation to R&D investment
Poland actually invests 0,9% of its GDP in R&D what is much bellow the EU average of 3%.
The relation of the percentage of the Gross Domestic Product invested in R&D and
innovation measured as number of patents internationally issued is clearly visible in the
graphics bellow and successive Polish governments have tried to approach the EU average,
however the 2008 crisis compelled the government to wait for better times to increase the
R&D investements. If the crisis is left behind for most of the EU, it is highly expectable to see
a change in the R&D investment state policy.
Data from 2006 to Dec-2013.
The distribution of the patents per million habitants and the R&D investments as % of the GDP are
very similar, although the most efficient system seems to be the German and the less the Chinese.
The rest of the world seems to be equally efficient. The low efficacy of the Chinese case could be
due, to some extent, to the size/importance of the local market that makes a national patent a much
better deal than it would be for countries with smaller populations like USA or France.
The graphic of country Patenting Abroad shows the
result of the percentage of patents issued abroad of
the patent of origin. The relation with R&D
expenditure is clear but in this case USA and France
are clearly more active in patenting abroad than
Germany.
3. The Pearson Correlation Index of the data: Number of patents per million habitants vs R&D
investment = 0.917. With N=7 (number of countries included in the regression) the correlation
Patents-R&D has a P-value of 0.0036 and it is significant at p<0.01
Pearson Correlation Index (Number of patents per million habitants vs R&D investment) = 0.935.
With N=6 the correlation Patents-R&D has a P-value of 0.0062 and it is significant at p<0.01
It might be significative, from the point of view of the Polish Innovation Potential that of the 7
countries compared only Poland and Germany have numbers of patents per million habitants above
the regression line.
Expediture for R&D as % of GDP: Average data from 2005 to 2009 Information extracted from the World Bank publications.
http://data.worldbank.org/sites/default/files/wdi-2012-ebook.pdf
Poland Ukraine
Spain
China
France
US
Germany
y = 1712.5x - 2816.9
R² = 0.8128
-2000
0
2000
4000
6000
8000
10000
12000
Patents per million habitants (Including China)
Patents per million habitants
Linear (Patents per million
habitants)
Poland Ukraine
Spain
France
US
Germany
y = 2153.7x - 2967.1
R² = 0.9133
-2000
0
2000
4000
6000
8000
10000
12000
0 1 2 3 4 5 6 7
Patents per million habitants (Excluding China)
Patents per million habitants
Linear (Patents per million
habitants)
4. Near future forecast:
If the crisis remains or the government policy doesn’t change, a moderate growth of 2% per year
The following graphic has been elaborated population adjusting the number of biotechnology
patents issued by Germany, Spain and Poland and comparing them.
The total numbers of Germany and Spain have been obtained after multiplying the overall total
number of patents issued by a population coefficient (country specific). The coefficient was obtained
by dividing the Polish population by either the Spanish or the German.
2000-2002 2002-2004 2004-2006 2006-2008
Biotech_PL 8 24 37 31
Biotech_ES-Adjusted 118,72 141,80 193,74 177,25
Biotech_DE-Adjusted 2021,46 1874,86 1479,45 1207,72
In the case of the crisis maintaining its pressure on the EU economy a 2% increase in Biotechnology
patenting should be expected to continue.
If the crisis is left behind or the government addresses the long felt need of increasing R&D
expenditure.
The Polish growth scenarios are either that of a sharp increase (a few years) in the number of
patents, followed by a slow approach to the level of Spain (5 times higher than Poland) or no
sharp increase but still faster than the rest of EU members, quickly approaching either the Spanish
level or the German Adjusted (40 fold that of Poland)
An 6 fold increase of the Polish innovation capacity would put Poland at the same level as Spain in
the following years, however if Germany is considered as the optimum, the maximum growth is of a
40 fold increase.
0
500
1000
1500
2000
2500
2000-2002 2002-2004 2004-2006 2006-2008
AxisTitle
Adjusted Number of biotech patents.
Biot_PL
Biot_ES-Adjusted
Biot_DE-Adjusted
5. Poland, as the only European country that can boast not having felt the effects of the financial crisis
that started in 2008 is in a privileged start position in a world that is beginning to recover from the
crisis.
There are many problems that the country has inherited from the communist era that are quite
evidently changing, and at a speeding up pace, as are the conservative attitude of the political
system towards investing in R&D in the private sector, one of the Europe lowest and a mixture of
incompetence and mistrust towards the citizens that has been the usual way of working of the
administration and it is changing as the older staff retires from the active working life giving way to
better prepared and more professional public servants.
The combined factors of a good economic situation, political stability, and the modernization of the
administration allow to forecast high chances for the country taking the maximum profit form a EU
that is leaving behind the crisis.
Other reasons for optimism
A statistical study by Cesar A. Hidalgo and Ricardo Hausmann published in PNAS (2009) analyzed the
dependence between the complexity, the degree of sophistication of the industrial production and
the GDP of the countries for which the data was analyzed. Higher diversities suppose healthier
economies. Poland’s industrial diversity is higher than Great Britain, japan or Canada with a GDP
much lower than what it would be expected, all that implies that a there is a high growth potential
that can generate
great profits.
“GDP versus diversity
of industrial
production”, César A.
Hidalgo, 10570–10575,
doi:10.1073/pnas.0900
943106
6. Biotech Patenting trends in Poland from the Patent
Attorney point of view
A search looking for patents issued or validated in Poland, related to biotechnology, showed that
there are two basic kinds of services given by the patent attorney s, dominated by two groups of
firms that are specialized, mostly, in one of those services. The two types of services are Validation
(Translation, managing the entrance into the Polish system of the foreign application) and Patenting
Polish inventions.
Patent Validation firms: A stable landscape with most positions taken.
Three companies obtain most of the biotechnology projects that are validated in Poland. Those firms
are the oldest and are rather unchallenged by the rest of smaller firms.
The most prolific firms:
Patpol
Polservice
Sulima- Grabowska
Patpol:
The strongest player in the Validation market is also a prolific firm in international patenting,
although most of the patents belong to the engineering or mechanical fields.
Polservice has no PCT issued during the period examined and Sulima- Grabowska has got just two
Polish patents internationally filed.
0
2
4
6
8
10
2010 2011 2012 2013 2014
Patpol filed PCT patents
7. EP – PCT. Patent filling firms:
Fast growth for the firms with good relations with either University or Industry (or both)
A look at the patenting activities of the patent attorney firms that are more active in biotechnology
PCT filing shows a quickly evolving landscape where a few firms are coping the best positions. The
most effective strategy to folow seems to be to establish strong ties with a concrete university as
WTS has with Wroclaw University, Jan Wierzchon with Krakow’s Jagiellonski University or to concrete
pharmaceutical/medical companies as Jadwiga Sitkowska with ADAMED. A strategy that seems
natural for a firm that hasn’t got natural ties with a university can be to enter in the transference of
technology clusters that have been recently began to form, a strategy that WTS Patent Attorneys is
following in Warsaw with the BTM Masovia cluster.
More opportunities than what it seems.
There is also the “grandfathers” problem of an incoming shortage of EP patent attorneys in Poland
following the progressive retirement of European Patent attorneys. Many of the Polish patent
attorneys that during the nineties were validated as EP attorneys have been signing most of the EP
filed patents. Nowadays those “grandfathers” are of an average of 60 years old and are beginning to
leave their jobs.
The most prolific firms:
WTS patent attorneys
Jan Wierzchon & Partners
Lex-Pat
Jadwiga Sitkowska
Pharmaceutical Research Institute (Rydygiera 8): Not a law firm, not reflected therefore in this
report.
8. WTS patent attorneys
By far the most prolific PCT patent filers. 41 PCT patents filed from 2009 to date. Their collaboration
with Wroclaw Research Centre EIT+, one of the best (probably the most successful) transference of
technology companies in Poland has been crucial and the expertise of the patent attorneys their
positioning in the biotechnology market is beginning to take positions in Warsaw.
Jan Wierzchon & Partners
The expansion of the company in the biotech fields is not very dynamic. The firm created in 2011 an
educational foundation that aims to inform the general public of the possibilities that patenting has
for entrepreneurs and inventors. The number of 20 PCT patents filed in the biotechnology field since
2009.
0
5
10
15
20
2009 2010 2011 2012 2013 2014
WTS filed PCT patents
0
2
4
6
8
10
12
14
16
2009 2010 2011 2012 2013 2014
Jan Wierzchon filed PCT patents
9. Lex-Pat
The firm does not file PCT applications, at least not the patent attorneys listed in their website. What
they do is to file National applications followed by EP applications. However of the 12 EP applications
only one has made it to national level and in Slovenia, apart of course of the priority country, Poland.
Lex-Pat has filed a total of 12 EP applications
Jadwiga Sitkowska
There isn’t any web page on Jadwiga Sitkowska. The patent attorney seems to have a main customer,
the medical devices producer ADAMED.
The number of PCT patents, 27, mostly biotechnology related, suggests that there must be a solid
team working for Jadwiga Sitkowska.
0
1
2
3
4
5
6
7
8
9
2009 2010 2011 2012 2013 2014
Jadwiga Sitkowska
10. APPENDIX (Search Methodology, query synthax,…)
Patenting trends by the Polish Patent Attorney firms
The patent searches mentioned in this report were realized using Global Patent Index (GPI)a tool for
searching the EPO's worldwide patent data and Patentscope.
The first searches were performed with GPI and were oriented to find the patent attorney firms that
were more active in the biotechnology field. In order to find out mostly what was being filed in that
concrete technological field a complex syntax involving the most used IPC/CPC first four letters of the
codes was used.
PUC = Country Code
APPC = Applicant ‘ s Country of origin
PRD = Priority Date
PRC = Priority Country
Foreign biotech patents validated in Poland from 2009 to date (October 2014)
PUC =PL* ANDNOT (APPC = PL ) AND (IPC OR CPC) = (A61K* OR C12* OR C07* or (A* AND (C08* OR
C01* OR C02*))) AND PRD >20090101
Polish patents filed also by the EPO
((APC OR PRC) = PL) AND (IPC OR CPC) = (A61K* OR C12* OR C07* or (A* AND (C08*
OR C01* OR C02*))) AND PRD >20090101 AND PRD < 20130601 AND PUN =EP*
The second series of searches was performed after finding out either in the patent attorneys firm
web pages or inspecting the patents the names of the patent agents working for the firms and was
realized using patentscope to find the PCT patents filed by those patent agents/attorneys.
ANA = Nationality
RPF = Main Legal Representative
RP = Representative’s name
PD = Priority Date
ANA:PL AND (RPF:(patent attorney/agent) OR RP:( patent attorney/agent)) AND PD:([01.01.2009 to
01.01.2015])
11. Patenting trends in relation to R&D investment, elaboration of the
report.
The searches were performed on the 21st of June of 2013. The number of documents resulting from
the search of years previous to 2006 might vary slightly as the database is actualized weekly, the
numbers shown in the search after 2006 will increase as time passes from the day of realization of
this report
Total of Polish patents (whenever another country considered PL was changed by the other acronym)
APPC = PL AND PRD >20060101
Not in EP
The FMA operator (Family member) is no longer available in GPI, however it is easily exchangeable by
DS (Designation state) or the two first letters of PUN (PUblication Number), eg: PUN = EP*
APPC = PL AND PRD >20060101 ANDNOT FMA = (EP OR DE OR GB OR)
Almost exclusive of that country:
APPC = PL AND PRD >20060101 ANDNOT FMA = (EP OR DE OR GB OR FR OR US OR CA OR AU OR CN)
In the case of Ucraine I also extracted Russia to see if there was any regional/linguistic influence
APPC =UA AND PRD >20060101 ANDNOT FMA = (EP OR DE OR GB OR FR OR US OR CA OR AU OR CN
OR RU)
And when considering countries like China or Australia, etc. the condition in the not family members
was changed to from CN, AU etc. to PL
Historical data
Expediture for R&D as % of GDP: Average data from 2005 to 2009 Information extracted from the
World Bank publications. http://data.worldbank.org/sites/default/files/wdi-2012-ebook.pdf
All the searches have been performed using Global Patent Index, the syntax of the searches
is explained in the appendix
The result showed the patent documents registered almost exclusively in Poland for the first period
mentioned bellow:
From 1990 to 2000
54 064 documents (97% of all documents) are filled almost only in Poland
From 2000 to 2006
24634 documents (89% of all docs) are filled almost only in Poland
12. Data: From 2006 to 16-07-2014. Comparative results:
Ukraine (45 million habitants, 419 patents per million habitants, Experditure of R&D* = 0.86)
18 868 documents , 18 501 (98%) not validated in EP or in Germany, France or Great Britain, 18 238
(96%) neither in US, Canada (CA), Australia (AU) or China (CN), 16 838 (89%) if Russia is taken out of
the list of countries where the patent is validated)
Poland (38 million habitants,731 patents per million habitants, Expenditure of R&D = 0.68)
27 798 documents, 25 177 (91%)not validated in EP or in Germany, France or Great Britain, 24 634
(89%)neither in US, CA, AU or CN
Spain (41 million habitants, 2 302 patents per million habitants, Expenditure of R&D=1.38)
94 422 documents, 80 038 (85%) not validated in EP or in Germany, France or Great Britain, 66 749
(70%) neither in US, CA, AU or CN
France (61 million habitants, 5 957 patents per million habitants, Expenditure of R&D= 2.23)
363 350 documents, 168 443 (46%) not validated in EP or in Germany, Poland or Great Britain, 116
968 (32%) neither in US, CA, AU or CN)
Germany (82 million habitants, 11 294 patents per million habitants, Expenditure of R&D = 2.82)
926 081 documents, 525 812 (57%) not validated in EP or in Poland, France or Great Britain, 386 293
(42%) neither in US, CA, AU or CN)
United States (304 million habitants, 6 722 patents per million habitants, Experditure of R&D=2.79)
2 043 510 documents, 1 089 807 (53%) not validated in EP or in Germany, France or Great Britain,
878 462 (42%) neither in Poland, CA, AU or CN
China (1 354 million habitants, 807 patents per million habitants, Experditure of R&D = 1.47)
1 093 626 documents, 1 068 505 (98%)not validated in EP or in Germany, France or Great Britain , 1
025 329 (94%) neither in Poland, CA, AU or US