Recommended

Recommended
More Related Content
Viewers also liked
Similar to Sjw Cmb 022610
Similar to Sjw Cmb 022610 (20)
Sjw Cmb 022610
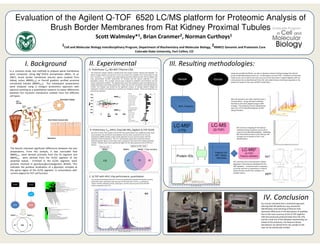
- 1. Evaluation of the Agilent Q-TOF 6520 LC/MS platform for Proteomic Analysis of Brush Border Membranes from Rat Kidney Proximal Tubules Scott Walmsley*1, Brian Cranmer2, Norman Curthoys1 1Cell and Molecular Biology Interdisciplinary Program, Department of Biochemistry and Molecular Biology, 2RMRCE Genomic and Proteomic Core Colorado State University, Fort Collins, CO I. Background II. Experimental III. Resulting methodologies: A. Preliminary: C18-NSI-MS2 (Thermo LTQ) In a previous study, two methods to prepare apical membranes The proteomic analysis utilized 4 samples that were trypsin treated, reduced and alkylated. To Using two parallell workflows, we plan to develop a feature finding strategy that utilized were compared. Using Mg2+/EGTA precipitation (Biber, et al. obtain enough peptide and spectral counts per protein the peptides were fractionated by SCX arrays of identified features from our LC-MS analysis on the Q-TOF. Correlation of retention 2007), brush border membrane vesicles were isolated from into 7 fractions. 7 ul / fraction was triply injected and then eluted into the Thermo finigan LTQ times across runs as well as the mass accuracy of the instrument (~5ppm) together with our kidney cortex (BBMVCTX) or Percoll gradient purified proximal mass spectrometer (15-60% acetonitrile, 42 minutes) and the spectra collected in a data Sample Sample small protein lists as identified with the LTQ will enable feature matching to peptides in the dependent manner. The resultant spectra were analyzed by SEQUEST and X!Tandem and the results combined by Scaffold. The exported data were then analyzed using R and significance for protein list based on the mass and NET model alone. convoluted tubules (BBMVPCT). The subsequent preparations relative abundance was tested using Fisher’s Exact Test and a BY corrected p value distribution (q were analyzed using a shotgun proteomics approach with <0.001). The analysis was limited by the significant amount of starting material (30ug) and subsequent analysis encompassing 21 injections per biological sample. These prevented the use spectral counting as a quantitative measure to assess differences of technical replicates. between the resultant membranes isolated from the different cell types. BBMVCTX Proximal Tubule BSA and Lysozyme was triply injected across 5 PCT (S1/S2) Data Data Data concentrations. Using msInspect software, the feature sets were aligned using an AMT BBMVPCT Data SCX Fractions strategy. The evaluative results indicated low ppm error of the identified peptides by MS2 using X!Tandem . Brush Border (lumenal side) LC-MS2 LC-MS LC-MS NET and mass mapping of the features B. Preliminary: C18 (HPLC Chip) NSI-MS2 (Agilent Q-TOF 6520) (LTQ) (Q-TOF) (Q-TOF) indicated strong correlation across all 15 PST Image: www.uptodate.com Since the LC HPLC chip coupled to the Q-TOF mass spectrometer has a significant lower dead arrays for the identified peptides. Validating (S3) space between the enrichment and analytical columns when compared to the LTQ, we MS2 identifications back to the features will analyzed our BBMV samples using a similar approach as to our previous study, with the increase the correlation of the “true” Basolateral exception of SCX fractionation. The Z=2+ monoisotopic peaks when sorted by intensity identifications. indicated greater signal to noise ratios when compared to the LTQ for the similarly prepared samples. Peptide counts were significantly higher for the data acquired on the Q-TOF (not shown). Thermo LTQ Agilent Q-TOF 6520 The Results indicated significant differences between the two preparations. From this analysis, it was concluded that BBMV BBMV BBMV 7 Day Acidotic LC-MS2 Feature List (Q-TOF) BBMVCTX were derived primarily from the S3 segment and NET, Mass, BBMVPCT were derived from the S1/S2 segment of the Protein IDs Intensities Feature validation NET proximal tubule. Enriched in the S1/S2 segment, were 150 47 70 26 NET and mass error of the features indicate proteins involved in glycolysis/gluconeogenesis (KEGG). This alignment to the features developed for the AMT database. Continued work is necessary indicates the putative localization of a glycolytic complex at 1.SLC5A2 Cntrl to further optimize LC parameters to help to the apical region of the S1/S2 segment, in concordance with 2.ENO1 3.FBP1 Acidotic Acidotic obtain the best results from samples of a 4.Aldob Cntrl complex nature. current dogma for PCT cell function. Statistical Validation Validation ppm C. Q-TOF with HPLC chip performance, quantitation Our results had indicated that the LC front end significantly improved the ability to resolve peaks with fewer separation steps because of the dimensions of the C18 enrichment column and the analytical column, dead space, and the mass accuracy of the TOF MS Cortex Cortex (when compared to the LTQ. PCT IV. Conclusion Our results indicated that a combined approach BBMV BBMV utilizing both MS platforms may streamline identification and matching of features that represent differences in the abundance of peptides. Due to the mass accuracy of the Q-TOF together with the previously produced data from the LTQ, and the small size of the database representing our subset of the proteome, the features whose abundances are altered from one sample to the next can be statistically verified.