The Right Pill for JRuby Memory and Thread Issues: Eclipse Memory Analyzer
•Download as PPT, PDF•
0 likes•1,485 views

This document discusses memory and thread issues that can occur with JRuby applications and how Eclipse Memory Analyzer can help address them. It provides an overview of Ruby and JRuby, common problems like memory leaks and thread issues, and how the Memory Analyzer tool works. It then describes a JRuby extension plugin for Memory Analyzer that can produce readable Ruby stack traces from heap dumps to help debug issues. Further enhancements are discussed along with a call for feedback.

Recommended
Recommended
More Related Content
Similar to The Right Pill for JRuby Memory and Thread Issues: Eclipse Memory Analyzer
Similar to The Right Pill for JRuby Memory and Thread Issues: Eclipse Memory Analyzer (20)
Recently uploaded
Recently uploaded (20)
The Right Pill for JRuby Memory and Thread Issues: Eclipse Memory Analyzer
- 1. The Right Pill for JRuby Memory and Thread Issues: Eclipse Memory Analyzer Vladimir Pavlov Dimitar Giormov Memory Analyzer SAP Labs Bulgaria
- 2. AGENDA Ruby and JRuby The Headaches Eclipse Memory Analyzer The Pill Further Enhancements Q&A © SAP 2010 / Page 2
- 3. DISCLAIMER We are not experts in Ruby/JRuby Although we have (some) experience with those However, we have quite a lot of experience and track in Java and Eclipse Or at least we think so ;-) © SAP 2010 / Page 3
- 4. RUBY AND JRUBY Ruby is… Dynamic scripting language Object-oriented Focus on simplicity and productivity Elegant syntax, natural to read and easy to write JRuby is… 100% Java implementation of the Ruby programming language Interpreter running atop the JVM Generating Java bytecode (JIT compilation mode) Tight integration with Java © SAP 2010 / Page 4
- 5. THE HEADACHES Memory leaks Hard to debug and find the root cause Eventually lead to OOM errors Brings your system down Often not reproducible Thread issues Deadlocks Exhausted threads Waiting for an external resource – e.g. DB connection Application does not respond Whole system hangs © SAP 2010 / Page 5
- 6. THE HEADACHES – AGGRAVATED Adding JRuby into the picture… © SAP 2010 / Page 6
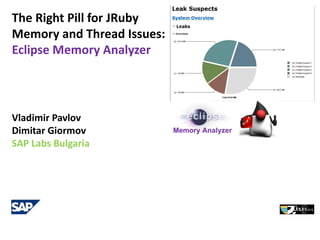
- 7. ECLIPSE MEMORY ANALYZER Eclipse Memory Analyzer (MAT) is… Java heap analyzer Memory Analyzer Helps find memory leaks and reduce memory consumption Query heap dumps via OQL Multi-Gigabyte Java Heap Dumps Are Nothing to Fear Now Soooo much faster than other tools, e.g. jhat Very little memory “overhead” for processing heap dumps (again – cf. jhat) Provides a report with automatically extracted leak suspects Supports Sun, SAP, HP, IBM JDKs 1.4.2 and above Could also process thread dumps and correlate data to provide additional details Highly extensible Open source © SAP 2010 / Page 7
- 8. THE PILL JRuby extension plugin for Eclipse Memory Analyzer Plugs into the heap dump processing by means of extension points <extension point="org.eclipse.mat.api.requestResolver"> <resolver impl="org.eclipse.mat.extension.jruby.RubyStacktraceDumper"> </resolver> <resolver impl="org.eclipse.mat.extension.jruby.JRubyScriptResolver"> </resolver> </extension> Looks for specific JRuby implementation objects in the heap @Subject("org.jruby.internal.runtime.RubyRunnable") @Subject("org.jruby.runtime.ThreadContext") Produces readable Ruby stack traces Memory Analyzer 1.1 snapshot/preview download © SAP 2010 / Page 8
- 9. FURTHER ENHANCEMENTS Producing hybrid Ruby/Java stack traces Thread dumps analysis Specific use case information, e.g. session data Automation … Feedback… Ideas… Contributions… … always welcome! https://dev.eclipse.org/mailman/listinfo/mat-dev http://www.eclipse.org/projects/project_summary.php?projectid=tools.mat © SAP 2010 / Page 9
- 10. © SAP 2010 / Page 10
- 11. THANK YOU! Memory Analyzer in: vpavlov t: @giormov