Stroke robot assisted therapy
•
1 like•547 views

Fisioterapia asistida por robot, en caso de Hemorragia cerebral

Recommended
Recommended
More Related Content
What's hot
What's hot (20)
Viewers also liked
Similar to Stroke robot assisted therapy
Similar to Stroke robot assisted therapy (20)
Recently uploaded
Recently uploaded (20)
Stroke robot assisted therapy
- 1. Yu-wei Hsieh, Ching-yi Wu, Keh-chung Lin, Grace Yao, Kuen-yuh Wu and Ya-ju Chang of Initial Motor Status Response Relationship of Robot-Assisted Stroke Motor Rehabilitation: The Impact−Dose Print ISSN: 0039-2499. Online ISSN: 1524-4628 Copyright © 2012 American Heart Association, Inc. All rights reserved. is published by the American Heart Association, 7272 Greenville Avenue, Dallas, TX 75231Stroke doi: 10.1161/STROKEAHA.112.658807 2012;43:2729-2734; originally published online August 14, 2012;Stroke. http://stroke.ahajournals.org/content/43/10/2729 World Wide Web at: The online version of this article, along with updated information and services, is located on the http://stroke.ahajournals.org//subscriptions/ is online at:StrokeInformation about subscribing toSubscriptions: http://www.lww.com/reprints Information about reprints can be found online at:Reprints: document.Permissions and Rights Question and Answerprocess is available in the Request Permissions in the middle column of the Web page under Services. Further information about this Once the online version of the published article for which permission is being requested is located, click can be obtained via RightsLink, a service of the Copyright Clearance Center, not the Editorial Office.Strokein Requests for permissions to reproduce figures, tables, or portions of articles originally publishedPermissions: by guest on May 20, 2014http://stroke.ahajournals.org/Downloaded from by guest on May 20, 2014http://stroke.ahajournals.org/Downloaded from
- 2. Dose–Response Relationship of Robot-Assisted Stroke Motor Rehabilitation The Impact of Initial Motor Status Yu-wei Hsieh, PhD; Ching-yi Wu, ScD; Keh-chung Lin, ScD; Grace Yao, PhD; Kuen-yuh Wu, PhD; Ya-ju Chang, PhD Background and Purpose—The increasing availability of robot-assisted therapy (RT), which provides quantifiable, reproducible, interactive, and intensive practice, holds promise for stroke rehabilitation, but data on its dose–response relation are scanty. This study used 2 different intensities of RT to examine the treatment effects of RT and the effect on outcomes of the severity of initial motor deficits. Methods—Fifty-four patients with stroke were randomized to a 4-week intervention of higher-intensity RT, lower-intensity RT, or control treatment. The primary outcome, the Fugl-Meyer Assessment, was administered at baseline, midterm, and posttreatment. Secondary outcomes included the Medical Research Council scale, the Motor Activity Log, and the physical domains of the Stroke Impact Scale. Results—The higher-intensity RT group showed significantly greater improvements on the Fugl-Meyer Assessment than the lower-intensity RT and control treatment groups at midterm (Pϭ0.003 and Pϭ0.02) and at posttreatment (Pϭ0.04 and Pϭ0.02). Within-group gains on the secondary outcomes were significant, but the differences among the 3 groups did not reach significance. Recovery rates of the higher-intensity RT group were higher than those of the lower-intensity RT group, particularly on the Fugl-Meyer Assessment. Scatterplots with curve fitting showed that patients with moderate motor deficits gained more improvements than those with severe or mild deficits after the higher- intensity RT. Conclusions—This study demonstrated the higher treatment intensity provided by RT was associated with better motor outcome for patients with stroke, which may shape further stroke rehabilitation. Clinical Trial Registration—URL: http://clinicaltrials.gov. Unique identifier: NCT00917605. (Stroke. 2012;43:2729-2734.) Key Words: randomized controlled trial Ⅲ robot-aided neurorehabilitation Ⅲ stroke Ⅲ treatment dosage Stroke remains a common cause of acquired adult disabil- ity worldwide.1,2 Motor deficits of the upper limb are often a devastating disability for stroke survivors3 and thus, the search for effective and efficient rehabilitation to promote motor recovery becomes urgent. Robot-assisted therapy (RT) is an innovative approach to stroke rehabilitation that uses intensive, repetitive, interactive, and individualized practice as an optimal strategy to enhance motor learning.4,5 The optimal dosage for specific rehabilitation regimens to induce improvement is unclear from current evidence.6 Be- cause the research suggests that intensive therapy has a positive influence on stroke recovery,7,8 RT may offer a good way to close the gap between limited rehabilitation resources and a greater amount of therapy.9 RT also provides precise and quantifiable control of therapy, allowing better research into treatment dosage.10 This critical factor—how the inten- sity of therapy influences the effects of RT—should be addressed to inform the dose–response relation and to seek proper treatment intensity for patients. Another emerging concern is which intervention is most beneficial for which type of patient under specific circum- stances.11 Identifying the factors affecting successful out- comes and the patients most likely to respond to the therapy would be informative for clinical guidelines. Although the initial motor status of patients with stroke is viewed as an important factor that influences recovery,12,13 whether this factor affects the outcomes of RT remains unknown. We therefore investigated the effects of RT on clinical outcomes in patients with chronic stroke by using higher-intensity and lower-intensity RT relative to a duration-matched control Received March 27, 2012; final revision received July 15, 2012; accepted July 18, 2012. From the School of Occupational Therapy (K.C.L.), College of Medicine, the Department of Psychology (G.Y.), and the Institute of Occupational Medicine and Industrial Hygiene (K.Y.W.), National Taiwan University, Taipei, Taiwan; the Departments of Occupational Therapy and Graduate Institute of Behavioral Science (Y.W.H., C.Y.W.) and Physical Therapy (Y.J.C.), Chang Gung University, Taoyuan, Taiwan; and the Division of Occupational Therapy, Department of Physical Medicine and Rehabilitation, National Taiwan University Hospital, Taipei, Taiwan (K.C.L.). Correspondence to Keh-chung Lin, ScD, School of Occupational Therapy, College of Medicine, National Taiwan University, 17, F4, Xu Zhou Road, Taipei, Taiwan 100. E-mail kehchunglin@ntu.edu.tw © 2012 American Heart Association, Inc. Stroke is available at http://stroke.ahajournals.org DOI: 10.1161/STROKEAHA.112.658807 2729 by guest on May 20, 2014http://stroke.ahajournals.org/Downloaded from
- 3. treatment (CT) and also examined whether the initial severity of motor deficits and the treatment intensities of RT interact to influence the primary outcome. Methods Participants Criteria for study participants were (1) more than 6 months’ onset from a unilateral stroke; (2) baseline upper extremity score on the Fugl-Meyer Assessment (FMA) of 26 to 56; (3) no excessive spasticity in forearm and wrist joints (modified Ashworth scale Ͻ3); (4) able to follow study instructions and perform study tasks (Mini-Mental Status Examination Ն22); (5) no upper limb fracture within 3 months or painful arthritis of the joints; and (6) no severe neuropsychologic impairments (eg, global aphasia or severe atten- tion deficits). The Institutional Review Boards of the participating hospitals approved the study, and all participants provided informed consent. Study Procedures This was a randomized-block controlled trial with pretest, midterm, and posttest evaluations. Eligible participants were stratified accord- ing to side of lesion and level of motor deficits and individually randomized to receive one of the 3 interventions. A random number table was used to generate randomization assignments, and a research assistant allocated the patients to an intervention group accordingly. All clinical measures were administered to the patients at baseline and immediately after the intervention by the same blinded rater. The primary outcome measure was also administered 2 weeks after treatment began (midterm). Interventions All participants received a duration-matched intervention for 90 to 105 minutes/day, 5 days/week for 4 weeks. The patients in the 2 RT groups practiced with the Bi-Manu-Track (Reha-Stim Co, Berlin, Germany; Figure 1), which allows 2 movement patterns: forearm pronation–supination and wrist flexion–extension.14 Each move- ment pattern is enabled by 3 computer-controlled modes: passive– passive (mode 1), active–passive (mode 2), and active–active mode (mode 3). The parameters of movement and resistance can be adjusted individually. The robot was equipped with a computer game to provide instant visual movement feedback and to increase participation. Within one training session, the patients in the higher-intensity RT group practiced 600 to 800 repetitions of modes 1 and 2 for 15 to 20 minutes and 150 to 200 repetitions of mode 3 for 3 to 5 minutes for bilateral forearm and wrist movements. One repetition indicated one movement direction. Patients in the higher-intensity RT received Figure 1. Bi-Manu-Track. 326 Patients with stroke were assessed for eligibility 54 Underwent randomization 272 Were excluded 232 Did not meet inclusion criteria 40 Refused to participate 18 Were assigned to lower-intensity robot-assisted therapy 18 Were assigned to control treatment 18 Were assigned to higher-intensity robot-assisted therapy 18 Completed study and 18 were analyzed 18 Completed study and 18 were analyzed 17 Completed study and 18 were analyzed 1 Drop out (due to hydronephrosis) Figure 2. Flow chart of participant enrollment. 2730 Stroke October 2012 by guest on May 20, 2014http://stroke.ahajournals.org/Downloaded from
- 4. twice the number of the repetitions per unit of time than patients in the lower-intensity RT group.15 Before the RT training, 5 minutes of mobilization warm-up were provided. After the training, the patients received 15 to 20 minutes of functional activities practice to help them transfer the acquired motor ability to their performance of daily activities. The CT group received an intensive therapist-administered control therapy matched in duration with the RT groups. Occupational therapy techniques used in the treatment protocols included neuro- developmental treatment, muscle strengthening, fine-motor training, and functional task training. Outcome Measures The primary outcome was a change in the FMA. The 33 upper extremity items of the FMA, with scores ranging from 0 to 66, were used to assess motor impairment.16 The reliability, validity, and responsiveness of the FMA in patients with stroke have been well established.16–18 Secondary outcomes included the following assessments: (1) the Medical Research Council scale, a reliable measurement ranging from 0 (no contraction) to 5 (normal power), examines muscle power of the affected arm19; (2) the Motor Activity Log consists of a 30-question interview in which patients rate the amount of use and quality of movements at the time of using their affected arm to accomplish daily activities20; and (3) the Stroke Impact Scale (SIS) 3.0 has 4 physical domains—strength, activities of daily living/ instrumental activities of daily living, mobility, and hand function— that use patient report to evaluate function and quality of life.21 Two common complications after stroke, pain and fatigue,22 were measured to investigate if intensive rehabilitation causes adverse effects. The therapist asked the patient to rate the severity of his or her pain and fatigue during the intervention on a scale of 0 (no pain and no fatigue) to 10 (unbearable pain and exhaustion). Statistical Analysis An intention-to-treat analysis was applied. Two-way repeated- measures analysis of covariance was used to evaluate efficacy of the primary outcome among the 3 groups followed by a post hoc analysis using the Bonferroni test for a significant effect. Analysis of covariance was used to evaluate treatment efficacy for the secondary outcomes with baseline scores as the covariates. The t test was used to examine recovery rates of each week on each outcome (ie, improved score divided by the number of weeks) between the 2 RT groups. We also examined whether the initial severity of motor impairments affected the primary outcome (ie, FMA). Scatterplots with quadratic curves were used to illustrate the relationship between the baseline scores and the change scores. Results The study enrolled 54 patients. One patient in the CT group dropped out due to a medical problem unrelated to the study treatment (Figure 2). The 3 groups did not differ significantly in baseline characteristics (Pϭ0.40–0.93; Table 1). As de- termined by the obtained effect size of the primary outcome, post hoc power was calculated to be 0.80. Primary Outcome On the FMA total score, there was a significant groupϫtime interaction effect (F3.4,83.8ϭ3.95, Pϭ0.01). All 3 groups showed significant within-group gains on the FMA total score from baseline to midterm and from baseline to post- treatment (all PϽ0.05; Table 2). Analysis of covariance revealed significant differences among the 3 groups at mid- term (F2,50ϭ6.97, Pϭ0.002) and at posttreatment (F2,50ϭ4.80, Pϭ0.01). Post hoc analyses showed that the higher-intensity RT group had significantly greater improve- ments on the FMA total score than the lower-intensity RT and CT groups at midterm (Pϭ0.003 and Pϭ0.02) and at post- treatment (Pϭ0.04 and Pϭ0.02; respectively; Table 2). No significant differences were found between the lower- intensity RT and CT groups at midterm and at posttreatment. A similar effect was also found on the FMA distal score (Table 2). Table 1. Baseline Characteristics of the Study Participants by Group (N)45؍ Characteristics* Higher- Intensity RT (nϭ18) Lower- Intensity RT (nϭ18) Control Treatment (nϭ18) P Value Age, y 56.51 (10.03) 52.21 (12.20) 54.83 (9.84) 0.49 Time after stroke, mo 28.67 (13.67) 23.28 (15.37) 22.44 (15.34) 0.40 Sex, no. Male 11 13 12 0.78 Female 7 5 6 Stroke subtype, no. Ischemic 12 11 9 0.73 Hemorrhagic 6 7 8 Subarachnoid 0 0 1 Side of stroke, no. Right 9 9 8 0.93 Left 9 9 10 MMSE score 28.50 (1.98) 28.00 (2.50) 28.28 (2.08) 0.79 FMA score 42.78 (8.86) 43.11 (9.18) 44.61 (11.06) 0.84 RT indicates robot-assisted therapy; MMSE, Mini-Mental State Examination; FMA, Fugl-Meyer Assessment. *Continuous data are presented as the mean (SD); categoric data are presented as indicated. Table 2. Descriptive Statistics and Group Comparisons on the Primary Outcome Outcome Higher- Intensity RT Mean (SD) Lower- Intensity RT Mean (SD) Control Treatment Mean (SD) FMA total score Baseline 42.78 (8.86) 43.11 (9.18) 44.61 (11.06) Midterm 46.06 (8.50)*†‡ 44.50 (9.69)* 46.33 (10.50)* Posttreatment 48.00 (8.22)*†‡ 46.33 (10.27)* 47.56 (10.50)* FMA distal score Baseline 12.56 (6.17) 11.44 (6.81) 13.39 (7.65) Midterm 14.00 (5.99)*‡ 12.22 (7.14)* 14.06 (7.67)* Posttreatment 15.17 (5.93)*‡ 13.06 (7.53)* 14.72 (7.51)* FMA proximal score Baseline 30.22 (4.01) 31.67 (3.96) 31.22 (4.60) Midterm 32.06 (3.76)* 32.28 (4.17) 32.28 (4.07)* Posttreatment 32.83 (3.62)* 33.28 (3.72)* 32.83 (4.25)* RT indicates robot-assisted therapy; FMA, Fugl-Meyer Assessment. With-group comparison: *PϽ0.05 when compared with baseline scores. Between-group comparison: †PϽ0.05 when the higher-intensity RT group score was greater than the lower-intensity RT group. ‡PϽ0.05, when the higher-intensity RT group score was greater than the control treatment group. Hsieh et al Dose–Response of Robot-Assisted Stroke Rehabilitation 2731 by guest on May 20, 2014http://stroke.ahajournals.org/Downloaded from
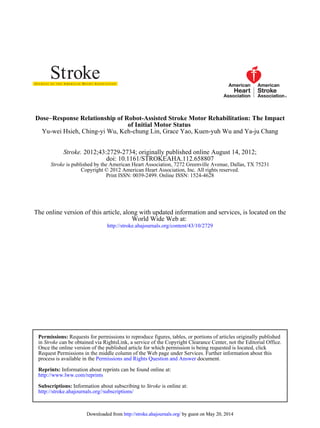
- 5. Secondary Outcomes and Adverse Responses The 3 groups made significant within-group improvements over time (all PϽ0.05) on the Medical Research Council and Motor Activity Log; however, the improvements were not significantly different among the 3 groups on the Medical Research Council (F2,50ϭ1.41, Pϭ0.25), the Motor Activity Log quality of movements (F2,50ϭ2.38, Pϭ0.10), or the Motor Activity Log amount of use (F2,50ϭ1.61, Pϭ0.21). The higher-intensity RT group reported significant within- group improvements on the SIS–strength (Pϭ0.002) and SIS – activities of daily living/instrumental activities of daily living (Pϭ0.02) assessments. The lower-intensity RT group had significant within-group improvements on the SIS– strength assessment (Pϭ0.02). The CT group, however, did not report significant improvements on the 4 SIS physical domains (Pϭ0.07–0.29). The between-group comparison did not show a significant difference among the 3 groups for gains on the 4 SIS physical domains (F2,50ϭ0.40–1.38, Pϭ0.26–0.67). The 3 groups showed mild ratings for fatigue and pain (mean score of Ͻ3 of 10 possible). Recovery Rates Recovery rates of the higher-intensity RT group on the FMA total and distal scores were significantly higher than those of the lower-intensity RT group at midterm and posttreatment (all PՅ0.05; Table 3). On the secondary outcomes, differ- ences in recovery rates between the 2 RT groups were not significant (Pϭ 0.10–0.86; Table 3); however, the recovery rate values for the higher-intensity RT group were generally higher than those for the lower-intensity RT group. Interaction Between Initial Motor Status and Treatment Intensity Figure 3 shows the relationships between patients’ baseline scores and change scores on the FMA. The data fit a quadratic function, and the critical point of the fitted curve in the higher-intensity RT group at posttreatment was calculated to be 38.41 by differentiating the equation of the curve (Figure 3); that is, patients with an FMA baseline score of approxi- mately 40 showed the most gains after the higher-intensity RT. In the lower-intensity RT group, patients with fewer motor deficits gained more benefits on the FMA; however, the general gains of this group were lower than the gains in the higher-intensity RT group. To summarize, the patients with motor deficits in the middle range (FMA score of approximately 40) had more improvement in motor ability after the higher-intensity RT than those with severe or mild motor deficits. Discussion The 3 treatment groups in this trial had significant within- group gains on the FMA, Medical Research Council, and Motor Activity Log, indicating that the patients benefited from the intervention in motor ability, muscle power, and self-perceived performance in daily activities. The 2 RT groups also reported significant improvements in the strength domain of the SIS over time. Between-group comparisons showed that the patients who received the higher-intensity RT had significant improvements in primary motor ability at midterm and posttreatment compared with those who re- ceived the lower-intensity RT or CT; however, the 2 RT protocols and the CT demonstrated comparable effects on improving the secondary outcomes. When these results were compared with those in the trial by Hesse et al,14 which used the same robotic device, the effects on the primary outcome (ie, FMA) were different. The treatment intensity of RT used in their study was similar to the lower-intensity RT used in this study. The RT group in the Hesse et al study, however, had significant benefits compared with the control group, whereas we did not find a significant difference between the lower-intensity RT and the CT. The differing results may be attributable to differences in treat- ment protocols of the control groups (electric stimulation versus conventional occupational therapy), stroke phases (subacute versus chronic), and baseline motor deficits of patients (severe versus mild to moderate). Moreover, the higher-intensity RT (twice as many repetitions as in the lower-intensity RT) of this study led to significant gains in motor ability compared with the other 2 groups. Our findings suggest that for patients with chronic stroke with mild to moderate motor deficits, the treatment intensity of RT using the Bi-Manu-Track can be higher than the original protocol14 to reach superior effects on motor recovery. Table 3. Recovery Rates of Each Week at Midterm and Posttreatment on the Outcomes Outcome Higher- Intensity RT Mean (SD) Lower- Intensity RT Mean (SD) P Value FMA total score Midterm 1.64 (1.12) 0.69 (0.52) 0.003 Posttreatment 1.31 (0.65) 0.81 (0.50) 0.01 FMA distal score Midterm 0.72 (0.43) 0.39 (0.40) 0.02 Posttreatment 0.65 (0.39) 0.40 (0.33) 0.05 FMA proximal score Midterm 0.92 (0.94) 0.31 (0.52) 0.02 Posttreatment 0.65 (0.46) 0.40 (0.46) 0.11 MRC Posttreatment 0.07 (0.09) 0.03 (0.05) 0.14 MAL-QOM Posttreatment 0.11 (0.12) 0.05 (0.09) 0.10 MAL-AOU Posttreatment 0.10 (0.09) 0.05 (0.09) 0.11 SIS–strength Posttreatment 2.00 (2.26) 2.17 (3.40) 0.86 SIS–ADL/IADL Posttreatment 1.17 (1.93) 0.43 (2.45) 0.32 SIS–mobility Posttreatment 0.62 (2.25) 0.26 (2.29) 0.63 SIS–hand function Posttreatment 2.67 (5.95) 1.07 (5.29) 0.40 RT indicates robot-assisted therapy; FMA, Fugl-Meyer Assessment; MRC, Medical Research Council scale; MAL-QOM, Motor Activity Log quality of movement; AOU, amount of use; SIS, Stroke Impact Scale; ADL/IADL, activities of daily living/instrumental ADL. 2732 Stroke October 2012 by guest on May 20, 2014http://stroke.ahajournals.org/Downloaded from
- 6. The study results for the functional-based or disability outcomes are concordant with previous RT studies23,24 that did not find significant differences between RT and control groups. Within-group analyses, however, showed that the 2 RT groups had significant gains in self-perceived amount of use and quality of movement of the affected hand in daily activities and in the strength domain of the SIS evaluation. These gains may be attributed to the additional 15 to 20 minutes of functional training per session in our RT proto- cols. The supplementary functional practice may be necessary to enhance functional performance but may not be sufficient for significant between-group differences compared with the CT. Most robotic devices are designed for the practice of relatively simple movements, and patients who train on them have some difficulty in transferring the gained motor ability to the performance of functional activities.25 Further ap- proaches may consider the combination of RT and task- oriented training (eg, constraint-induced therapy) in stroke rehabilitation to promote motor recovery and functional improvement. The recovery rate data suggest a trend for better motor outcome with the higher-intensity RT at midterm and post- treatment, indicating a dose–response relationship such that providing more intense RT may accelerate motor improve- ment for chronic stroke. Current findings support that highly intensive therapy tends to accelerate recovery.26 The midterm evaluation can provide more information about the dynamic response of patients during the treatment course; however, whether the intensity effect occurs mainly in the first half or throughout the entire period of the treatment course needs further research. For patients who have already reached a functional plateau at midterm, incorporating or receiving other interventions after midterm (eg, RT in sequential combination with constraint-induced therapy) might promote further improvement. The initial severity levels of the patients may influence the treatment effects on the primary outcome. The FMA is commonly used to identify the severity levels of patients with stroke.27–29 The relation of FMA baseline scores and change scores in this study was dependent on the intensity of RT treatment. As seen in the graph (Figure 3), patients with moderate motor deficits (ie, FMA score of approximately 40) showed more motor improvement after the higher-intensity RT than those with severe or mild deficits. However, there was a trend that the patients with fewer motor deficits in the lower-intensity RT group gained more benefits on the FMA. Further studies may examine the usefulness of the FMA cutoff score to more accurately stratify patients in RT trials. Some limitations of the study warrant consideration. Only one intermediate assessment was conducted during the study period. To more clearly define dose–response curves of RT, further investigation of the efficacy of RT on multiple intermediate data points is warranted. This study did not evaluate sensory function. Patients with sensory deficits who receive interactive RT with sensory inputs and feedback may benefit from RT.30 Further trials should assess the role of sensory function as a treatment outcome and potential mod- erator of the outcomes. Another study limitation is that the participants and the intervention providers were not blinded to the treatment group, which might have led to some bias. In conclusion, our study results support that treatment outcomes, especially in motor improvements, were better after the higher-intensity RT than after the other 2 interven- tions. Higher-intensity RT may be feasible in patients with Figure 3. The relationships of initial values and change scores on the Fugl-Meyer Assessment (FMA) for the 2 robot-assisted therapy groups. Scatterplots show the distribution of pretreatment and change scores on the FMA. Quadratic function was applied for curve fitting. The dotted lines show the critical point (38.41) of the fitted curve in the higher-intensity robot-assisted therapy (RT) group at posttreatment. Hsieh et al Dose–Response of Robot-Assisted Stroke Rehabilitation 2733 by guest on May 20, 2014http://stroke.ahajournals.org/Downloaded from
- 7. chronic stroke to accelerate the rate of motor recovery. Patients with moderate motor deficits tended to have more motor improvements after the higher-intensity RT than those with severe or mild motor deficits. The patient’s level of motor impairment should be considered when planning for robot-assisted stroke rehabilitation. Sources of Funding This project was supported in part by the National Health Research Institutes (NHRI-EX101-9920PI and NHRI-EX101-10010PI), the National Science Council (NSC-100-2314-B-002-008-MY3 and NSC 99-2314-B-182-014-MY3), and the Healthy Ageing Research Center at Chang Gung University (EMRPD1A0891) in Taiwan. Disclosures None. References 1. Lawrence ES, Coshall C, Dundas R, Stewart J, Rudd AG, Howard R, et al. Estimates of the prevalence of acute stroke impairments and disability in a multiethnic population. Stroke. 2001;32:1279–1284. 2. Muntner P, Garrett E, Klag MJ, Coresh J. Trends in stroke prevalence between 1973 and 1991 in the us population 25 to 74 years of age. Stroke. 2002;33:1209–1213. 3. Cramer SC. Changes in motor system function and recovery after stroke. Restor Neurol Neurosci. 2004;22:231–238. 4. Mirelman A, Bonato P, Deutsch JE. Effects of training with a robot- virtual reality system compared with a robot alone on the gait of indi- viduals after stroke. Stroke. 2009;40:169–174. 5. Brewer BR, McDowell SK, Worthen-Chaudhari LC. Poststroke upper extremity rehabilitation: a review of robotic systems and clinical results. Top Stroke Rehabil. 2007;14:22–44. 6. Wallace AC, Talelli P, Dileone M, Oliver R, Ward N, Cloud G, et al. Standardizing the intensity of upper limb treatment in rehabilitation medicine. Clin Rehabil. 2010;24:471–478. 7. Cooke EV, Mares K, Clark A, Tallis RC, Pomeroy VM. The effects of increased dose of exercise-based therapies to enhance motor recovery after stroke: a systematic review and meta-analysis. BMC Med. 2010;8:60. 8. Kwakkel G, van Peppen R, Wagenaar RC, Wood Dauphinee S, Richards C, Ashburn A, et al. Effects of augmented exercise therapy time after stroke: a meta-analysis. Stroke. 2004;35:2529–2539. 9. Teasell RW, Kalra L. What’s new in stroke rehabilitation: back to basics. Stroke. 2005;36:215–217. 10. Reinkensmeyer DJ, Emken JL, Cramer SC. Robotics, motor learning, and neurologic recovery. Annu Rev Biomed Eng. 2004;6:497–525. 11. Dobkin BH. Progressive staging of pilot studies to improve phase III trials for motor interventions. Neurorehabil Neural Repair. 2009;23:197–206. 12. Fritz SL, Light KE, Patterson TS, Behrman AL, Davis SB. Active finger extension predicts outcomes after constraint-induced movement therapy for individuals with hemiparesis after stroke. Stroke. 2005;36:1172–1177. 13. Lin KC, Huang YH, Hsieh YW, Wu CY. Potential predictors of motor and functional outcomes after distributed constraint-induced therapy for patients with stroke. Neurorehabil Neural Repair. 2009;23:336–342. 14. Hesse S, Werner C, Pohl M, Rueckriem S, Mehrholz J, Lingnau ML. Computerized arm training improves the motor control of the severely affected arm after stroke: a single-blinded randomized trial in two centers. Stroke. 2005;36:1960–1966. 15. Hsieh YW, Wu CY, Liao WW, Lin KC, Wu KY, Lee CY. Effects of treatment intensity in upper limb robot-assisted therapy for chronic stroke: a pilot randomized controlled trial. Neurorehabil Neural Repair. 2011;25:503–511. 16. Fugl-Meyer AR, Jaasko L, Leyman I, Olsson S, Steglind S. The post- stroke hemiplegic patient. 1. A method for evaluation of physical per- formance. Scand J Rehabil Med. 1975;7:13–31. 17. Platz T, Pinkowski C, van Wijck F, Kim IH, di Bella P, Johnson G. Reliability and validity of arm function assessment with standardized guidelines for the Fugl-Meyer Test, Action Research Arm Test and Box and Block Test: a multicentre study. Clin Rehabil. 2005;19:404–411. 18. Hsieh YW, Wu CY, Lin KC, Chang YF, Chen CL, Liu JS. Respon- siveness and validity of three outcome measures of motor function after stroke rehabilitation. Stroke. 2009;40:1386–1391. 19. Gregson JM, Leathley MJ, Moore AP, Smith TL, Sharma AK, Watkins CL. Reliability of measurements of muscle tone and muscle power in stroke patients. Age Ageing. 2000;29:223–228. 20. van der Lee JH, Beckerman H, Knol DL, de Vet HC, Bouter LM. Clinimetric properties of the Motor Activity Log for the assessment of arm use in hemiparetic patients. Stroke. 2004;35:1410–1414. 21. Duncan PW, Bode RK, Min Lai S, Perera S. Rasch analysis of a new stroke-specific outcome scale: the Stroke Impact Scale. Arch Phys Med Rehabil. 2003;84:950–963. 22. Yorkston KM, Johnson K, Boesflug E, Skala J, Amtmann D. Communi- cating about the experience of pain and fatigue in disability. Qual Life Res. 2010;19:243–251. 23. Housman SJ, Scott KM, Reinkensmeyer DJ. A randomized controlled trial of gravity-supported, computer-enhanced arm exercise for indi- viduals with severe hemiparesis. Neurorehabil Neural Repair. 2009;23: 505–514. 24. Volpe BT, Lynch D, Rykman-Berland A, Ferraro M, Galgano M, Hogan N, et al. Intensive sensorimotor arm training mediated by therapist or robot improves hemiparesis in patients with chronic stroke. Neurorehabil Neural Repair. 2008;22:305–310. 25. Rosati G. The place of robotics in post-stroke rehabilitation. Expert Rev Med Devices. 2010;7:753–758. 26. Kwakkel G. Impact of intensity of practice after stroke: issues for con- sideration. Disabil Rehabil. 2006;28:823–830. 27. Daly JJ, Hogan N, Perepezko EM, Krebs HI, Rogers JM, Goyal KS, et al. Response to upper-limb robotics and functional neuromuscular stimu- lation following stroke. J Rehabil Res Dev. 2005;42:723–736. 28. Luft AR, McCombe-Waller S, Whitall J, Forrester LW, Macko R, Sorkin JD, et al. Repetitive bilateral arm training and motor cortex activation in chronic stroke: a randomized controlled trial. JAMA. 2004;292: 1853–1861. 29. Thielman G, Kaminski T, Gentile AM. Rehabilitation of reaching after stroke: comparing 2 training protocols utilizing trunk restraint. Neurorehabil Neural Repair. 2008;22:697–705. 30. Sivan M, O’Connor RJ, Makower S, Levesley M, Bhakta B. Systematic review of outcome measures used in the evaluation of robot-assisted upper limb exercise in stroke. J Rehabil Med. 2011;43:181–189. 2734 Stroke October 2012 by guest on May 20, 2014http://stroke.ahajournals.org/Downloaded from