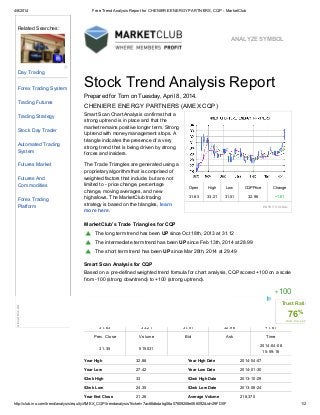
Stock Trend Analysis Report Prepared for Twin-c Vanilla SPilla on Tuesday, April 8, 2014. CHENIERE ENERGY PARTNERS (AMEX:CQP)
•
2 likes•658 views

Twin-c VAnilla SPilla is very BULLISH ON STOCK QUOTE CQP, here is a report touting its technical upward trend made with algorithmic formulas based on trading volume and buy orders versus sell. This report has a 72percent trust rating that in fact based on just the technical trends , not the fundamental, solely based on the technical portion of this stock, this report shows with great odds, that CQP will continue its upward trend. Final word.BULLISH BUY NOW!

Recommended
Recommended
More Related Content
Recently uploaded
Recently uploaded (20)
Featured
Featured (20)
Stock Trend Analysis Report Prepared for Twin-c Vanilla SPilla on Tuesday, April 8, 2014. CHENIERE ENERGY PARTNERS (AMEX:CQP)
- 1. 4/8/2014 Free Trend Analysis Report for CHENIERE ENERGY PARTNERS, CQP - MarketClub http://club.ino.com/trend/analysis/equity/AMEX_CQP/trendanalysis?ticket=7ac66dbdabg06a07809208e066092&id=29FD0F 1/2 ANALYZE SYMBOL Smart Scan Chart Analysis confirms that a strong uptrend is in place and that the market remains positive longer term. Strong Uptrend with money management stops. A triangle indicates the presence of a very strong trend that is being driven by strong forces and insiders. The Trade Triangles are generated using a proprietary algorithm that is comprised of weighted factors that include, but are not limited to - price change, percentage change, moving averages, and new highs/lows. The MarketClub trading strategy is based on the triangles, learn more here. Open High Low CQP Price Change 31.63 33.21 31.51 32.96 +1.61 ENTRY SIGNAL The long term trend has been UP since Oct 18th, 2013 at 31.12 The intermediate term trend has been UP since Feb 13th, 2014 at 28.99 The short term trend has been UP since Mar 28th, 2014 at 29.49 Stock Trend Analysis Report Prepared for Tom on Tuesday, April 8, 2014. CHENIERE ENERGY PARTNERS (AMEX:CQP) MarketClub’s Trade Triangles for CQP Smart Scan Analysis for CQP Based on a pre-defined weighted trend formula for chart analysis, CQP scored +100 on a scale from -100 (strong downtrend) to +100 (strong uptrend). +100 STRONG DOWNTREND SIDEWAYS STRONG UPTREND Open High Low Price Change 31.63 33.21 31.51 32.96 +1.61 Prev. Close Volume Bid Ask Time 31.35 515031 2014-04-08 15:59:16 Year High 32.88 Year High Date 2014-04-07 Year Low 27.42 Year Low Date 2014-01-30 52wk High 33 52wk High Date 2013-10-29 52wk Low 24.35 52wk Low Date 2013-06-24 Year End Close 21.26 Average Volume 218,370 Related Searches: Day Trading Forex Trading System Trading Futures Trading Strategy Stock Day Trader Automated Trading System Futures Market Futures And Commodities Forex Trading Platform ? AboutthisAd Trust Rating 76% club.ino.com
- 2. 4/8/2014 Free Trend Analysis Report for CHENIERE ENERGY PARTNERS, CQP - MarketClub http://club.ino.com/trend/analysis/equity/AMEX_CQP/trendanalysis?ticket=7ac66dbdabg06a07809208e066092&id=29FD0F 2/2 Shares Outstanding 274,872 Short Interest 341,593 % Institutional 1.8 Assets 532.5M Liabilities 155.4M Beta 1.37 Volatility 17.47 © Copyright 2014 MarketClub™ All rights reserved | User Agreement U.S. Government Required Disclaimer - Commodity Futures Trading Commission Futures and Options trading has large potential rew ards, but also large potential risk. You must be aw are of the risks and be w illing to accept them in order to invest in the futures and options markets. Don't trade w ith money you can't afford to lose. This is neither a solicitation nor an offer to Buy/Sell futures or options. No representation is being made that any account w ill or is likely to achieve profits or losses similar to those discussed on this w eb site. The past performance of any trading system or methodology is not necessarily indicative of future results. CFTC RULE 4.41 - HYPOTHETICAL OR SIMULATED PERFORMANCE RESULTS HAVE CERTAIN LIMITATIONS. UNLIKE AN ACTUAL PERFORMANCE RECORD, SIMULATED RESULTS DO NOT REPRESENT ACTUAL TRADING. ALSO, SINCE THE TRADES HAVE NOT BEEN EXECUTED, THE RESULTS MAY HAVE UNDER-OR-OVER COMPENSATED FOR THE IMPACT, IF ANY, OF CERTAIN MARKET FACTORS, SUCH AS LACK OF LIQUIDITY. SIMULATED TRADING PROGRAMS IN GENERAL ARE ALSO SUBJECT TO THE FACT THAT THEY ARE DESIGNED WITH THE BENEFIT OF HINDSIGHT. NO REPRESENTATION IS BEING MADE THAT ANY ACCOUNT WILL OR IS LIKELY TO ACHIEVE PROFIT OR LOSSES SIMILAR TO THOSE SHOWN. All trades, patterns, charts, systems, etc., discussed in this advertisement and the product materials are for illustrative purposes only and not to be construed as specific advisory recommendations. All ideas and material presented are entirely those of the author and do not necessarily reflect those of the publisher or INO.com. No system or methodology has ever been developed that can guarantee profits or ensure freedom from losses. No representation or implication is being made that using the MarketClub™ methodology or system w ill generate profits or ensure freedom from losses. The testimonials and examples used herein are exceptional results, w hich do not apply to the average member, and are not intended to represent or guarantee that anyone w ill achieve the same or similar results. Each individual's success depends on his or her background, dedication, desire, and motivation.