1. Whitepaper: Projecting Revenues for Apps
By Taaha Khan
Part I: Customer Acquisition and Retention
Anyone in the app industry knows about the very many key performance metrics commonly
discussed, thanks to the number of sources of information describing them - such as this report
from the Casual Games Association:
http://casualconnect.org/mag/summer2012/CGA_F2PGames_Report.pdf
But let's face it - not every knows the difference between ARPU and ARPPU, or the best way to
calculate user retention, for example.
In this whitepaper we take a detailed look at each of the app metrics that you want to show up on a
dashboard/ report card for your app business. A number of different approaches are used to arrive
at the bottom line and we'll briefly discuss these as well. (Warning: some readers might find the
discussion here annoyingly technical, so reader discretion is advised).
Before we go on, here's a simplified revenue projection sheet for a gaming app by GAMESbrief:
http://www.gamesbrief.com/2011/10/the-gamesbrief-free-to-play-game-forecasting-spreadsheet-
can-improve-the-revenue-of-your-game/.
The acquisition and retention framework here is not that sophisticated and much of the numbers
are hard-coded with a healthy dash of wishful thinking. Nevertheless, the model does provide a
basic framework for revenue projections, and probably bears some resemblance to generic
midrange apps.
Customer Acquisition and Retention is the starting point and the most important driver for any
projection. Straight off the bat, you need to get real when discussing the number of users you will
have, with a good benchmark for comparison.
Not every app can hope to be the next Angry Birds, but you might be able to claim (quite
optimistically) that you can match a Mafia Wars, for example, particularly if you already have a
number of successful gaming apps under your belt.
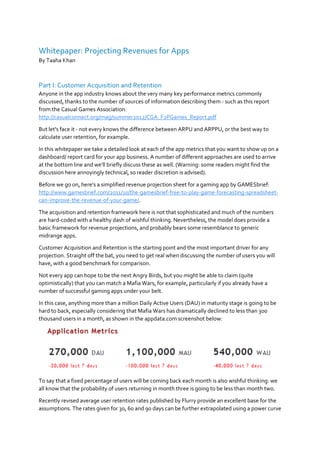
In this case, anything more than a million Daily Active Users (DAU) in maturity stage is going to be
hard to back, especially considering that Mafia Wars has dramatically declined to less than 300
thousand users in a month, as shown in the appdata.com screenshot below:
To say that a fixed percentage of users will be coming back each month is also wishful thinking: we
all know that the probability of users returning in month three is going to be less than month two.
Recently revised average user retention rates published by Flurry provide an excellent base for the
assumptions. The rates given for 30, 60 and 90 days can be further extrapolated using a power curve
2. to project what retention rates might look like into the future. For example, here is a curve we used
to model retention for a social gaming app:
Looking at the model, we know that out of every hundred users that downloaded the app, not more
than 15 will still be using the app a year later. Using this framework and an aging analysis, you will
find that the average life expectancy of the app keeps decreasing over time.
According to app-tracking company Distimo, it takes more than 25,000 downloads to reach the Top
50 ranking in the US on iOS, from data published at the end of 2011. As we will see later, not only
does this require a healthy infusion of marketing and a rock solid app, virality can play a key role and
will be an important factor to consider in justifying how many downloads you will get and what a
reasonable acquisition cost might be.
In the very first month you could say that existing users will use the app for another 20-30 days on
average, but a year later this might be reduced to a little over a week. The average lifetime of the
portfolio has strong implications for lifetime value (discussed later).
So depending on the number of downloads you expect to have and the applicable retention rate
cascading down from each month, you will be unlikely to have more than 20% of all the users who
ever downloaded the app to the present day using the app presently, as shown in the strata
diagrams below:
This is sort of consistent with the earlier discussed GAMESbrief model, though you might need to
recalibrate the retention in line with which category your app falls into. Moreover, a proper aging
analysis will reveal exactly how many Monthly Average Users (MAUs) are using the app in each
period.
3. Part II: Calculating Revenue
Assuming that you have a good idea about how many monthly users are going to be using your app,
calculating revenue is not all that hard. However, keep in mind that benchmarking your
expectations against what is already out there in terms of both users and revenues is an absolute
must to gain credibility - second only to an actual user base and evident growth patterns.
At this point, we might want to discuss two gaming metrics that are often confused: Average
Revenue Per User (ARPU) and Average Revenue Per Paying User (ARPPU). ARPU is simply your
revenue divided by the total number of users, but we know that most of our users never really pay
anything at all. ARPPU, on the other hand, tells us what our paying users shell out on average.
The gaming industry recognizes three kinds of buyers in general: whales, dolphins and minnows. As
the relative size of the species indicates, whales are the big boys that make the largest purchases.
Dolphins are somewhere between the whales and minnows, while the latter are the small fry. The
weighted average spend from the portfolio equals the ARPPU.
Casual Games Association talk about the split as 10:40:50, with whales outspending the rest by a
factor of 15 to 100. So if you say that the least anyone would pay is a dollar then whales can be
safely assumed to spend anywhere from $15 to $100. Keeping in mind the split, that would come to
an ARPPU somewhere between $10 to $70. The Casual Games Association mentions in its report
that ARPPU can vary immensely by region and by genre, so a Sci-Fi MMO in France might be
around $14.83 while US Mid-core Social Games are frequently as high as $105.13. Some more
comparisons are given below:
4. A list of more industry benchmarks are also given here by GAMESbrief:
http://www.gamesbrief.com/2011/11/arppu-in-freemium-games/
To calculate revenue from your monthly user base, you need to determine the total number of
purchases made. One of the metrics commonly used in the app world is DAU/ MAU, which means
the number of daily active users as a fraction of monthly average users. Once you know how many
users are using your app actively in a single day, applying a conversion rate on those users will give
you the total number of purchases made.
Saying about 20-30% of monthly users are daily active users used to be a good bet, but the latest
research from Flurry shows that users are probably using apps a lot more often, particularly in the
case of streaming music, dating, social networking and social game apps.
If you also have a good idea about what the average dollar value of a transaction is likely to be, then
revenue could be derived by multiplying this by the number of daily transactions. So we could
calculate monthly revenue as:
MAU X DAU/ MAU X [CONVERSION RATE] X [AVERAGE DOLLAR VALUE OF EACH TRANSACTION] X 30
For example, in the workings below, it is assumed that 25% of monthly users are actively daily and
5% of these make an average purchase of $1.50.
5. Alternatively, we could apply a conversion rate directly to the MAU and arrive straight at the
number of paying users in a month. Based on industry benchmarks discussed, we could calculate
monthly revenue by multiplying the number of paying users by the expected ARPPU:
MAU X [CONVERSION RATE] X ARPPU
In the example below, using the same conversion rate and number of users, we assume that
Average Revenue Per Paying User is $11.25 to use the above formula to arrive at total revenue.
To reconcile these two workings, we can furnish one missing piece of information: the average
number of transactions that a paying user makes in a month. Since ARPPU is $11.25 and expected
revenue per transaction is a dollar fifty, the number of transaction each paying user is expected to
make can be computed as $11.25/$1.5 = 8 transactions. This number seems to be within reasonable
expectations, particularly since most apps are used on average 3.7 times per week, or around 14.8
times in a month, according to the Flurry research mentioned earlier.
To order a spreadsheet model and business plan specific to your app business, please email us at
contact@qutbull-hoda.com and we will get back to you as soon as possible.