1. Oct Nov Dec
210,467 212,920 215,193
27,925 27,714 26,345
6,801 6,801 6,801
40,690 39,958 37,082
1,773 1,890 1,902
287,656 289,283 287,323
10.37% 10.43% 10.36%
71.51% 71.91% 71.42%
Oct Nov Dec
432,664 431,115 432,093
432,664 431,115 432,093
0 0 0
4,276,335 4,316,920 4,377,155
3,709,180 3,740,636 3,778,449
567,155 576,284 598,706
4,708,999 4,748,035 4,809,248
169.79% 171.19% 173.40%
Oct Nov Dec
8,830 8,544 8,226
3,217 3,248 2,620
12,047 11,792 10,846
69,546 73,842 78,223
81,593 85,634 89,069
2.94% 3.09% 3.21%
20.28% 21.29% 22.14%
Oct Nov Dec
2,495,880 2,577,054 2,139,588
89.99% 92.92% 77.14%
Oct Nov Dec
473,239 496,677 516,600
1,679,536 1,778,138 1,651,484
2,152,775 2,274,815 2,168,084
77.6% 82.0% 78.2%
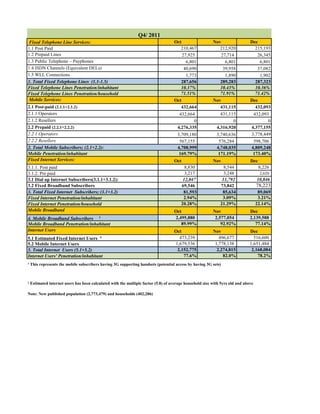
1.5 WLL Connections
Q4/ 2011
2.2.2 Resellers
2.2 Prepaid (2.2.1+2.2.2)
1.4 ISDN Channels (Equivalent DELs)
1. Total Fixed Telephone Lines (1.1-1.5)
Fixed Telephone Line Services:
1.1 Post Paid
1.2 Prepaid Lines
1.3 Public Telephone – Payphones
Fixed Telephone Lines Penetration/household
Mobile Services:
2.1 Post-paid (2.1.1+2.1.2)
2.2.1 Operators
2.1.1 Operators
2.1.2 Resellers
Fixed Telephone Lines Penetration/inhabitant
2. Total Mobile Subscribers; (2.1+2.2):
¹ This represents the mobile subscribers having 3G supporting handsets (potential access by having 3G sets)
3.1 Dial up Internet Subscribers(3.1.1+3.1.2):
Mobile Broadband
Fixed Internet Services:
3.1.1. Post paid
3.1.2. Pre paid
3. Total Fixed Internet Subscribers; (3.1+3.2)
3.2 Fixed Broadband Subscribers
5.1 Estimated Fixed Internet Users ²
4. Mobile Broadband Subscribers ¹
Mobile Penetration/inhabitant
Fixed Internet Penetration/inhabitant
Internet Users' Penetration/inhabitant
Note: New published population (2,773,479) and households (402,286)
Fixed Internet Penetration/household
Mobile Broadband Penetration/inhabitant
Internet Users
5.2 Mobile Internet Users
5. Total Internet Users (5.1+5.2)
² Estimated internet users has been calculated with the multiple factor (5.8) of average household size with 5yrs old and above