2. 2
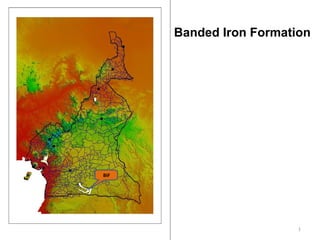
Based on the geological map of SW
Cameroon (scale 1:500,000) BIF
occurs as lenticular bodies in the
Precambrian greenstones. The
greenstone belt is divided into two
types:
1.Neo-Archaic – Paleproterozoic
basement; greenstone represented
with amphibolites, garnet gneiss and
eclogitic rocks.
2.Archaic basement; greenstones
represented with noritic gneiss, basic
and ultrabasic rocks.
There are a total of 14 BIF occurrences
in this region. The most significant BIFs
are represented as a large (Nkout hill)
and one smaller (Ngoa hill) lenticular
body.
Nkout
Ngoa
Objectives:
To evaluate the significance of Ngoa
and Nkout hill as a potential Fe
deposit and in the future all other BIF
occurances in the region
Carried out work:
1. Processing of remote sensing images
(Landsat and SRTM)
2. Detailed geological mapping
3. Sampling (soil and outrcrops/floats)
4. Laboratory analyses
- Chemistry,
- X-ray diffractometry
- Reflected light microscopy
1. Geological map, scale 1 : 500,000
2. SRTM image, 90 m resolution
3. Landsat ETM 7+
4. Topographic map, scale 1 : 200,000
5. Results of BIF exploration in the region of Ngao – Nkout
6. Airborne magnetometric map, as a RGB raster image
7. Chemical assays and XRD results of the collected BIF
samples
8. Soil assays from the Nkout grid for Au exploration
Basic facts
Interpretation based on:
4. 4
Processing of Landsat ETM images
“Geological combination”:
Bands 7 - 4 – 1
No significant spatial
correlation with the BIF lenses
or other geological information
due to the thick forest cover
5. 5
Processing of Landsat ETM images
NDVI over PC1
1.1. Minor spatial correlation
(deep red zones) with Nkout
and Ngoa Hills
2.2. Human activity very
evident: town, fields, roads, etc.
(tones of blue)
6. 6
SRTM
1. Field work showed that the
topographic map is not very
precise
2. The problem was solved
with the use of SRTM
images from which a new
topographic map was
constructed
7. 7
1
2
3
4
5
NgoaNkout
±
The 3D model (derived from SRTM) combined with the BIF lenses indicates
that Nkout and Ngoa are the most prominent hills. In general there is a
spatial correlation of all the BIF occurrences with the topography (hills)
8. 8
Location of samples collected from outcrops/floats (total: 44 samples)
In many cases it was impossible to determine if it was an outcrop or float.
Reconnaissance sampling and geological mapping
10. 10
Based on field observations and collected samples the BIF can be categorized, on the
basis of their macroscopic characteristics, into four basic types
M1: Massive hematite>magnetite >> quartz with poor
banding, medium grained, hematite flakes up to several
millimetres
M2: Banded hematite – quartz, typical BIF, more fine grained
then M1
M3: A brecciate mass with limonite groundmass
and angular to sub-angular fragments of hematite
M4: Completely oxidised BIF with or without visible banded structure
Macroscopic classification
11. 11
Type N LOI Al2O3 CaO Cr2O3 Fe2O3 K2O MgO MnO Na2O P2O5 SiO2 TiO2 Mineral comp
MC 1 17 5.17 3.93 0.01 0.03 88.3 0.01 0.03 0.05 0.03 0.36 1.97 0.11Hm>Mg>FeO>>Q
MC 2 9 9.23 8.19 0.01 0.02 79.1 0.01 0.02 0.09 0.03 0.35 2.89 0.15FeO>Ge
MC 3 10 1.02 0.25 0.01 0.03 59 0.01 0.03 0.08 0.03 0.07 39.5 0.01Hm<>Q
MC 4 2 1.05 0.23 0.02 0.07 22.3 0.01 0.03 0.06 0.03 0.12 76.1 0.01Q>Hm
Hm = hematite; Mg = magnetite; FeO= Fe oxides/hydroxides; Ge = goethite; Gi = gibbsit; Q = quartz
Mineralogical - Chemical Classification
Mean values for analysed elements
Bar chart of means
Basic comments on the oxide
contents:
1.The content of Fe2
O3
drops from Type
MC1 to Type MC4
2.The P2
O5
content is approximately the
same in Types MC1 & MC2 and lower in
Types MC3 & MC4. This most probably
reflects the geochemical processes
during the oxidation of the BIF where
phosphorus was leached out.
3.The SiO2
content is highest in Type 4
and lowest in Type 1.
Relation: Mineralogy+Chemistry - Macroscopic
MC 1 ≈ M1
MC 2 ≈ M3+M4
MC 3 ≈ M2
MC 4 ≈ M2
17. 17
Lanthanum clearly has a negative spatial
correlation with the relief and geology. A
trend of low values clearly follows the
ridges of the hills. All high values are in the
region of the greenstone
18. 18
Scandium exhibits a very
interesting zone of elevated
values that are located in the
eastern part of Nkout Hill and
practically represent a ring zone
around the hill (in the sense of
altitude).
19. 19
Cu – Au
Only a small part of the
samples (106) showed
concentrations of Au
above the lower detection
limit of ICP-MS. The high
values are mainly
concentrated in the
eastern part of the grid