Call Girls In Connaught Place Delhi ❤️88604**77959_Russian 100% Genuine Escor...
AECOM Water Leadership w KeyBanc Final.pdf
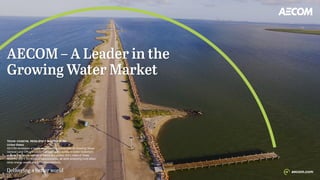
1. TEXAS COASTAL RESILIENCY MASTER PLAN
United States
AECOM developed a long-term, statewide master plan for directing Texas’
General Land Office’s coastal management priorities to better implement
projects that would restore, enhance and protect 367+ miles of Texas
coastline and 3,300 miles of bays/estuaries, all while protecting multi-billion
dollar energy assets and 6.7 million residents.
2. Forward-Looking Statements
All statements in this communication other than statements of historical fact are “forward-looking statements” for purposes of federal and state securities laws, including any statements of the plans, strategies
and objectives for future operations, profitability, strategic value creation, coronavirus impacts, risk profile and investment strategies, and any statements regarding future economic conditions or performance,
and the expected financial and operational results of AECOM. Although we believe that the expectations reflected in our forward-looking statements are reasonable, actual results could differ materially from
those projected or assumed in any of our forward-looking statements. Important factors that could cause our actual results, performance and achievements, or industry results to differ materially from estimates
or projections contained in our forward-looking statements include, but are not limited to, the following: our business is cyclical and vulnerable to economic downturns and client spending reductions; impacts
caused by the COVID-19 coronavirus pandemic, economic instability and market volatility, including the reaction of governments such as any prolonged period of travel, commercial or other similar restrictions,
the delay in commencement, or temporary or permanent halting of construction, infrastructure or other projects, requirements that we remove our employees or personnel from the field for their protection, and
delays or reductions in planned initiatives by our governmental or commercial clients or potential clients; losses under fixed-price contracts; limited control over operations run through our joint venture entities;
liability for misconduct by our employees or consultants; failure to comply with laws or regulations applicable to our business; maintaining adequate surety and financial capacity; potential high leverage and
inability to service our debt and guarantees; ability to continue payment of dividends; exposure to political and economic risks in different countries, including tariffs; currency exchange rate and interest
fluctuations; retaining and recruiting key technical and management personnel; legal claims; inadequate insurance coverage; environmental law compliance and adequate nuclear indemnification; unexpected
adjustments and cancellations related to our backlog; partners and third parties who may fail to satisfy their legal obligations; AECOM Capital real estate development projects; managing pension cost;
cybersecurity issues, IT outages and data privacy; risks associated with the expected benefits and costs of the sale of our Management Services and self-perform at-risk civil infrastructure, power construction
and oil and gas construction businesses, including the risk that any contingent purchase price adjustments from those transactions could be unfavorable and result in lower aggregate cash proceeds and any
future proceeds owed to us under those transactions could be lower than we expect; as well as other additional risks and factors that could cause actual results to differ materially from our forward-looking
statements set forth in our reports filed with the Securities and Exchange Commission. Any forward-looking statements are made as of the date hereof. We do not intend, and undertake no obligation, to update
any forward-looking statement.
Non-GAAP Financial Information
This communication contains financial information calculated other than in accordance with U.S. generally accepted accounting principles (“GAAP”). The Company believes that non-GAAP financial measures
such as adjusted EPS, adjusted EBITDA, adjusted net/operating income, adjusted tax rate, net service revenue and free cash flow provide a meaningful perspective on its business results as the Company
utilizes this information to evaluate and manage the business. We use adjusted EBITDA, adjusted EPS, adjusted net/operating income and adjusted tax rate to exclude the impact of certain items, such as
amortization expense and taxes to aid investors in better understanding our core performance results. We use free cash flow to represent the cash generated after capital expenditures to maintain our business.
We present net service revenue to exclude subcontractor costs from revenue to provide investors with a better understanding of our operational performance. We present segment adjusted operating margin to
reflect segment operating performance of our Americas and International segments, excluding AECOM Capital.
Our non-GAAP disclosure has limitations as an analytical tool, should not be viewed as a substitute for financial information determined in accordance with GAAP, and should not be considered in isolation or
as a substitute for analysis of our results as reported under GAAP, nor is it necessarily comparable to non-GAAP performance measures that may be presented by other companies. A reconciliation of these
non-GAAP measures is found in the Regulation G Information tables at the back of this release.
Disclosures
Page 1
3. professionals
We deliver professional services throughout the project
lifecycle – from advisory, planning, design and
engineering to program and construction management.
Across the globe, we partner with our clients in the
public and private sectors to solve their most complex
challenges and pioneer innovative solutions.
Fortune World’s Most
Admired 8 years in a row,
including #1 in our industry
for a second consecutive year in 2022
ranked transportation
& facilities design firm,
and environmental
engineering & science
firm
4. - Strengthening learning and
leadership development programs
- Launching Career Paths and
attracting industry luminaries
- Extending Centers of Excellence
- Winning what matters
- Prioritizing strategic opportunities
- Expanding advisory and program
management businesses
- Implementing regional
ED&I targets
- Advancing ESG Advisory
and ScopeX initiatives
- Differentiating from peers
through Digital AECOM
- Adopting global digital
delivery solutions
- Commercializing digital
hosted services
Page 3
5. Global Water Business Snapshot
Page 4
POSITIONED TO DRIVE SUBSTANTIAL GROWTH IN THE WATER BUSINESS IN THE COMING YEARS
Top 3 in All Key Water Markets Attractive Client Base Industry-Leading Talent Base Complementary Portfolio Mix
In the top three of all critical
market sectors as ranked by ENR
in 2022
Blue-chip client base and strong
existing relationships provide for
sizable growth opportunities
Benefitting from deep technical
expertise with a proven ability to
deliver some of the most complex
and sustainable water projects in
the world
Water is a critical element of our
market exposure, and features a
balanced mix of clients
% of FY’22 NSR1
45%
30%
11%
6%
5%
3% Engineers
Scientists
Program & Project Managers
Digital Experts
Consultants
Other
Dams & Reservoirs
Wastewater Treatment Plants
Water Transmission
Aqueducts
Water Supply
Sewer & Waste
Water Treatment &
Desalination
14%
38%
3%
44%
Federal
State/Local
Non-US Gov't
Private Funds
% of FY’22 Environment +
Water NSR1
Total Water &
Environment
Professionals
6. Key Demand Drivers Support Strong Long-Term Growth Opportunities
Page 5
Sustainability and
Infrastructure Resilience
• Increasingly severe climate events
underpin the urgency of achieving
resilience for cities
• Key to adapt and strengthen
infrastructure to promote resiliency
and grow with a focus on
sustainability
Carbon Emissions and
Social Outcomes
• 4% of global electricity is for water
• Increased focus on carbon
emissions and social outcomes:
regulations, commitments,
stakeholders
• Federal requirements for funding
stipulating benefit for underserved
communities (e.g., IIJA+Justice40)
Global Population Growth,
Urbanization and Need for
Modernization
• Global population expected to
grow to nearly 10 billion by 2050,
over 70% of which will be in cities
• Investments in modernization to
support growth and urbanization
are essential
Substantial Infrastructure
Investment & Jobs Act
Funding
• The IIJA committed more than
$90 billion of incremental
funding specifically to address
drinking water, wastewater,
water resources and water
related resiliency programs
Net Zero Carbon Neutral Targets in Place
U.S. Cities with
Climate Action
Plans
Total IIJA Water
Funding
FEMA and USACE
programs
Drinking water and
wastewater infrastructure
Lead replacement
Per- and Polyfluoroalkyl
Substances (PFAS)
ADDITIONAL GROWTH DRIVERS: ✓ Public & Environmental Health ✓ Funding & Staffing ✓ Digital Transformation
7. Strategic Growth Market: Drought Response and Mitigation
Page 6
CASE STUDY: PADRE DAM EAST COUNTY ADVANCED WATER
PURIFICATION
• Signature Win in a High Growth Market: We have been selected by
the Padre Dam Municipal Water District in San Diego, CA for a key
water re-use project that serves a signature win in a market with
substantial expected growth to address persistent droughts.
• Advancing Sustainability and Resilience: The team will create a
new, local, sustainable, and drought-proof drinking water supply using
state-of-the-art technology that provides a more efficient and
technically advanced engineering solution.
• Highly Efficient Water Recycling: The facility is expected to recycle
up to 95% of water through-put, which is a world-class level well ahead
of other facilities, and is expected to generate up to 11.5 million gallons
of purified water per day – diversifying the region’s water supply, and
reducing dependence on imported water.
• Why We Won: We brought world-class technical innovation to bear
with a proven track record of delivery, including an unparalleled history
of execution in wastewater treatment and advanced water purification
facilities.
California is investing more than $10 billion in initiatives to modernize water infrastructure, respond to emergency
drought and improve water conservation to stretch water supplies.
8. Strategic Growth Market: Disaster Response and Resilience
CASE STUDY: FEMA RISKMAP – PRODUCTION AND TECHNICAL
SERVICES
• Substantial Recapture Win: Selected to provide engineering and
consulting services in support of FEMA’s National Flood Insurance
Program.
• Key Disaster Response and Resilience Work: Scope of work will
include generating and evaluating flood hazard and risk information, as
well as supporting the development and implementation of mitigation,
planning, flood mapping and modeling activities.
• Regained Significant Market Share with this Client: With this key
recapture, combined with additional awards with this client in the last
year, we have regained significant ground with this client and are well
positioned as one their major consultancies.
• Why We Won: By combining our industry-leading water and Program
Management capabilities, we brought a unique competitive capability to
the client. In addition, through our digital tools, we created a more
efficient approach to several elements of the project.
More than $50 billion of resilience funding was included in the Infrastructure Investment and Jobs Act (IIJA), including
dedicated funding for many of our key federal clients, which presents substantial growth opportunities
9. Strategic Growth Market: Sustainability and Net Zero Emissions
CASE STUDY: NYC DEPARTMENT OF ENVIRONMENTAL PROTECTION
• Substantial Multi-Year Capital Plan: The NYCDEP has a mandate to
reduce emissions by 40% by 2025, 50% by 2030 and 80% by 2050, with
the goal of being energy neutral in 2050, as part of a $25 billion, 10-year
capital spending plan.
• Comprehensive Client Engagement: We are advising on three key
initiatives – conservation to reduce electricity usage, technology to reduce
power through operations and maintenance, and more efficient energy
production.
• Our work includes:
– Development of long-term utilization strategies for wind, solar and
other energy sources.
– Evaluation of anaerobic digester gas.
– Review of opportunities to convert biosolids for carbon neutrality.
• Why We Won: We build on the deep expertise and experience we have
with the client’s existing infrastructure. We were uniquely able to deliver
the client’s carbon reduction ambitions across its portfolio, including
through the integration of world-class digital scenario planning tools.
Our clients are pursuing increasingly ambitious sustainability and resilience objectives to modernize infrastructure,
enhance efficiency and achieve net zero emissions, all of which we are ideally positioned to advise our clients
Page 8
10. Expanding Our Digital AECOM Offering with PipeInsights
– Improves accuracy, speed and efficiency of sewer
inspection programs
– Artificial Intelligence (AI) for:
– Validation: assesses accuracy of coding
– Detection: uncoded pipe or missed codes
– Cloud-based service on Azure
– Store inspections and access them
anywhere; no software to install or maintain
– Quickly view inspection history and diagnose
problems
– GIS interface to quickly locate inspections
– Delivers actionable insights in hours, not weeks
– Accelerates data collection, investment planning,
asset delivery and emergency response
Page 9
12. $18.1B
$19.0B
Recent Key Performance Highlights
Highest Organic Growth in
More than a Decade
Winning Work at a Record
Rate
Translating Growth to the
Bottom Line
Maximizing Value for
Shareholders
We delivered 9% organic NSR1 growth
in the design business in the fourth
quarter.
With the eighth consecutive year of
cash flow within our guidance range,
we returned nearly $500 million to
shareholders through share
repurchases and dividends.
Industry-leading margins, combined
with accelerating organic growth, is
translating to the bottom line, which is
enabling investments in our teams to
capitalize on substantial growth
opportunities.
Reflecting the realization of our
strategy, win rates are at an all-time
and we delivered record full year wins
in the design business, contributing to
a record design backlog on a constant
currency basis.
Segment Adjusted4 Operating Margin6
FY’22 Repurchases
and Dividends
WITH OUR OUTPERFORMANCE, WE ARE CONFIDENT IN DELIVERING ON OUR LONG-TERM COMMITMENTS
Page 11
FY’22 Book-to-Burn3
Q4’22 Total
Backlog Growth2
Share Count Reduction Since
Repurchases Began in Sept’ 20
FY’22 Constant-Currency
Adjusted4 EBITDA5
Growth
FY’22 Constant-Currency
Adjusted4 EPS Growth
Q4’22 Design
NSR1 Growth
Consecutive Quarter of
Organic NSR1 Growth
Q4’21 Q4’22
Total Design Backlog
8.7%
10.7%
12.3%
13.8%
14.2%
FY'18
FY'19
FY'20
FY'21
FY'22
13. As a Professional Services Business, AECOM Is Poised to Thrive
Focused on our core higher-returning and lower-risk businesses
Leader in key transportation, water and environment markets and ideally positioned to advise clients on their ESG priorities
Strengthened financial profile with transformed balance sheet and returning capital to shareholders
Capitalizing on market leading positions, substantial backlog and ongoing continuous improvement initiatives to drive long-
term profitable growth
Attractive Exposure
to Key End Markets
Balanced Geographic
Exposure
Diverse
Funding Sources
Deep Technical
Expertise
Lower-Risk
Business Model
U.S.
Europe,
Middle East &
India
Asia Pacific
Canada
Cost-Plus Design
Fixed-Price Design
Construction
Management
Private
Non-U.S.
Governments
State & Local
Governments
Federal U.S.
Government
Transportation
Facilities
Environment /
Water
New Energy
36%
33%
28%
3%
52%
39%
9%
44%
24%
24%
8%
53%
22%
19%
6%
All financial information is presented as a percentage of FY’22 Segment 6 NSR1.
41%
16%
13%
10%
20%
Engineers
Program
Managers
Consultants /
Planners
Scientists
Design, Digital
& Other
Page 12
14. Footnotes
1 Revenue, less pass-through revenue; growth rates are presented on a constant-currency basis.
2 On a constant-currency basis.
3 Book-to-burn ratio is defined as the dollar amount of wins divided by revenue recognized during the period, including revenue related to work performed in unconsolidated
joint ventures.
4 Excludes the impact of certain items, such as restructuring costs, amortization of intangible assets and other items. See Regulation G Information for a reconciliation of
Non-GAAP measures.
5 Net income before interest expense, tax expense, depreciation and amortization.
6 Reflects segment operating performance, excluding AECOM Capital.
Page 13
15. Regulation G Information
Page 14
Reconciliation of Revenue to Net Service Revenue (NSR)
Three Months Ended Twelve Months Ended
Sep 30,
2021
Jun 30,
2022
Sep 30,
2022
Sep 30,
2021
Sep 30,
2022
Americas
Revenue $ 2,582.2 $ 2,457.0 $ 2,618.9 $ 10,226.3 $ 9,939.3
Less: Pass-through revenue 1,662.4 1,530.7 1,671.4 6,629.4 6,228.2
Net service revenue $ 919.8 $ 926.3 $ 947.5 $ 3,596.9 $ 3,711.1
International
Revenue $ 771.2 $ 784.2 $ 806.8 $ 3,112.6 $ 3,206.7
Less: Pass-through revenue 152.3 146.4 165.3 603.1 609.0
Net service revenue $ 618.9 $ 637.8 $ 641.5 $ 2,509.5 $ 2,597.7
Segment Performance (excludes ACAP)
Revenue $ 3,353.4 $ 3,241.2 $ 3,425.7 $ 13,338.9 $13,146.0
Less: Pass-through revenue 1,814.7 1,677.1 1,836.7 7,232.5 6,837.2
Net service revenue $ 1,538.7 $ 1,564.1 $ 1,589.0 $ 6,106.4 $ 6,308.8
Consolidated
Revenue $ 3,353.8 $ 3,241.7 $ 3,426.1 $ 13,340.9 $13,148.2
Less: Pass-through revenue 1,814.7 1,677.1 1,836.7 7,232.5 6,837.2
Net service revenue $ 1,539.1 $ 1,564.6 $ 1,589.4 $ 6,108.4 $ 6,311.0
Reconciliation of Net Cash Provided by Operating Activities to Free Cash Flow
Three Months Ended Twelve Months Ended
Sep 30,
2021
Jun 30,
2022
Sep 30,
2022
Sep 30,
2021
Sep 30,
2022
Net cash provided by operating activities $ 318.1 $ 204.9 $ 315.6 $ 704.7 $ 713.7
Capital expenditures, net (19.1) (22.0) (58.2) (121.5) (128.1)
Free cash flow $ 299.0 $ 182.9 $ 257.4 $ 583.2 $ 585.6
Three Months Ended Twelve Months Ended
Sep 30,
2021
Jun 30,
2022
Sep 30,
2022
Sep 30,
2021
Sep 30,
2022
Reconciliation of Segment Income from Operations to Adjusted Income from Operations
Americas Segment:
Income from operations $ 178.1 $ 167.5 $ 169.5 $ 643.0 $ 653.8
Amortization of intangible assets 4.4 4.3 4.4 17.4 17.4
Adjusted income from operations $ 182.5 $ 171.8 $ 173.9 $ 660.4 $ 671.2
International Segment:
Income from operations $ 43.6 $ 55.8 $ 57.6 $ 177.0 $ 221.2
Amortization of intangible assets 2.3 0.3 0.3 5.2 1.4
Adjusted income from operations $ 45.9 $ 56.1 $ 57.9 $ 182.2 $ 222.6
Segment Performance (excludes ACAP):
Income from operations $ 221.7 $ 223.3 $ 227.1 $ 820.0 $ 875.0
Amortization of intangible assets 6.7 4.6 4.7 22.6 18.8
Adjusted income from operations $ 228.4 $ 227.9 $ 231.8 $ 842.6 $ 893.8
16. Regulation G Information
Page 15
Three Months Ended Twelve Months Ended
Sep 30,
2021
Jun 30,
2022
Sep 30,
2022
Sep 30,
2021
Sep 30,
2022
Reconciliation of Net Income Attributable to AECOM from Continuing Operations per Diluted Share to
Adjusted Net Income Attributable to AECOM from Continuing Operations per Diluted Share
Net income attributable to AECOM from continuing
operations – per diluted share $ 0.65 $ 0.75 $ 0.82 $ 1.97 $ 2.73
Per diluted share adjustments:
Restructuring costs 0.09 0.09 0.13 0.33 0.75
Amortization of intangible assets 0.05 0.03 0.03 0.15 0.13
Prepayment premium on debt - - - 0.79 -
Financing charges in interest expense 0.01 0.01 0.01 0.08 0.03
Tax effect of the above adjustments* (0.04) (0.03) (0.05) (0.35) (0.17)
Valuation allowances and other tax only items 0.05 0.01 (0.05) (0.15) -
Adjusted net income attributable to AECOM from continuing
operations per diluted share $ 0.81 $ 0.86 $ 0.89 $ 2.82 $ 3.47
Weighted average shares outstanding – basic 143.8 140.6 139.6 147.3 140.8
Weighted average shares outstanding – diluted 146.6 142.2 141.3 149.7 142.7
* Adjusts the income taxes during the period to exclude the impact on our effective tax rate of the pre-tax adjustments shown above.
Reconciliation of Net Income Attributable to AECOM from Continuing Operations to EBITDA to
Adjusted EBITDA and to Adjusted Income from Operations
Net income attributable to AECOM from continuing
operations $ 95.1 $ 106.9 $ 115.4 $ 294.7 $ 389.1
Income tax expense 46.1 44.5 33.0 89.0 136.1
Depreciation and amortization 46.9 41.3 44.1 176.9 170.2
Interest income2 (2.0) (2.8) (2.3) (6.7) (8.2)
Interest expense 25.8 27.4 33.3 238.3 110.3
Amortized bank fees included in interest expense (1.2) (1.2) (1.2) (11.4) (4.8)
EBITDA $ 210.7 $ 216.1 $ 222.3 $ 780.8 $ 792.7
Restructuring costs 14.1 12.3 18.6 48.9 107.6
Adjusted EBITDA $ 224.8 $ 228.4 $ 240.9 $ 829.7 $ 900.3
Other income (5.8) (4.3) (3.7) (17.6) (14.2)
Depreciation1
(39.1) (35.5) (38.3) (143.4) (146.9)
Interest income2 2.0 2.8 2.2 6.7 8.1
Noncontrolling interests in income of consolidated
subsidiaries, net of tax 8.9 8.5 6.0 25.0 25.5
Amortization of intangible assets included in NCI,
net of tax 0.2 0.1 0.1 0.6 0.4
Adjusted income from operations $ 191.0 $ 200.0 $ 207.2 $ 701.0 $ 773.2
1 Excludes depreciation from discontinued operations
2 Included in other income