Successfully reported this slideshow.
Your SlideShare is downloading. ×

Market_Pulse_19_9_2022.pdf

Ad
Ad
Ad
Ad
Ad
Ad
Ad
Ad
Ad
Ad
Ad
Upcoming SlideShare
20 July Daily market report
Loading in …3
×

Check these out next

1 of 19 Ad

More Related Content

Similar to Market_Pulse_19_9_2022.pdf (20)

Recently uploaded (20)

Advertisement

Market_Pulse_19_9_2022.pdf

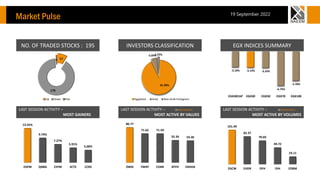
  1. 1. NO. OF TRADED STOCKS : 195 INVESTORS CLASSIFICATION EGX INDICES SUMMARY LAST SESSION ACTIVITY – MOST GAINERS LAST SESSION ACTIVITY – IN MM POUNDS MOST ACTIVE BY VALUES LAST SESSION ACTIVITY – IN MM SHARES MOST ACTIVE BY VOLUMES -3.10% -3.13% -3.24% -6.76% -5.78% EGX30CAP EGX30 EGX50 EGX70 EGX100 86.77 71.62 71.59 55.34 54.36 ZMID FWRY COMI BTFH EKHOA 101.49 82.37 70.03 49.72 23.11 DSCW EHDR OFH OIH EDBM 13.55% 9.74% 7.27% 5.91% 5.00% EDFM QNBA CEFM SCTS CCRS 17 176 2 Up Down Flat 91.99% 6.09% 1.92% Egyptians Arab Non-Arab Foreigners Market Pulse 19 September 2022
  2. 2. EGX30 – 9,763.19  ‫مصر‬ ‫بورصة‬ ‫مؤشر‬ EGX30 ‫إنخفض‬ ‫بنسبة‬ ‫األخيرة‬ ‫جلسته‬ ‫في‬ 3.13 .%  ‫مؤشر‬ ‫بورصة‬ ‫مصر‬ EGX30 ‫قد‬ ‫تراجع‬ ‫ليغلق‬ ‫أدنى‬ ‫من‬ ‫الحد‬ ‫األدنى‬ ‫لنموذج‬ ‫القناة‬ ،‫السعرية‬ ‫كما‬ ‫أغل‬ ‫ق‬ ‫أيضا‬ ‫دون‬ ‫مستوى‬ ‫الدعم‬ ‫األفقي‬ 9820 ،‫نقطة‬ ‫ولذلك‬ ‫فبقائه‬ ‫أدنى‬ ‫من‬ ‫ذلك‬ ‫المستوى‬ ‫سوف‬ ‫يدفع‬ ‫به‬ ‫لمز‬ ‫يد‬ ‫من‬ ‫التراجع‬ ‫باتجاه‬ ‫مستوى‬ 9450 ‫نقطة‬ .  ‫ننصح‬ ‫المستثمرين‬ ‫باإلنتقائية‬ . Market Pulse ► The EGX30 fell 3.13% by the end of the last session. ► The EGX30 breached below the lower edge of the channel pattern, yet it closed below the horizontal support level of 9,820; however, a confirmed penetration below the later level would drag the index lower toward 9,450. ► Investors are advised to be selective. 19 September 2022
  3. 3. HRHO, Daily Chart - EGP12.00 ► EFG-Hermes Holding fell 4.00% by the end of the last session. ► HRHO breached below the key- support level of EGP12.50; therefore, a confirmed penetration below the aforementioned level would send the prices lower toward EGP11.40 and then EGP10.65. ► Investors are advised to wait for another buy signal.  ‫سهم‬ ‫شركة‬ ‫المجموعه‬ ‫الماليه‬ ‫هيرمس‬ ‫القابضه‬ - ‫هيرميس‬ ‫هبط‬ ‫في‬ ‫جلسته‬ ‫األخيرة‬ ‫بنسبة‬ 4.00 % .  ‫السهم‬ ‫قد‬ ‫أغلق‬ ‫أدنى‬ ‫من‬ ‫مستوى‬ ‫الدعم‬ ‫المهم‬ 12.50 ،‫جم‬ ‫لذلك‬ ‫فإن‬ ‫بقائه‬ ‫أدنى‬ ‫من‬ ‫المستوى‬ ،‫المذكور‬ ‫سوف‬ ‫يؤدي‬ ‫لمزيد‬ ‫من‬ ‫التراجع‬ ‫باتجاه‬ ‫مستوى‬ 11.40 ‫جم‬ ‫ثم‬ ‫نحو‬ ‫مستوى‬ 10.65 ‫جم‬ .  ‫ننصح‬ ‫المستثمرين‬ ‫بإنتظار‬ ‫إشارة‬ ‫شراء‬ ‫جديدة‬ . Market Pulse 19 September 2022
  4. 4. Market Pulse Market Pulse BANKING SECTOR Banking sector RIC Name Last R1 R2 R3 Pivot S1 S2 S3 ‫اإلسم‬ COMI.CA Commercial International Bank Egypt37.50 38.38 39.27 39.83 37.82 36.93 36.37 35.48 ‫مصر‬ - ‫الدولي‬ ‫التجاري‬ ‫البنك‬ QNBA.CA Qatar National Bank Alahly 16.00 16.67 17.33 18.67 15.33 14.67 13.33 12.67 ‫لي‬‫االه‬ ‫الوطني‬ ‫قطر‬ ‫بنك‬ CIEB.CA Credit Agricole Egypt 6.35 6.47 6.58 6.72 6.33 6.22 6.08 5.97 ‫مصر‬ - ‫أجريكول‬ ‫كريدي‬ HDBK.CA Housing and Development Bank 36.98 37.85 38.71 39.64 36.92 36.06 35.13 34.27 ‫واالسكان‬ ‫التعمير‬ ‫بنك‬ FAIT.CA Faisal Islamic Bank of Egypt 13.88 14.03 14.17 14.28 13.92 13.78 13.67 13.53 ‫المصري‬ ‫اإلسالمي‬ ‫فيصل‬ ‫بنك‬ FAITA.CA Faisal Islamic Bank of Egypt 1.00 1.00 1.00 1.00 1.00 1.00 0.99 0.99 )‫(دوالر‬ ‫المصري‬ ‫اإلسالمي‬ ‫فيصل‬ ‫بنك‬ EGBE.CA Egyptian Gulf Bank 0.41 #VALUE! #VALUE! #VALUE! #VALUE! #VALUE! #VALUE! #VALUE! ‫الخليجي‬ ‫المصري‬ ‫البنك‬ EXPA.CA Export Development Bank of Egypt 8.69 8.81 8.92 9.07 8.66 8.55 8.40 8.29 ‫الصادرات‬ ‫لتنمية‬ ‫المصري‬ ‫البنك‬ SAUD.CA Al Baraka Bank Egypt 12.43 12.59 12.74 12.84 12.49 12.34 12.24 12.09 ‫مصر‬ - ‫البركة‬ ‫بنك‬ ADIB.CA Abu Dhabi Islamic Bank Egypt 13.45 13.87 14.28 14.57 13.58 13.17 12.88 12.47 ‫مصر‬ - ‫اإلسالمي‬ ‫ظبي‬ ‫أبو‬ ‫مصرف‬
  5. 5. Market Pulse Basic Resources Sector Market Pulse Basic Resources sector RIC Name Last R1 R2 R3 Pivot S1 S2 S3 ‫اإلسم‬ IRAX.CA Al Ezz Dekheila Steel Company Alexandria 661.00 685.67 710.33 722.67 673.33 648.67 636.33 611.67 ‫االسكندرية‬ - ‫للصلب‬ ‫الدخيلة‬ ‫العز‬ ESRS.CA Ezz Steel Co 13.72 13.98 14.24 14.38 13.84 13.58 13.44 13.18 ‫عز‬ ‫حديد‬ EGAL.CA Egypt Aluminum Co 19.26 20.31 21.37 21.93 19.75 18.69 18.13 17.07 ‫لاللومنيوم‬ ‫مصر‬ IRON.CA Egyptian Iron and Steel Co 5.97 5.97 5.97 5.97 5.97 5.97 5.97 5.97 ‫المصرية‬ ‫والصلب‬ ‫الحديد‬ ATQA.CA Misr National Steel 1.10 1.20 1.30 1.38 1.12 1.02 0.94 0.84 ‫للصلب‬ ‫الوطنية‬ ‫مصر‬ ENGC.CA Industrial Engineering Co for Construction and Development 5.00 5.40 5.80 6.00 5.20 4.80 4.60 4.20 ‫إيكون‬ - ‫المعمارية‬ ‫الهندسية‬ ‫الصناعات‬ ASCM.CA ASEC Co for Mining 6.64 7.29 7.94 8.33 6.90 6.25 5.86 5.21 ‫للتعدين‬ ‫أسيك‬ RAKT.CA General Company for Paper Industry 10.50 11.69 12.89 13.83 10.75 9.55 8.61 7.41 ‫راكتا‬ - ‫الورق‬ ‫لصناعة‬ ‫العامة‬ UNIP.CA Universal Co for Packaging Materials and Paper 0.49 0.52 0.55 0.57 0.51 0.48 0.46 0.43 ‫التعبئة‬ ‫مواد‬ ‫لصناعة‬ ‫يونيفرسال‬ ALUM.CA Arab Aluminum Co 25.55 27.08 28.62 29.53 26.17 24.63 23.72 22.18 ‫العربية‬ ‫االلومنيوم‬ EPPK.CA El Ahram Co for Printing and Packaging 7.73 #VALUE! #VALUE! #VALUE! #VALUE! #VALUE! #VALUE! #VALUE! ‫والتغليف‬ ‫للطباعة‬ ‫االهرام‬
  6. 6. Market Pulse Chemicals Sector Market Pulse Chemicals sector RIC Name Last R1 R2 R3 Pivot S1 S2 S3 ‫اإلسم‬ ABUK.CA Abu Qir Fertilizers and Chemical Industries Co23.64 24.09 24.53 25.18 23.44 23.00 22.35 21.91 ‫لالسمدة‬ ‫قير‬ ‫أبو‬ MFPC.CA Misr Fertilizers Production Co 105.05 108.35 111.65 113.30 106.70 103.40 101.75 98.45 ‫األسمدة‬ ‫إلنتاج‬ ‫مصر‬ SKPC.CA Sidi Kerir Petrochemicals Co 7.24 7.56 7.88 8.11 7.33 7.01 6.78 6.46 ‫للبتروكيماويات‬ ‫كرير‬ ‫سيدي‬ EGCH.CA Egyptian Chemical Industries 3.47 3.68 3.88 4.01 3.55 3.35 3.22 3.02 ‫المصرية‬ ‫الكيماوية‬ ‫الصناعات‬ EFIC.CA Egyptian Financial and Industrial 21.60 22.21 22.83 23.40 21.64 21.02 20.45 19.83 ‫المصرية‬ ‫والصناعية‬ ‫المالية‬ MICH.CA Misr Chemical Industries Co 11.15 11.55 11.95 12.15 11.35 10.95 10.75 10.35 ‫الكيماويات‬ ‫لصناعة‬ ‫مصر‬ KZPC.CA Kafr El Zayat Pesticides and Chemicals Co 30.51 32.17 33.83 34.66 31.34 29.68 28.85 27.19 ‫للمبيدات‬ ‫الزيات‬ ‫كفر‬
  7. 7. Market Pulse Construction Sector Market Pulse Construction sector RIC Name Last R1 R2 R3 Pivot S1 S2 S3 ‫اإلسم‬ ARCC Arabian Cement 4.70 4.97 5.23 5.42 4.78 4.52 4.33 4.07 ‫لألسمنت‬ ‫العربية‬ SVCE South Valley Cement 1.29 1.36 1.44 1.48 1.32 1.25 1.20 1.13 ‫لالسمنت‬ ‫الوادي‬ ‫جنوب‬ SCEM Sinai Cement 5.40 5.50 5.60 5.68 5.42 5.32 5.24 5.14 ‫سيناء‬ ‫اسمنت‬ MCQE Misr Cement Company 13.98 14.39 14.79 15.09 14.09 13.69 13.39 12.99 ‫قنا‬ - ‫لألسمنت‬ ‫مصر‬ ECAP Al Ezz Ceramic and Porcelin 10.00 10.80 11.60 12.25 10.15 9.35 8.70 7.90 ‫والبورسلين‬ ‫للسيراميك‬ ‫العز‬ UEGC El Saeed Contracting & Real Estate Investment 0.55 0.58 0.61 0.63 0.56 0.53 0.51 0.48 ‫للمقاوالت‬ ‫العامة‬ ‫الصعيد‬ CERA Aeab Ceramic 0.60 0.63 0.66 0.68 0.61 0.57 0.55 0.52 ‫ريماس‬- ‫سيراميكا‬ ‫للخزف‬ ‫العربية‬ GGCC Giza General Contracting 0.274 0.298 0.322 0.340 0.280 0.256 0.238 0.214 ‫للمقاوالت‬ ‫العامة‬ ‫الجيزة‬ DCRC Delta Construction & Rebuilding 17.500 18.167 18.833 19.167 17.833 17.167 16.833 16.167 ‫والتعمير‬ ‫لإلنشاء‬ ‫دلتا‬ ARVA Arab Valves Company 1.277 1.469 1.660 1.795 1.334 1.143 1.008 0.817 ‫للمحابس‬ ‫العربية‬ EDBM Egyptian for Developing Materials 0.30 0.33 0.36 0.38 0.31 0.27 0.25 0.22 ‫سالب‬ ‫ليفت‬ - ‫البناء‬ ‫صناعة‬ ‫لتطوير‬ ‫المصرية‬
  8. 8. Market Pulse Financial Services Sector Market Pulse Financial Services sector RIC Name Last R1 R2 R3 Pivot S1 S2 S3 ‫اإلسم‬ EKHO.CA Egypt Kuwait Holding Co SAE 1.240 1.249 1.258 1.272 1.235 1.226 1.212 1.203 ‫الكويتية‬ ‫المصرية‬ ‫القابضة‬ HRHO.CA EFG Hermes Holdings SAE 12.00 12.42 12.83 13.07 12.18 11.77 11.53 11.12 ‫القابضه‬ ‫هيرمس‬ ‫الماليه‬ ‫المجموعه‬ CCAP.CA Qalaa Holdings SAE 1.191 1.264 1.338 1.384 1.218 1.144 1.098 1.024 ‫المالية‬ ‫لالستشارات‬ ‫القلعة‬ PIOH.CA Pioneers Holding Company for Financial Investments SAE 0.24 0.25 0.26 0.27 0.24 0.23 0.22 0.21 ‫القابضة‬ ‫بايونيرز‬ CICH.CA CI Capital Holding Company SAE 4.200 4.327 4.453 4.547 4.233 4.107 4.013 3.887 ‫القابضة‬ ‫كابيتال‬ ‫اي‬ ‫سي‬ CNFN Sarwa Capital Holding for Financial Investments SAE 3.01 #VALUE! #VALUE! #VALUE! #VALUE! #VALUE! #VALUE! #VALUE! ‫كابيتال‬ ‫ثروة‬ AMER.CA Amer Group Holding Co SAE 0.690 0.730 0.770 0.790 0.710 0.670 0.650 0.610 ‫القابضة‬ ‫عامر‬ ‫مجموعة‬ NAHO.CA Naeem Holding for Investments SAE 0.170 0.170 0.170 0.170 0.170 0.170 0.170 0.170 ‫لالستثمارات‬ ‫القابضة‬ ‫النعيم‬ BTFH.CA Beltone Financial Holding SAE 2.960 3.417 3.873 4.167 3.123 2.667 2.373 1.917 ‫القابضة‬ ‫المالية‬ ‫بلتون‬ BINV.CA B Investments Holding SAE 10.52 -10.51 0.98 -9.53 10.84 -11.49 -0.98 -12.47 ‫القابضة‬ ‫إنفستمنتس‬ ‫بي‬ AIVC.CA Al Arafa for Investment and Consultancies SAE 0.075 0.078 0.082 0.083 0.077 0.073 0.072 0.068 ‫االستشارات‬ ‫و‬ ‫لالستثمارات‬ ‫العرفة‬ PORT.CA Porto Group Holding SAE The record could not be found #VALUE! #VALUE! #VALUE! #VALUE! #VALUE! #VALUE! #VALUE! ‫القابضة‬ ‫بورتو‬ ‫مجموعة‬ ACAMD.CA Arab Co for Asset Management and Development 0.415 0.476 0.536 0.579 0.433 0.373 0.330 0.270 ‫األصول‬ ‫وتطوير‬ ‫إلدارة‬ ‫العربية‬ MOIN.CA Mohandes Insurance Co SAE 10.80 10.80 10.80 10.80 10.80 10.80 10.80 10.80 ‫للتأمين‬ ‫المهندس‬ ATLC.CA AT Lease SAE 3.220 3.380 3.540 3.680 3.240 3.080 2.940 2.780 ‫التمويلي‬ ‫للتأجير‬ ‫التوفيق‬ PRMH.CA Prime Holding for Financial Investments SAE 0.544 0.565 0.585 0.611 0.539 0.519 0.493 0.473 ‫المالية‬ ‫لالستثمارات‬ ‫القابضة‬ ‫برايم‬ ODIN.CA ODIN Investments SAE 1.114 1.271 1.429 1.524 1.176 1.018 0.923 0.765 ‫الخارج‬ ‫في‬ ‫المصريين‬ SEIG.CA Saudi Egyptian Investment and Finance Co SAE 63.29 #VALUE! #VALUE! #VALUE! #VALUE! #VALUE! #VALUE! #VALUE! ‫والتمويل‬ ‫لالستثمار‬ ‫المصرية‬ ‫السعودية‬ EOSB.CA Al Orouba Securities Brokerage Co SAE 0.780 0.780 0.780 0.780 0.780 0.780 0.780 0.780 ‫للسمسرة‬ ‫العروبة‬
  9. 9. Market Pulse Food and Beverage Sector Market Pulse Food and Beverage sector RIC Name Last R1 R2 R3 Pivot S1 S2 S3 ‫اإلسم‬ JUFO.CA Juhayna Food Industries SAE 7.37 7.50 7.64 7.87 7.27 7.13 6.90 6.76 ‫الغذائية‬ ‫للصناعات‬ ‫جهينة‬ POUL.CA Cairo Poultry Co SAE 2.48 2.60 2.72 2.79 2.53 2.41 2.34 2.22 ‫للدواجن‬ ‫القاهرة‬ OLFI.CA Obour Land for Food Industries 5.12 5.34 5.57 5.73 5.18 4.95 4.79 4.56 ‫الغذائية‬ ‫للصناعات‬ ‫الند‬ ‫عبور‬ DOMT.CA Arabian Food Industries Company SAE 5.18 5.29 5.41 5.46 5.24 5.12 5.07 4.95 )‫(دومتي‬ ‫العربية‬ ‫الغذائية‬ ‫الصناعات‬ SUGR.CA Delta Sugar Co SAE 13.50 14.34 15.17 15.77 13.74 12.91 12.31 11.48 ‫للسكر‬ ‫الدلتا‬ ESGI.CA Egyptian Starch and Glucose Manufacturing Co SAE 3.21 #VALUE! #VALUE! #VALUE! #VALUE! #VALUE! #VALUE! #VALUE! ‫والجلوكوز‬ ‫النشا‬ ‫لصناعة‬ ‫المصرية‬ UEFM.CA Upper Egypt Flour Mills SAE 94.95 96.40 97.85 100.75 93.50 92.05 89.15 87.70 ‫العليا‬ ‫مصر‬ ‫مطاحن‬ AFMC.CA Alexandria Flour Mills and Bakeries Co SAE 10.17 11.06 11.95 12.48 10.53 9.64 9.11 8.22 ‫اإلسكندرية‬ ‫ومخابز‬ ‫مطاحن‬ COSG.CA Cairo for Oil and Soap Co SAE 0.63 0.63 0.63 0.63 0.63 0.63 0.63 0.63 ‫والصابون‬ ‫للزيوت‬ ‫القاهرة‬ AJWA.CA Ajwa for Food Industries Co Egypt SAE 15.76 17.54 19.32 20.33 16.53 14.75 13.74 11.96 ‫مصر‬ - ‫الغذائية‬ ‫للصناعات‬ ‫اجواء‬ IFAP.CA International Co for Agricultural Corps SAE 3.45 3.80 4.16 4.52 3.44 3.08 2.72 2.36 ‫الزراعية‬ ‫للمحاصيل‬ ‫الدولية‬ ZEOT.CA Extracted Oil and Derivatives Co SAE 1.56 1.62 1.69 1.73 1.58 1.52 1.48 1.41 ‫ومنتجاتها‬ ‫المستخلصة‬ ‫الزيوت‬ MILS.CA North Cairo Flour Mills Co SAE 18.99 19.59 20.20 20.99 18.80 18.19 17.40 16.79 ‫القاهرة‬ ‫شمال‬ ‫ومخابز‬ ‫مطاحن‬ ISMA.CA Ismailia Misr Poultry Co SAE 5.95 6.63 7.30 7.72 6.21 5.54 5.12 4.45 ‫للدواجن‬ ‫مصر‬ ‫االسماعيلية‬ ELNA.CA El Nasr for Manufacturing Agricultural Crops SAE 21.85 #VALUE! #VALUE! #VALUE! #VALUE! #VALUE! #VALUE! #VALUE! ‫الزراعية‬ ‫الحاصالت‬ ‫لتصنيع‬ ‫النصر‬ SCFM.CA South Cairo and Giza Mills and Bakeries SAE16.60 16.60 16.60 16.60 16.60 16.60 16.60 16.60 ‫القاهرة‬ ‫جنوب‬ ‫ومخابز‬ ‫مطاحن‬ MPCO.CA Mansoura Poultry Co SAE 1.01 1.13 1.24 1.33 1.04 0.93 0.84 0.73 ‫للدواجن‬ ‫المنصورة‬ AIFI.CA Atlas for Investment & food Industries SAE 0.24 0.27 0.29 0.31 0.25 0.23 0.21 0.18 ‫الغذائية‬ ‫والصناعات‬ ‫لإلسنثمار‬ ‫أطلس‬ EPCO.CA Egyptian Poultry Co SAE 3.11 3.32 3.52 3.65 3.19 2.99 2.86 2.66 ‫للدواجن‬ ‫المصرية‬ SNFC.CA Sharkia National Company for Food Security SAE 0.83 0.91 1.00 1.05 0.86 0.78 0.73 0.65 ‫الغذائي‬ ‫لالمن‬ ‫الوطنية‬ ‫الشرقية‬ NEDA.CA North Upper Egypt Development and Agricultural Production Co SAE 2.07 2.24 2.41 2.52 2.13 1.96 1.85 1.68 ‫الزراعى‬ ‫واالنتاج‬ ‫للتنمية‬ ‫الصعيد‬ ‫شمال‬ ANFI.CA Alexandria National Company for Financial Investment SAE 10.30 10.30 10.30 10.30 10.30 10.30 10.30 10.30 ‫الوطنية‬ ‫اإلسكندرية‬
  10. 10. Market Pulse Healthcare and Pharmaceuticals Sector Market Pulse Healthcare and Pharmaceuticals Sector RIC Name Last R1 R2 R3 Pivot S1 S2 S3 ‫اإلسم‬ CLHO.CA Cleopatra Hospital SAE 3.92 4.07 4.23 4.31 3.99 3.83 3.75 3.59 ‫كليوباترا‬ ‫مستشفى‬ ‫شركة‬ ISPH.CA Ibnsina Pharma Co SAE 1.85 1.95 2.06 2.15 1.86 1.76 1.67 1.56 ‫فارما‬ ‫سينا‬ ‫ابن‬ PHAR.CA Egyptian International Pharmaceuticals Industries Co SAE 30.49 31.58 32.67 33.36 30.89 29.80 29.11 28.02 ‫إيبيكو‬ AXPH.CA Alexandria Co for Pharmaceutical and Chemical Industries SAE 119.00 121.00 123.00 127.00 117.00 115.00 111.00 109.00 ‫لألدوية‬ ‫اإلسكندرية‬ NINH.CA Nozha International Hospital SAE 5.42 5.62 5.82 5.99 5.45 5.25 5.08 4.88 ‫الدولي‬ ‫النزهة‬ ‫مستشفى‬ RMDA.CA 10th of Ramadan for Pharmaceutical and Diagnostic Reagents Co SAE 2.70 2.85 3.00 3.10 2.75 2.60 2.50 2.35 ‫راميدا‬ CPCI.CA Kahira Pharmaceuticals and Chemical Industries Co 38.51 39.58 40.66 41.36 38.88 37.80 37.10 36.02 ‫لألدوية‬ ‫القاهرة‬ SPMD Speed Medical 0.44 0.47 0.50 0.51 0.45 0.42 0.40 0.37 ‫فارما‬ ‫أكتوبر‬ ADCI.CA Arab Drug Company for Pharmaceuticals and Chemical Industries SAE 45.10 46.27 47.45 48.03 45.69 44.51 43.93 42.75 ‫الكيماوية‬ ‫والصناعات‬ ‫لألدوية‬ ‫العربية‬ SIPC.CA Sabaa International Company for Pharmaceutical & Chemical Industries SAE 5.16 5.40 5.63 5.82 5.21 4.98 4.79 4.56 ‫لألدوية‬ ‫سبأ‬ MPCI.CA Memphis Pharmaceuticals and Chemical Industries SAE 15.65 16.89 18.12 18.81 16.20 14.97 14.28 13.05 ‫الكيماوية‬ ‫والصناعات‬ ‫لالدوية‬ ‫ممفيس‬
  11. 11. Market Pulse Industrial Goods Sector Market Pulse Industrial Goods Sector RIC Name Last R1 R2 R3 Pivot S1 S2 S3 ‫اإلسم‬ SWDY.CA El Sewedy Electric Co SAE 7.14 7.42 7.69 7.87 7.24 6.97 6.79 6.52 ‫اليكتريك‬ ‫السويدي‬ ORAS.CA Orascom Construction PLC 64.89 66.83 68.77 70.69 64.91 62.97 61.05 59.11 ‫سي‬ ‫ال‬ ‫بي‬ ‫كونستراكشون‬ ‫أوراسكوم‬ ALCN.CA Alexandria Container and Cargo Handling Company SAE 9.54 10.08 10.62 11.04 9.66 9.12 8.70 8.16 ‫والبضائع‬ ‫الحاويات‬ ‫لتداول‬ ‫االسكندرية‬ CSAG.CA Canal Shipping Agencies Co SAE 12.69 13.83 14.96 15.63 13.16 12.03 11.36 10.23 ‫المالحية‬ ‫للتوكيالت‬ ‫القناة‬ AUTO.CA GB Auto SAE 3.34 3.59 3.83 4.00 3.42 3.18 3.01 2.77 ‫أوتو‬ ‫بي‬ ‫جي‬ ELEC.CA Electro Cable Egypt Co SAE 0.347 0.365 0.382 0.397 0.350 0.333 0.318 0.301 ‫المصرية‬ ‫الكهربائية‬ ‫الكابالت‬ AMIA.CA Arab Moltaka Investments Company SAE 1.60 -1.58 0.20 -1.38 1.65 -1.78 -0.20 -1.98 ‫لالستثمارات‬ ‫العربي‬ ‫الملتقى‬ AIH.CA Arabia Investments Holding SAE 0.313 0.339 0.365 0.382 0.322 0.296 0.279 0.253 )‫سي‬ ‫أي‬ ‫(ايه‬ ‫لالستثمارات‬ ‫العربية‬ ETRS.CA Egyptian Transport and Commercial Services Co SAE 2.08 2.38 2.69 2.87 2.20 1.89 1.71 1.40 ‫النقل‬ ‫لخدمات‬ ‫المصرية‬ UASG.CA United Arab Stevedoring Co SAE 0.68 0.76 0.83 0.87 0.72 0.64 0.60 0.53 ‫والتفريغ‬ ‫للشحن‬ ‫المتحدة‬ ‫العربية‬ ICID.CA International Company for Investment and Development SAE 24.00 25.16 26.32 27.15 24.33 23.17 22.34 21.18 ‫والتنمية‬ ‫لالستثمار‬ ‫العالمية‬ EIUD.CA Egyptians for Investment and Urban Development SAE 7.700 7.877 8.053 8.257 7.673 7.497 7.293 7.117 ‫العمرانية‬ ‫التنمية‬ ‫و‬ ‫لالستثمار‬ ‫المصريين‬ GMCI.CA GMC Group for Industrial Commercial and Financial Investment SAE 1.680 #VALUE! #VALUE! #VALUE! #VALUE! #VALUE! #VALUE! #VALUE! ‫الصناعية‬ ‫لالستثمارات‬ ‫سى‬ ‫إم‬ ‫جى‬ GIHD.CA Islamic Gharbia Co for Developed Buildings SAE 13.94 14.42 14.90 15.86 13.46 12.98 12.02 11.54 ‫العمرانية‬ ‫للتنمية‬ ‫اإلسالمية‬ ‫الغربية‬
  12. 12. Market Pulse Oil and Gas Personal and Household Products Sector Market Pulse Oil and Gas RIC Name Last R1 R2 R3 Pivot S1 S2 S3 ‫اإلسم‬ AMOC.CA Alexandria Mineral Oils Co 4.05 4.17 4.30 4.40 4.40 3.94 3.84 3.71 ‫المعدنية‬ ‫للزيوت‬ ‫االسكندرية‬ MOIL.CA Maridive and Oil Services 0.082 0.085 0.087 0.089 0.089 0.081 0.079 0.077 ‫والبترولية‬ ‫المالحية‬ ‫الخدمات‬ Personal and Household Products Sector RIC Name Last R1 R2 R3 Pivot S1 S2 S3 ‫اإلسم‬ EAST.CA Eastern Company 10.03 10.22 10.41 10.52 10.11 9.92 9.81 9.62 ‫كومباني‬ ‫ايسترن‬ ‫الشرقية‬ ORWE.CA Oriental Weavers Carpet Co 6.68 6.82 6.97 7.05 6.74 6.59 6.51 6.36 ‫للسجاد‬ ‫الشرقيون‬ ‫لنساجون‬ DSCW.CA Dice Sport and Casual Wear 0.341 0.380 0.419 0.445 0.354 0.315 0.289 0.250 ‫الجاهزة‬ ‫للمالبس‬ ‫دايس‬ KABO.CA El Nasr Clothing and Textiles Company 0.779 0.852 0.925 0.976 0.801 0.728 0.677 0.604 ‫والمنسوجات‬ ‫للمالبس‬ ‫النصر‬ SPIN.CA Alexandria Spinning & Weaving Co 1.390 1.495 1.600 1.660 1.435 1.330 1.270 1.165 ‫النسيج‬ ‫و‬ ‫للغزل‬ ‫االسكندرية‬ ACGC.CA Arabia Cotton Ginning Co 2.200 2.307 2.413 2.487 2.233 2.127 2.053 1.947 ‫األقطان‬ ‫لحليج‬ ‫العربية‬ APSW.CA Unirab Polvara Spinning and Weaving Co 2.83 2.91 2.99 3.03 2.87 2.79 2.75 2.67 ‫والنسيج‬ ‫للغزل‬ ‫وبولفارا‬ ‫العربية‬ PRCL.CA General Company for Ceramic and Porcelain Products 3.48 3.86 4.24 4.47 3.63 3.25 3.02 2.64 ‫والصيني‬ ‫الخزف‬ ‫لمنتجات‬ ‫العامة‬
  13. 13. Market Pulse Real Estate Sector Market Pulse Real Estate Sector RIC Name Last R1 R2 R3 Pivot S1 S2 S3 ‫اإلسم‬ TMGH.CA Talaat Mostafa Group Holding Co 7.36 7.67 7.99 8.38 7.28 6.96 6.57 6.25 ‫القابضة‬ ‫مصطفى‬ ‫طلعت‬ ‫مجموعة‬ EMFD.CA Emaar Misr for Development 2.38 2.48 2.57 2.64 2.41 2.32 2.25 2.16 ‫للتنمية‬ ‫مصر‬ ‫إعمار‬ HELI.CA Heliopolis Co for Housing and Development 5.64 5.95 6.26 6.46 5.75 5.44 5.24 4.93 ‫والتعمير‬ ‫لالسكان‬ ‫الجديدة‬ ‫مصر‬ MNHD.CA Madinet Nasr for Housing and Development 2.85 3.03 3.22 3.35 2.90 2.71 2.58 2.39 ‫والتعمير‬ ‫لالسكان‬ ‫نصر‬ ‫مدينة‬ PHDC.CA Palm Hills Developments Company 1.292 1.365 1.437 1.485 1.317 1.245 1.197 1.125 ‫للتعمير‬ ‫هيلز‬ ‫بالم‬ OCDI.CA Sixth of October Development and Investment Co 11.21 11.46 11.72 11.93 11.25 10.99 10.78 10.52 ‫واالستثمار‬ ‫للتنمية‬ ‫اكتوبر‬ ‫من‬ ‫السادس‬ ZMID.CA Zahraa Maadi Investment and Development 13.53 14.47 15.40 15.89 13.98 13.05 12.56 11.63 ‫والتعمير‬ ‫لالستثمار‬ ‫المعادي‬ ‫زهراء‬ UNIT.CA United Company for Housing and Development 3.20 3.34 3.49 3.62 3.21 3.06 2.93 2.78 ‫والتعمير‬ ‫لالسكان‬ ‫المتحدة‬ ELSH.CA El Shams Housing and Urbanization Co 6.26 6.92 7.59 8.02 6.49 5.82 5.39 4.72 ‫التعمير‬ ‫و‬ ‫لالسكان‬ ‫الشمس‬ DAPH.CA Development and Engineering Consultants Co 20.99 22.42 23.85 24.75 21.52 20.09 19.19 17.76 ‫الهندسية‬ ‫واالستشارات‬ ‫التعمير‬ NHPS.CA National Company for Housing for Professional Syndicates 28.00 28.00 28.00 28.00 28.00 28.000 28.000 28.000 ‫النقابات‬ ‫إلسكان‬ ‫الوطنية‬ EHDR.CA Egyptians for Housing Development and Reconstruction Co 0.45 0.52 0.60 0.65 0.48 0.40 0.36 0.28 ‫لإلسكان‬ ‫المصريين‬ IDRE.CA Ismailia Development and Real Estate Co 24.30 25.98 27.66 28.52 25.12 23.44 22.58 20.90 ‫العمراني‬ ‫للتطوير‬ ‫اإلسماعيلية‬ MENA.CA Mena for Touristic and Real Estate Investment Co 0.901 0.963 1.024 1.061 0.926 0.865 0.828 0.767 ‫والعقاري‬ ‫السياحي‬ ‫لالستثمار‬ ‫مينا‬ RREI.CA Arab Real Estate Investment Co 0.58 0.63 0.69 0.74 0.59 0.53 0.49 0.43 )‫(أليكو‬ ‫العربي‬ ‫العقاري‬ ‫اإلستمار‬ WKOL.CA Wadi Kom Ombo for Land Reclamation Co 33.64 35.58 37.52 38.55 34.55 32.61 31.58 29.64 ‫االراضي‬ ‫الستصالح‬ ‫امبو‬ ‫كوم‬ ‫وادي‬ AREH.CA Real Estate Egyptian Consortium 1.51 1.59 1.68 1.75 1.53 1.44 1.38 1.29 ‫العقارى‬ ‫لالستثمار‬ ‫العبور‬ CCRS.CA Gulf Canadian Company for Arab Real Estate Investment 10.93 10.93 10.93 10.93 10.93 10.93 10.93 10.93 ‫الكندية‬ ‫الخليجية‬ OBRI.CA El Ebour Company for Real Estate Investment 9.96 11.34 12.72 13.54 10.52 9.14 8.32 6.94 ‫العقارى‬ ‫لالستثمار‬ ‫العبور‬
  14. 14. Market Pulse Retail Sector Media Sector Market Pulse Media Sector RIC Name Last R1 R2 R3 Pivot S1 S2 S3 ‫اإلسم‬ MPRC.CA Egyptian Media Production City Co 5.81 6.30 6.80 7.09 6.01 5.51 5.22 4.72 ‫المى‬‫االع‬ ‫االنتاج‬ ‫لمدينة‬ ‫المصريه‬ Retail Sector RIC Name Last R1 R2 R3 Pivot S1 S2 S3 ‫اإلسم‬ MTIE.CA MM Group for Industry and International Trade 3.13 3.44 3.75 3.93 3.26 2.95 2.77 2.46 ‫جروب‬ ‫ام‬.‫ام‬ MFSC.CA Egypt Free Shops Company 9.65 9.79 9.93 10.00 9.72 9.58 9.51 9.37 ‫الحرة‬ ‫لالسواق‬ ‫مصر‬ GSSC.CA General Company for Silos and Storage 84.99 86.49 88.00 88.99 85.50 83.99 83.00 81.49 ‫والتخزين‬ ‫للصوامع‬ ‫العامة‬ CAED.CA Cairo for Educational Affairs 14.29 14.87 15.44 16.60 13.71 13.14 11.98 11.41 ‫التعليم‬ ‫لخدمات‬ ‫القاهرة‬
  15. 15. Market Pulse Technology Sector Telecommunications Sector Market Pulse Telecommunications Sector RIC Name Last R1 R2 R3 Pivot S1 S2 S3 ‫اإلسم‬ ETEL.CA Telecom Egypt Co 16.60 16.89 17.19 17.38 16.70 16.40 16.21 15.91 ‫لالتصاالت‬ ‫المصرية‬ OIH.CA Orascom Investment Holding 0.193 0.201 0.210 0.215 0.196 0.187 0.182 0.173 ‫القابضة‬ ‫لالستثمار‬ ‫أوراسكوم‬ Technology Sector RIC Name Last R1 R2 R3 Pivot S1 S2 S3 ‫اإلسم‬ EFIH.CA E-finance for Digital and Financial Investements 14.22 14.69 15.15 15.50 14.34 13.88 13.53 13.07 ‫فاينانس‬ ‫إي‬ FWRY.CA Fawry For Banking Technology And Electronic Payment 3.60 3.90 4.19 4.40 3.69 3.40 3.19 2.90 ‫فوري‬ EGSA.CA Egyptian Satellite Co 4.25 4.33 4.42 4.46 4.29 4.20 4.16 4.07 ‫الصناعية‬ ‫لألقمار‬ ‫المصرية‬ RAYA.CA Raya Holding for Financial Investment SAE 2.28 2.55 2.83 3.00 2.38 2.10 1.93 1.65 ‫القابضة‬ ‫راية‬ OFH.CA Orascom Financial Holding SAE 0.20 0.21 0.21 0.21 0.20 0.20 0.20 0.19 ‫القابضة‬ ‫المالية‬ ‫اوراسكوم‬
  16. 16. Market Pulse Travel and Leisure Sector Utilities Sector Market Pulse Travel and Leisure Sector RIC Name Last R1 R2 R3 Pivot S1 S2 S3 ‫اإلسم‬ GPPL.CA Golden Pyramids Plaza 1.44 #VALUE! #VALUE! #VALUE! #VALUE! #VALUE! #VALUE! #VALUE! ‫بالزا‬ ‫بيراميدز‬ ‫جولدن‬ ORHD.CA Orascom Hotels and Development 4.820 5.177 5.533 5.717 4.993 4.637 4.453 4.097 ‫للتنمية‬ ‫أوراسكوم‬ EGTS.CA Egyptian Resorts Co SAE 1.51 1.60 1.68 1.73 1.55 1.47 1.43 1.34 ‫السياحية‬ ‫المنتجعات‬ RTVC.CA Remco Tourism Villages Construction SAE2.280 2.450 2.620 2.750 2.320 2.150 2.020 1.850 ‫رمكو‬ MHOT.CA Misr Hotels Company SAE 23.97 25.50 27.04 29.12 23.42 21.88 19.80 18.26 ‫للفنادق‬ ‫مصر‬ SDTI.CA Sharm Dreams Company For Touristic Investment SAE 7.85 8.97 10.08 10.77 8.28 7.17 6.48 5.37 ‫دريمز‬ ‫شارم‬ ROTO.CA Rowad Tourism Company SAE 23.19 24.76 26.32 27.18 23.90 22.34 21.48 19.92 ‫للسياحة‬ ‫الرواد‬ ELWA.CA El Wadi for International and Investment Development SAE 0.45 0.47 0.48 0.49 0.46 0.44 0.43 0.41 ‫السياحي‬ ‫لإلستثمار‬ ‫الوادي‬ GOCO.CA Golden Coast El Sokhna Company for Touristic Investment SAE 0.35 0.36 0.36 0.37 0.35 0.34 0.34 0.33 ‫كوست‬ ‫جولدن‬ 0 0 0.000 0.000 0.000 0.000 0.000 0.000 0.000 0.000 0 Utilities Sector RIC Name Last R1 R2 R3 Pivot S1 S2 S3 ‫اإلسم‬ EGAS.CA Egypt Gas Co 31.00 32.93 34.87 36.53 31.27 29.33 27.67 25.73 ‫مصر‬ ‫غاز‬
  17. 17. Glossary • RSI: The Relative Strength Index (RSI) is a momentum oscillator that ranges from 0 to 100. It compares the extent of the stock's recent price movements by evaluating recent gains and losses. Stocks with RSI above 70 could be considered overbought, and below 30 could be considered oversold. Generally, if the RSI falls below 70, it is a bearish signal. Conversely, if the RSI of a stock rises above 30 it is considered bullish. The RSI used is of 14 days. • MACD1: MACD1 shows the relationship between a longer period moving average and a short period moving average of a stock’s price. Generally, the 26-day exponential moving average (EMA) and the 12-day EMA are used to calculate MACD1. • MACD Signal line: The MACD signal line is the nine-day EMA of the MACD that is used as a trigger for buy and sell signals. MACD falling below the signal line indicates bearishness and MACD rising above the signal line indicates bullishness. • MACD2 : MACD2 is the difference between MACD1 and the signal line. MACD2, if positive generates a bullish signal, and if negative, a bearish signal. ADX / DMI : Average Directional Movement Index (ADX) is an indicator, which measures purely the strength of the current trend not considering whether it is up or down. ADX is derived from the relationship of the Directional Movement Index (DMI) lines. Positive DMI measures the strength of up moves, while negative DMI measures the strength of down moves. ADX above 40 indicates a strong trend and below 20, a weak trend. • Support : Support is the level at which the stock is likely to see increased interest from buyers. The buying support will prevent the stock from falling further. Resistance: Resistance is the level at which the stock is likely to see increased interest from sellers. The selling pressure will prevent the stock from rising further. • Exponential moving average – EMA: Exponential moving average (EMA) is the weighted average of the prices of a given security where higher weights are given to recent data points. EMA is used to analyze the trend of a stock. • Simple moving average – SMA: A simple moving average (SMA) is the average of the closing price of a security for a given period. • Period : The resistance, support and the outlook recommendations are for a weekly horizon. • Advance-decline line: Advance-decline line is an indicator of market breadth, calculated by dividing the number of advancing stocks minus the number of declining stocks by the previous day’s advance-decline line value. • Percentage of stocks above 50-day moving average: This is an indicator of market breath, which shows how many stocks are trading above the 50-day moving average among the total listed stocks on the exchange. • Percentage of New Highs to Total Market: This is an indicator of market breath, which shows the percentage of stocks reaching new highs on a particular day among the total listed stocks on the exchange. • Percentage of New Lows to Total Market: This is an indicator of market breath, which shows the percentage of stocks making new lows on a particular day among the total listed stocks on the exchange.
  18. 18. Disclaimer: The information in this document is based on public data obtained from sources believed by NAEEM HOLDING to be reliable and in good faith, but no representations, guarantees or warranties are made by NAEEM HOLDING with regard to accuracy, completeness or suitability of the data. NAEEM HOLDING has not performed any independent review or due diligence of publicly available information regarding an unaffiliated reference asset or index. The opinions and estimates contained herein reflect the current judgment of the author(s) on the date of this document and are subject to change without notice. The opinions do not necessarily correspond to the opinions of NAEEM HOLDING. NAEEM HOLDING does not have an obligation to update, modify or amend this document or to otherwise notify a reader thereof in the event that any matter stated herein, or any opinion, projection, forecast or estimate set forth herein, changes or subsequently becomes inaccurate. This communication may contain trading ideas where NAEEM HOLDING may trade in such financial instruments with customers or other counterparties. Any prices provided herein (other than those that are identified as being historical) are indicative only, and do not represent firm quotes as to either size or price. The past performance of financial instruments is not indicative of future results. No assurance can be given that any financial instrument or issuer described herein would yield favorable investment results. Any forecasts or price targets shown for companies and/or securities discussed in this document may not be achieved due to multiple risk factors including without limitation market volatility, sector volatility, corporate actions, the unavailability of complete and accurate information and/or the subsequent transpiration that underlying assumptions made by NAEEM HOLDING or by other sources relied upon in the document were inapposite. Contacts Ibrahim El Nemr, CFTe Head of Technical Analysis Desk Ext. 5060 ibrahim.elnemr@naeemholding.com Sales and Trading Contacts Institutional Sales +202 3300 5435 nis@naeemholding.com Brokerage Hotline Customer Support +202 3535 5000 Brkeg.traders@naeemholding.com brokerage-eg@naeemholding.com 16012

×