SlideShare a Scribd company logo
1 of 1
Download to read offline
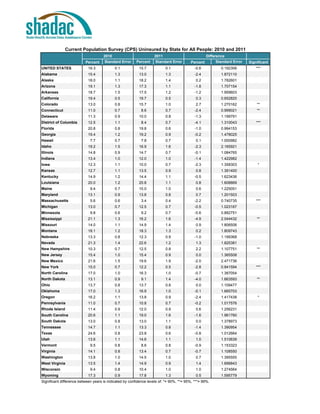
Current Population Survey (CPS) Uninsured by State for All People: 2010 and 2011
                                     2010                          2011                            Difference
                          Percent    Standard Error      Percent   Standard Error        Percent         Standard Error   Significant
UNITED STATES               16.3            0.1           15.7            0.1               -0.6           0.192306           ***
Alabama                     15.4            1.3           13.0            1.3               -2.4           1.872110
Alaska                      18.0            1.1           18.2            1.4               0.2            1.782601
Arizona                     19.1            1.3           17.3            1.1               -1.8           1.707154
Arkansas                    18.7            1.5           17.5            1.2               -1.2           1.959603
California                  19.4            0.5           19.7            0.5               0.3            0.652820
Colorado                    13.0            0.8           15.7            1.0               2.7            1.270162           **
Connecticut                 11.0            0.7             8.6           0.7               -2.4           0.999021           **
Delaware                    11.3            0.9           10.0            0.8               -1.3           1.199791
District of Columbia        12.5            1.1             8.4           0.7               -4.1           1.310043           ***
Florida                     20.8            0.8           19.8            0.6               -1.0           0.994153
Georgia                     19.4            1.2           19.2            0.9               -0.2           1.478025
Hawaii                       7.7            0.7             7.8           0.7               0.1            1.000982
Idaho                       19.2            1.5           16.9            1.6               -2.3           2.165921
Illinois                    14.8            0.9           14.7            0.7               -0.1           1.084765
Indiana                     13.4            1.0           12.0            1.0               -1.4           1.422982
Iowa                        12.3            1.1           10.0            0.7               -2.3           1.358303            *
Kansas                      12.7            1.1           13.5            0.9               0.8            1.391400
Kentucky                    14.9            1.2           14.4            1.1               -0.5           1.623436
Louisiana                   20.0            1.2           20.8            1.1               0.8            1.608869
Maine                        9.4            0.7           10.0            1.0               0.6            1.225051
Maryland                    13.1            0.9           13.8            0.8               0.7            1.201503
Massachusetts                5.6            0.6             3.4           0.4               -2.2           0.740735           ***
Michigan                    13.0            0.7           12.5            0.7               -0.5           1.023167
Minnesota                    9.8            0.6             9.2           0.7               -0.6           0.882751
Mississippi                 21.1            1.3           16.2            1.6               -4.9           2.044432           **
Missouri                    14.0            1.1           14.9            1.4               0.9            1.806506
Montana                     18.1            1.2           18.3            1.3               0.2            1.809743
Nebraska                    13.3            0.8           12.3            0.9               -1.0           1.199368
Nevada                      21.3            1.4           22.6            1.2               1.3            1.825381
New Hampshire               10.3            0.7           12.5            0.8               2.2            1.107751           **
New Jersey                  15.4            1.0           15.4            0.9               0.0            1.365508
New Mexico                  21.6            1.5           19.6            1.9               -2.0           2.471736
New York                    15.0            0.7           12.2            0.5               -2.8           0.841594           ***
North Carolina              17.0            1.0           16.3            1.0               -0.7           1.387054
North Dakota                13.1            0.9             9.1           1.4               -4.0           1.663593           **
Ohio                        13.7            0.8           13.7            0.8               0.0            1.109477
Oklahoma                    17.0            1.3           16.9            1.0               -0.1           1.665703
Oregon                      16.2            1.1           13.8            0.9               -2.4           1.417438            *
Pennsylvania                11.0            0.7           10.8            0.7               -0.2           1.017576
Rhode Island                11.4            0.9           12.0            0.9               0.6            1.256231
South Carolina              20.6            1.1           19.0            1.6               -1.6           1.961760
South Dakota                13.0            0.8           13.0            1.1               0.0            1.378973
Tennessee                   14.7            1.1           13.3            0.8               -1.4           1.390954
Texas                       24.6            0.8           23.8            0.6               -0.8           1.012664
Utah                        13.6            1.1           14.6            1.1               1.0            1.510639
Vermont                      9.5            0.8             8.6           0.8               -0.9           1.153323
Virginia                    14.1            0.8           13.4            0.7               -0.7           1.108550
Washington                  13.8            1.0           14.5            1.0               0.7            1.395555
West Virginia               13.5            1.4           14.9            0.9               1.4            1.696843
Wisconsin                    9.4            0.8           10.4            1.0               1.0            1.274564
Wyoming                     17.3            0.9           17.8            1.3               0.5            1.595779
Significant difference between years is indicated by confidence levels of: *= 90%, **= 95%, ***= 99%.
More Related Content

More from soder145

Exploring the New State-Level Opioid Data On SHADAC's State Health Compare
Exploring the New State-Level Opioid Data On SHADAC's State Health CompareExploring the New State-Level Opioid Data On SHADAC's State Health Compare
Exploring the New State-Level Opioid Data On SHADAC's State Health Compare
soder145
 
Physician Participation in Medi-Cal: Is Supply Meeting Demand?
Physician Participation in Medi-Cal: Is Supply Meeting Demand? Physician Participation in Medi-Cal: Is Supply Meeting Demand?
Physician Participation in Medi-Cal: Is Supply Meeting Demand?
soder145
 

More from soder145 (20)

Modeling State-based Reinsurance: One Option for Stabilization of the Individ...
Modeling State-based Reinsurance: One Option for Stabilization of the Individ...Modeling State-based Reinsurance: One Option for Stabilization of the Individ...
Modeling State-based Reinsurance: One Option for Stabilization of the Individ...
 
2017 Health Insurance Coverage Estimates: SHADAC Webinar Featuring U.S. Censu...
2017 Health Insurance Coverage Estimates: SHADAC Webinar Featuring U.S. Censu...2017 Health Insurance Coverage Estimates: SHADAC Webinar Featuring U.S. Censu...
2017 Health Insurance Coverage Estimates: SHADAC Webinar Featuring U.S. Censu...
 
Exploring the New State-Level Opioid Data On SHADAC's State Health Compare
Exploring the New State-Level Opioid Data On SHADAC's State Health CompareExploring the New State-Level Opioid Data On SHADAC's State Health Compare
Exploring the New State-Level Opioid Data On SHADAC's State Health Compare
 
Ibd intersectionality
Ibd intersectionalityIbd intersectionality
Ibd intersectionality
 
Who gets it right
Who gets it rightWho gets it right
Who gets it right
 
Mn ltss projection model
Mn ltss projection modelMn ltss projection model
Mn ltss projection model
 
Modeling financial eligibility, ltss
Modeling financial eligibility, ltssModeling financial eligibility, ltss
Modeling financial eligibility, ltss
 
Poster, advancements in care coordination mn sim
Poster, advancements in care coordination mn simPoster, advancements in care coordination mn sim
Poster, advancements in care coordination mn sim
 
Poster, section 1115 waivers
Poster, section 1115 waiversPoster, section 1115 waivers
Poster, section 1115 waivers
 
Modeling state based reinsurance
Modeling state based reinsuranceModeling state based reinsurance
Modeling state based reinsurance
 
Comparing Health Insurance Measurement Error (CHIME) in the ACS & CPS
Comparing Health Insurance Measurement Error (CHIME) in the ACS & CPSComparing Health Insurance Measurement Error (CHIME) in the ACS & CPS
Comparing Health Insurance Measurement Error (CHIME) in the ACS & CPS
 
Who Gets It Right? Characteristics Associated with Accurate Reporting of Heal...
Who Gets It Right? Characteristics Associated with Accurate Reporting of Heal...Who Gets It Right? Characteristics Associated with Accurate Reporting of Heal...
Who Gets It Right? Characteristics Associated with Accurate Reporting of Heal...
 
Medicaid vs. Marketplace Coverage for Near-Poor Adults: Impact on Out-of-Pock...
Medicaid vs. Marketplace Coverage for Near-Poor Adults: Impact on Out-of-Pock...Medicaid vs. Marketplace Coverage for Near-Poor Adults: Impact on Out-of-Pock...
Medicaid vs. Marketplace Coverage for Near-Poor Adults: Impact on Out-of-Pock...
 
The Impact of Medicaid Expansion on Employer Provision of Health Insurance
The Impact of Medicaid Expansion on Employer Provision of Health InsuranceThe Impact of Medicaid Expansion on Employer Provision of Health Insurance
The Impact of Medicaid Expansion on Employer Provision of Health Insurance
 
Physician Participation in Medi-Cal: Is Supply Meeting Demand?
Physician Participation in Medi-Cal: Is Supply Meeting Demand? Physician Participation in Medi-Cal: Is Supply Meeting Demand?
Physician Participation in Medi-Cal: Is Supply Meeting Demand?
 
Shadac acs cps-webinar 2016-final_sept21
Shadac acs cps-webinar 2016-final_sept21Shadac acs cps-webinar 2016-final_sept21
Shadac acs cps-webinar 2016-final_sept21
 
2014 SAHIE: Overview with Census Experts
2014 SAHIE: Overview with Census Experts2014 SAHIE: Overview with Census Experts
2014 SAHIE: Overview with Census Experts
 
Adding complexity to an already difficult task: Monitoring the impact of the ...
Adding complexity to an already difficult task: Monitoring the impact of the ...Adding complexity to an already difficult task: Monitoring the impact of the ...
Adding complexity to an already difficult task: Monitoring the impact of the ...
 
Contrasting Measures of Health Insurance Literacy and their Relationship to H...
Contrasting Measures of Health Insurance Literacy and their Relationship to H...Contrasting Measures of Health Insurance Literacy and their Relationship to H...
Contrasting Measures of Health Insurance Literacy and their Relationship to H...
 
Minnesota Accountable Health Model Continuum of Accountability Assessment: Ev...
Minnesota Accountable Health Model Continuum of Accountability Assessment: Ev...Minnesota Accountable Health Model Continuum of Accountability Assessment: Ev...
Minnesota Accountable Health Model Continuum of Accountability Assessment: Ev...
 

Cps uninsuredby state_2010-2011

  • 1. Current Population Survey (CPS) Uninsured by State for All People: 2010 and 2011 2010 2011 Difference Percent Standard Error Percent Standard Error Percent Standard Error Significant UNITED STATES 16.3 0.1 15.7 0.1 -0.6 0.192306 *** Alabama 15.4 1.3 13.0 1.3 -2.4 1.872110 Alaska 18.0 1.1 18.2 1.4 0.2 1.782601 Arizona 19.1 1.3 17.3 1.1 -1.8 1.707154 Arkansas 18.7 1.5 17.5 1.2 -1.2 1.959603 California 19.4 0.5 19.7 0.5 0.3 0.652820 Colorado 13.0 0.8 15.7 1.0 2.7 1.270162 ** Connecticut 11.0 0.7 8.6 0.7 -2.4 0.999021 ** Delaware 11.3 0.9 10.0 0.8 -1.3 1.199791 District of Columbia 12.5 1.1 8.4 0.7 -4.1 1.310043 *** Florida 20.8 0.8 19.8 0.6 -1.0 0.994153 Georgia 19.4 1.2 19.2 0.9 -0.2 1.478025 Hawaii 7.7 0.7 7.8 0.7 0.1 1.000982 Idaho 19.2 1.5 16.9 1.6 -2.3 2.165921 Illinois 14.8 0.9 14.7 0.7 -0.1 1.084765 Indiana 13.4 1.0 12.0 1.0 -1.4 1.422982 Iowa 12.3 1.1 10.0 0.7 -2.3 1.358303 * Kansas 12.7 1.1 13.5 0.9 0.8 1.391400 Kentucky 14.9 1.2 14.4 1.1 -0.5 1.623436 Louisiana 20.0 1.2 20.8 1.1 0.8 1.608869 Maine 9.4 0.7 10.0 1.0 0.6 1.225051 Maryland 13.1 0.9 13.8 0.8 0.7 1.201503 Massachusetts 5.6 0.6 3.4 0.4 -2.2 0.740735 *** Michigan 13.0 0.7 12.5 0.7 -0.5 1.023167 Minnesota 9.8 0.6 9.2 0.7 -0.6 0.882751 Mississippi 21.1 1.3 16.2 1.6 -4.9 2.044432 ** Missouri 14.0 1.1 14.9 1.4 0.9 1.806506 Montana 18.1 1.2 18.3 1.3 0.2 1.809743 Nebraska 13.3 0.8 12.3 0.9 -1.0 1.199368 Nevada 21.3 1.4 22.6 1.2 1.3 1.825381 New Hampshire 10.3 0.7 12.5 0.8 2.2 1.107751 ** New Jersey 15.4 1.0 15.4 0.9 0.0 1.365508 New Mexico 21.6 1.5 19.6 1.9 -2.0 2.471736 New York 15.0 0.7 12.2 0.5 -2.8 0.841594 *** North Carolina 17.0 1.0 16.3 1.0 -0.7 1.387054 North Dakota 13.1 0.9 9.1 1.4 -4.0 1.663593 ** Ohio 13.7 0.8 13.7 0.8 0.0 1.109477 Oklahoma 17.0 1.3 16.9 1.0 -0.1 1.665703 Oregon 16.2 1.1 13.8 0.9 -2.4 1.417438 * Pennsylvania 11.0 0.7 10.8 0.7 -0.2 1.017576 Rhode Island 11.4 0.9 12.0 0.9 0.6 1.256231 South Carolina 20.6 1.1 19.0 1.6 -1.6 1.961760 South Dakota 13.0 0.8 13.0 1.1 0.0 1.378973 Tennessee 14.7 1.1 13.3 0.8 -1.4 1.390954 Texas 24.6 0.8 23.8 0.6 -0.8 1.012664 Utah 13.6 1.1 14.6 1.1 1.0 1.510639 Vermont 9.5 0.8 8.6 0.8 -0.9 1.153323 Virginia 14.1 0.8 13.4 0.7 -0.7 1.108550 Washington 13.8 1.0 14.5 1.0 0.7 1.395555 West Virginia 13.5 1.4 14.9 0.9 1.4 1.696843 Wisconsin 9.4 0.8 10.4 1.0 1.0 1.274564 Wyoming 17.3 0.9 17.8 1.3 0.5 1.595779 Significant difference between years is indicated by confidence levels of: *= 90%, **= 95%, ***= 99%.