Cps uninsuredby state2010_2011
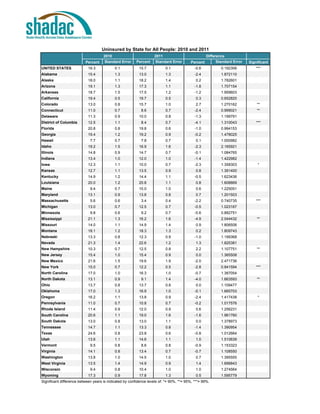
- 1. Uninsured by State for All People: 2010 and 2011
2010 2011 Difference
Percent Standard Error Percent Standard Error Percent Standard Error Significant
UNITED STATES 16.3 0.1 15.7 0.1 -0.6 0.192306 ***
Alabama 15.4 1.3 13.0 1.3 -2.4 1.872110
Alaska 18.0 1.1 18.2 1.4 0.2 1.782601
Arizona 19.1 1.3 17.3 1.1 -1.8 1.707154
Arkansas 18.7 1.5 17.5 1.2 -1.2 1.959603
California 19.4 0.5 19.7 0.5 0.3 0.652820
Colorado 13.0 0.8 15.7 1.0 2.7 1.270162 **
Connecticut 11.0 0.7 8.6 0.7 -2.4 0.999021 **
Delaware 11.3 0.9 10.0 0.8 -1.3 1.199791
District of Columbia 12.5 1.1 8.4 0.7 -4.1 1.310043 ***
Florida 20.8 0.8 19.8 0.6 -1.0 0.994153
Georgia 19.4 1.2 19.2 0.9 -0.2 1.478025
Hawaii 7.7 0.7 7.8 0.7 0.1 1.000982
Idaho 19.2 1.5 16.9 1.6 -2.3 2.165921
Illinois 14.8 0.9 14.7 0.7 -0.1 1.084765
Indiana 13.4 1.0 12.0 1.0 -1.4 1.422982
Iowa 12.3 1.1 10.0 0.7 -2.3 1.358303 *
Kansas 12.7 1.1 13.5 0.9 0.8 1.391400
Kentucky 14.9 1.2 14.4 1.1 -0.5 1.623436
Louisiana 20.0 1.2 20.8 1.1 0.8 1.608869
Maine 9.4 0.7 10.0 1.0 0.6 1.225051
Maryland 13.1 0.9 13.8 0.8 0.7 1.201503
Massachusetts 5.6 0.6 3.4 0.4 -2.2 0.740735 ***
Michigan 13.0 0.7 12.5 0.7 -0.5 1.023167
Minnesota 9.8 0.6 9.2 0.7 -0.6 0.882751
Mississippi 21.1 1.3 16.2 1.6 -4.9 2.044432 **
Missouri 14.0 1.1 14.9 1.4 0.9 1.806506
Montana 18.1 1.2 18.3 1.3 0.2 1.809743
Nebraski 13.3 0.8 12.3 0.9 -1.0 1.199368
Nevada 21.3 1.4 22.6 1.2 1.3 1.825381
New Hampshire 10.3 0.7 12.5 0.8 2.2 1.107751 **
New Jersey 15.4 1.0 15.4 0.9 0.0 1.365508
New Mexico 21.6 1.5 19.6 1.9 -2.0 2.471736
New York 15.0 0.7 12.2 0.5 -2.8 0.841594 ***
North Carolina 17.0 1.0 16.3 1.0 -0.7 1.387054
North Dakota 13.1 0.9 9.1 1.4 -4.0 1.663593 **
Ohio 13.7 0.8 13.7 0.8 0.0 1.109477
Oklahoma 17.0 1.3 16.9 1.0 -0.1 1.665703
Oregon 16.2 1.1 13.8 0.9 -2.4 1.417438 *
Pennsylvania 11.0 0.7 10.8 0.7 -0.2 1.017576
Rhode Island 11.4 0.9 12.0 0.9 0.6 1.256231
South Carolina 20.6 1.1 19.0 1.6 -1.6 1.961760
South Dakota 13.0 0.8 13.0 1.1 0.0 1.378973
Tennessee 14.7 1.1 13.3 0.8 -1.4 1.390954
Texas 24.6 0.8 23.8 0.6 -0.8 1.012664
Utah 13.6 1.1 14.6 1.1 1.0 1.510639
Vermont 9.5 0.8 8.6 0.8 -0.9 1.153323
Virginia 14.1 0.8 13.4 0.7 -0.7 1.108550
Washington 13.8 1.0 14.5 1.0 0.7 1.395555
West Virginia 13.5 1.4 14.9 0.9 1.4 1.696843
Wisconsin 9.4 0.8 10.4 1.0 1.0 1.274564
Wyoming 17.3 0.9 17.8 1.3 0.5 1.595779
Significant difference between years is indicated by confidence levels of: *= 90%, **= 95%, ***= 99%.