Download to read offline
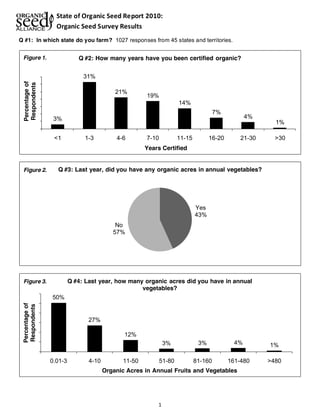

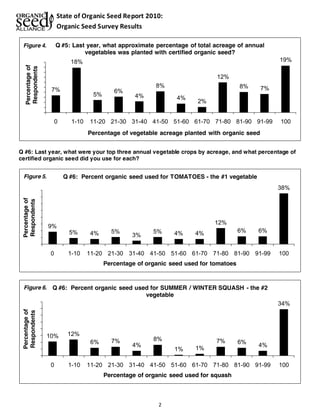
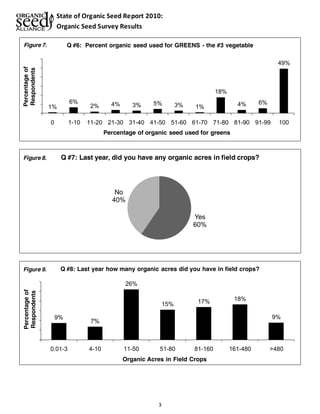
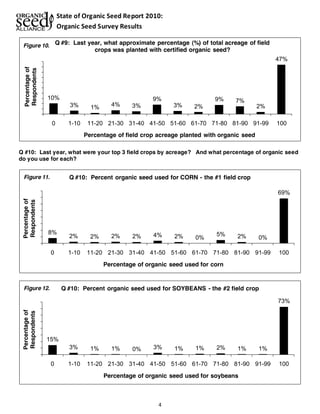
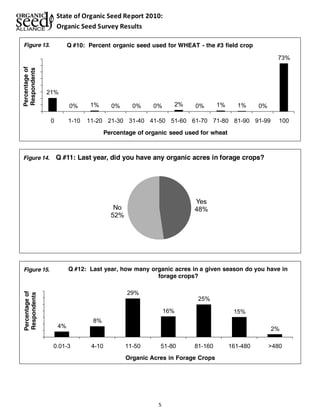
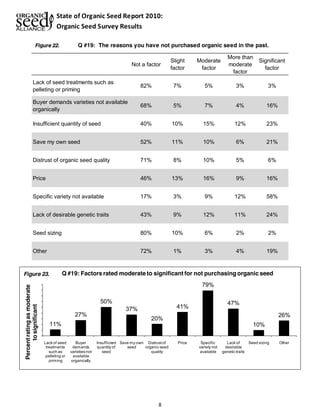
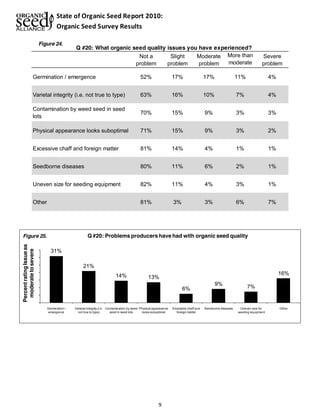
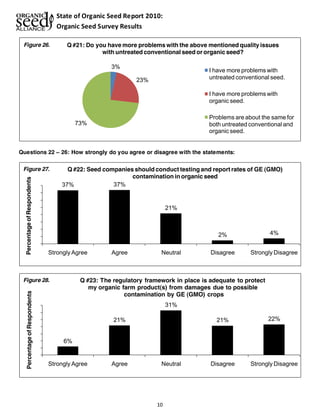
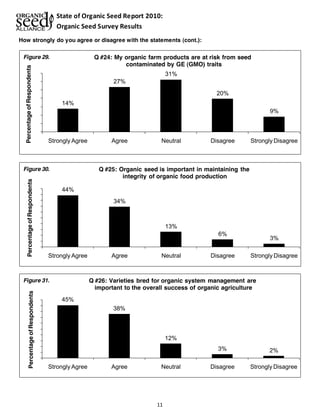
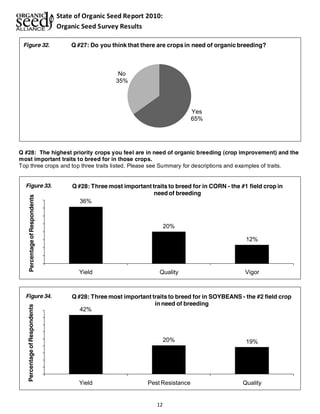
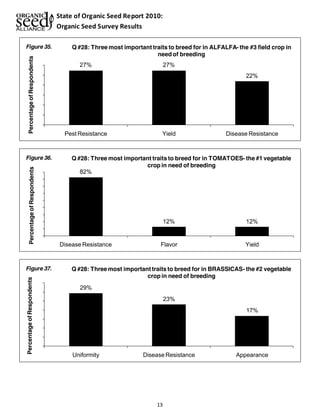
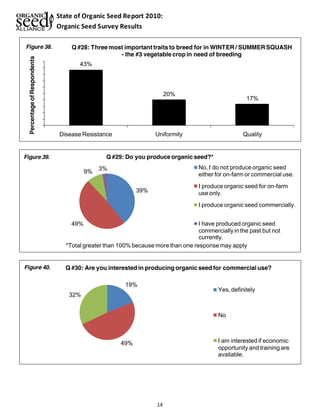
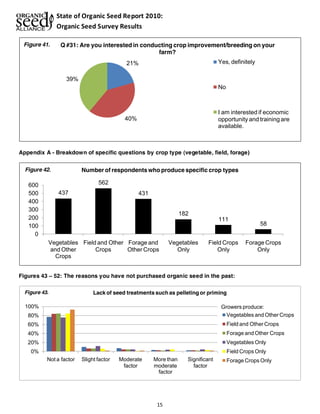
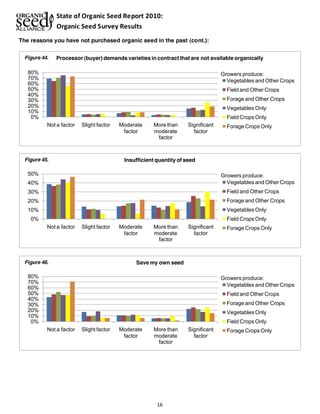
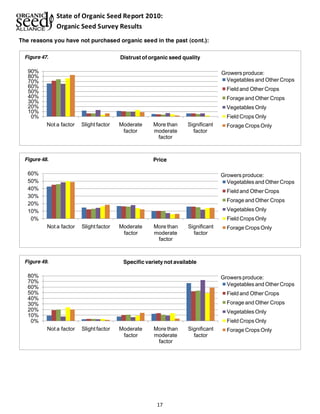
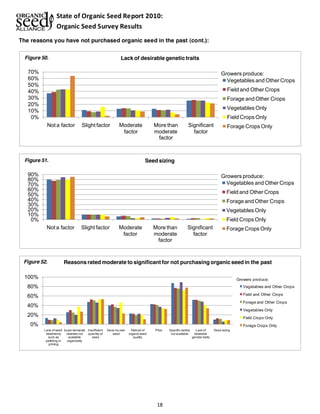
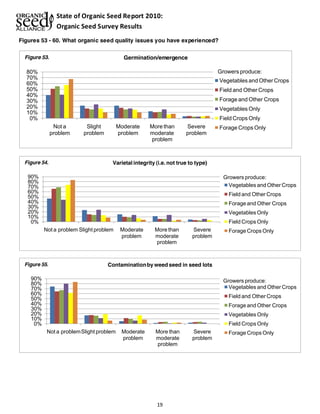
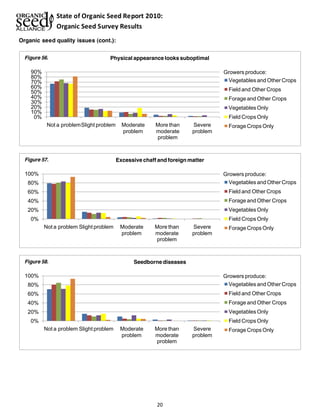
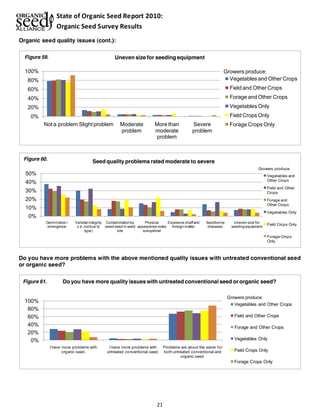
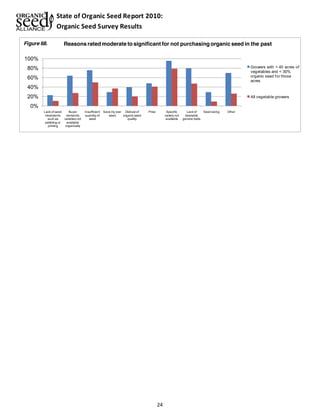

- A survey of over 1,000 organic farmers found that the majority have been certified organic for 1-10 years and grow annual vegetables and field crops. - For their top crops (tomatoes, squash, greens, corn, soybeans, wheat), most farmers use only 1-20% certified organic seed, indicating a need for more organic seed varieties. - Factors preventing farmers from using more organic seed included specific varieties and traits not being available, insufficient seed quantity, and higher price. - Most farmers believe organic seed integrity is important and more crops need organic breeding to develop varieties suited for organic systems.


