Download to read offline
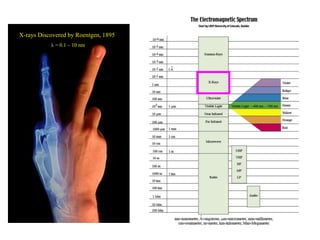
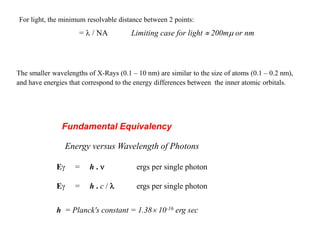


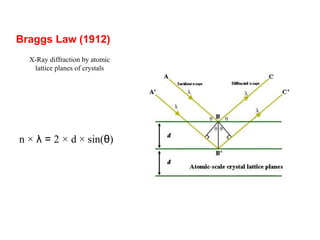
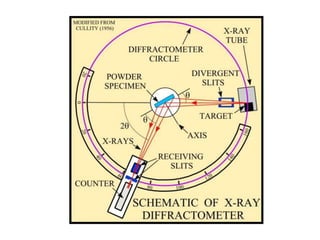
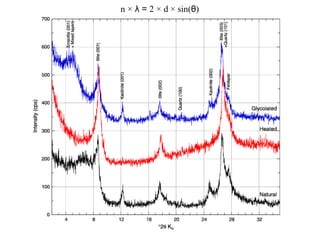


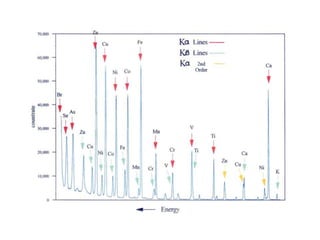
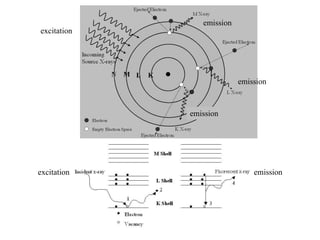
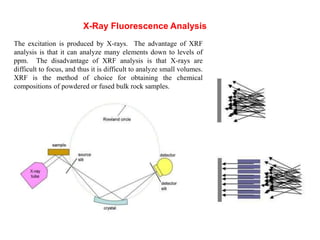
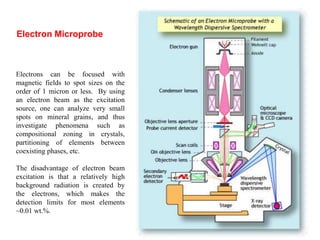
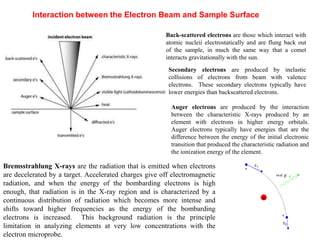
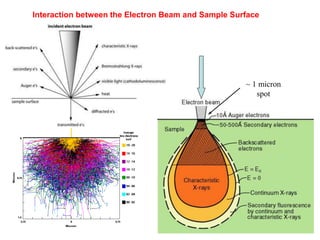
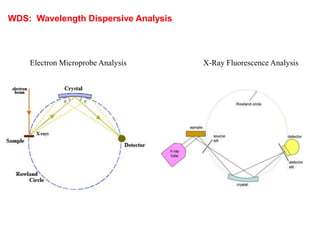


This document provides an overview of x-ray techniques, including: 1. X-rays were discovered in 1895 by Roentgen and have wavelengths between 0.1-10nm, similar to atomic sizes. Bragg's law from 1912 describes x-ray diffraction from atomic lattices in crystals. 2. X-ray fluorescence analysis uses x-rays to excite elements and analyze chemical compositions with parts-per-million sensitivity but limited spatial resolution. Electron microprobes use focused electron beams for higher 1-micron spatial resolution but lower detection limits of 0.01%. 3. Quantitative analysis with electron microprobes requires corrections for matrix effects including atomic number, absorption, and fluorescence to accurately determine elemental concentrations.


