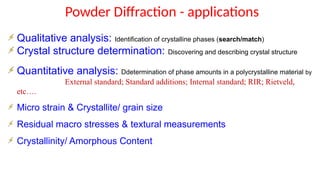
Powder Diffraction -applications
Qualitative analysis: Identification of crystalline phases (search/match)
Crystal structure determination: Discovering and describing crystal structure
Quantitative analysis: Ddetermination of phase amounts in a polycrystalline material by
External standard; Standard additions; Internal standard; RIR; Rietveld,
etc….
Micro strain & Crystallite/ grain size
Residual macro stresses & textural measurements
Crystallinity/ Amorphous Content
6.
Powder Diffraction -applications
Preferred orientation in polycrystalline bodies.
Studies of phase diagrams
A. Phase boundaries; B. Solid solutions; C. Phase transitions
Thin films
• determining lattice mismatch between film and substrate and to inferring stress and
strain
• determining dislocation density and quality of the film by rocking curve measurements
• measuring superlattices in multilayered epitaxial structures
• determining the thickness, roughness and density of the film using glancing incidence
(GI) X-ray reflectivity measurements
& more………!!!!!
Non-destructive
Powerful and rapid (< 20 min)
Small amount of sample
7.
Production of X-Ray& X-ray Tube
Target
Filament
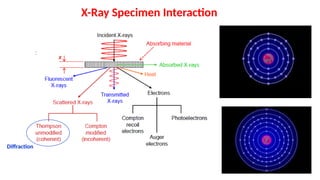
Highly accelerated electrons if suddenly decelerated on impact, some of
the kinetic energy is converted into EM energy, as X rays.
‐
8.
E eV h hc/
Wavelength of the X-ray Produced
If electrons lose all energy at impact (elastic collision), an X-
ray of minimum wavelength is generated:
hc 1
mv
*2
E e V
max e
(A)
V
e
hc (6.626 1034
)(3 108
)
min SWL
e V
(1.6022 1019
)V
12.43 o
min 2
(KV)
This is called the short wavelength limit (SWL)!
If electrons loses a fraction of its energy,
an X-ray of longer wavelength (λ > λSWL)
is produced
This is called white or continuous radiation!
9.
Continuous Vs CharacteristicRadiation
Continuous /Bremsstrahlung “white” or “braking”
radiation: X-rays from deceleration of electrons Characteristic: X-rays from core-level ionization
If incident e-’s have enough energy to knock inner shell electrons from their orbits an electron from a higher
energy level can fall into the lower energy state emitting an X-ray with a characteristic energy/wavelength
10.
The broad humpoccurs where there is the most probable energy
loss
SWL
SWL
C
h
a
r
.
C
o
n
ti
.
Effect of Voltage on Characteristic Radiation
X-ray deflectsfrom its original path with or without energy loss.
X-ray scattered by multiple atoms will interact.
They are coherent if they are in phase (i.e., they reinforce each other).
Coherent X-rays “interfere” constructively.
For closely spaced planes of atoms, scattered waves reinforce or cancel.
Constructive interference: waves are in phase leading to a strong signal (i.e.,
big resultant wave).
Destructive interference: waves are out of phase leading to a reduced or non-
existent signal.
Diffraction: Points to collect!!!
14.
Bragg’s Law
For allwaves to be in phase, their collective path differences (δ) equal integral
number of must be to an wavelengths
(i.e., δ = n)
When waves I and II are
in phase
DE + EC′ = = n
16.
Intensity of DiffractedBeams
The type of unit cell influences the intensity of the diffracted beam but not the
direction of the diffracted beam
The path difference between rays 1’ and 2’, 1’-2’ (i.e., ABC) = 1λ (i.e., one
wavelength).
The path difference between rays 1’ and 3’, 1’-3’ (i.e., DEF) = ½× 1’-2’ (i.e., one wavelength) or 1’-3’
= ½× λ (i.e., 180°)
17.
Implications
Diffracted wavesfrom the (001) and (002) crystal planes are 180° out of phase and will
cancel each other out.
Thus, there will not be a (001) reflection in a body centered cell.
For some crystal structures certain reflections will be absent. They are called forbidden
reflections.
We can assess which reflections are allowed and which are forbidden via a structure
factor calculation.
Essential programs tocollect/Analize data
1. Data Collector (instrument control and data collection)
2. High Score Plus (data analysis)
3. Data Viewer (data visualization and analysis)
4. Database (ICDD/ICSD)
+
Database: ICDD/ICSD
22.
Note: The DataCollector program from PANalytical should be running all the time (Don’t
close the program or disconnect the instrument once your data collection is
completed).
23.
PREPARE THE INSTRUMENT
Setthe generator to “Running” mode with 45 kV (tension) and 40 mA (current).
Data Collector Main GUI Instrument Setting window for X-Ray tube
24.
SELECT AND EXECUTETHE PROGRAM
A quick way to collect powder XRD data from a sample using a pre-existing. All new users should be
properly trained by the X-Ray Facility personnel before using the instrument independently
Phase Identification
Methods:
• StandardCalculation
• Compare with standard Database
The International Centre for Diffraction
Data (ICDD), (formerly known as Joint
Committee on Powder Diffraction
Standards (JCPDS)) maintains a
database of powder diffraction patterns,
the Powder Diffraction File (PDF).
(1) file number, (2) three strongest lines, (3) lowest-
angle line, (4) chemical formula and name of the
substance, (5) data on diffraction method used, (6)
crystallographic data, (7) optical and other data, (8)
data on specimen, (9) diffraction pattern.
The Database:
27.
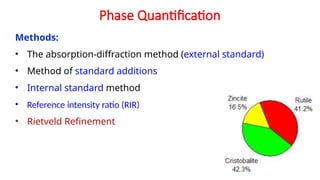
Phase Quantification
Methods:
• Theabsorption-diffraction method (external standard)
• Method of standard additions
• Internal standard method
• Reference intensity ratio (RIR)
• Rietveld Refinement
X’Pert Highscore Plus:The Analysis Software
Phase Identification: Search Match in the database Phase Quantification and advanced
analysis: Rietveld Refinement
Electron microscopy isthe science and technology of using an electron beam to form a magnified image.
What is electron microscopy?
Scanning Electron Microscope @ NITW
34.
Extremely expensive
It isoften necessary to coat the specimen with a very thin layer of metal (such as gold). The metal is able to reflect the
electrons.
The sample must be completely dry. This makes it difficult to observe living specimens.
It is not possible to observe moving specimens.
It is not possible to observe colour. The image is only black/white. Sometimes the image is coloured artificially to give a better
visual impression.
Require more training and experience in identifying artifacts that may have been introduced during the sample preparation
process.
The energy of the electron beam is very high. The sample is therefore exposed to high radiation, and therefore not able to live.
Maintenance costs & space requirements are high.
Light Microscope Vs Electron Microscope
The use of electrons rather than light provides a ~1000 increase in resolving power (i.e., ability to focus fine details) and
higher magnification (up to 2 million times) over light.
It is possible to view the three dimensional external shape of an object because of Greater depth of field
Advantages:
Limitations:
35.
Magnification = Howlarge an object can be made (and still resolved)
Image Size is the image of
the screen (constant).
Magnification
Magnification is the process of enlarging something only in appearance, not in
physical size. This enlargement is quantified by a calculated number also called
"magnification". When this number is less than one, it refers to a reduction in
size, sometimes called "minification" or "de-magnification".-Wiki
36.
Resolution
Resolution = theclosest distance between two points that can clearly be resolved as separate entities through the
microscope.
37.
Resolution Criteria
Rayleigh’s criterion:“Two point sources are just resolved if they have an
angular separation equal to the angular radius of the Airy disk”
According to the Rayleigh criterion, two closely spaced Airy disks are distinct if they are farther apart than
the distance at which the principal maximum of one Airy disk coincides with the first minimum of the second
Airy disk
First Minima
2nd
Minima
38.
r is theminimum distance between resolvable points, in the same
units as is specified
= wavelength of illuminant
= semi-angle
μ = index of refraction
NA = numerical aperture = μ sin
0.61 is a geometrical term, based on the average 20-20 eye
Note:
In order to obtain higher resolution (smallest r), it is required to decrease l or increase μ or a.
The higher the NA the greater the resolution
The limits of the objective lens in OM are that a cannot be greater than 90, and that the object space can only reach an NA =
1.4
Resolution Criteria
According to Rayleigh’s criterion:
39.
Depth of Field
OpticalSEM
Screw length: ~ 0.6 cm
The same factors that effect resolution effect the depth of field but in the opposite way; therefore, a compromise
must be reached between these two factors.
The distance along the optic axis over which image details can be
observed with acceptable clarity.
Depth of Field/ Depth of Focus
• The depth of field (d) is a measure of how much of the object we are looking at remains ‘in focus’ at the same time.
• The distance over which the image remains in focus is called depth of focus (D). It is the distance normal to the specimen
surface that is within acceptable focus when the microscope is precisely focused on the specimen surface.
D is important when
imaging non-flat samples.
Example: Fractography
42.
Wavelength of Electrons
Commonlyused KV
SEM: up to 40 kV
TEM: up to 400 kV
Maxwell’s equations: p=E/c=hf/c=h/ [since, c=f]
The wavelength of the electron can be tuned by changing the accelerating voltage.
de Broglie:
λ: wavelength associated with the particle
h: Plank’s constant 6.63×10⁻³⁴
Js;
mv: momentum of the particle
me= 9.1×10⁻³¹
kg; e= 1.6×10⁻¹⁹
coulomb
(for Vin KV, λ in Å)
V of 1eV , λ= 12.3 Å
V of 60 kV, λ= 0.05 Å
V of 100kV, λ= 0.039 Å
Microscopes using electrons as illuminating
radiation
43.
Optical Microscope ElectronMicroscope
(violet light) 400
nm
0.001 nm (function of KV applied)
Resolution= 0.612/sin
=0.612400/1.6
=152 nm
Resolution= 0.612/sin
= 0.612/
=0.02 nm
Light Microscope Vs. Electron Microscope
Larger and poor resolution Smaller and high resolution
44.
What information canwe obtain from electron
microscopes?
• Topography
– Surface features of an object. “How it looks.”
• Morphology
– Size and shape of particles making up object.
• Composition
– Relative amount of elements and compounds making up the
object.
• Structure
– Crystallography. How atoms are arranged in the object
– Substructure. Defect type and content.
45.
Primary types ofelectron
microscopes
• Transmission electron
microscope (TEM)
&
• Scanning electron
microscope (SEM) Bug Eggs under SEM
46.
FEATURE Optical MicroscopeSEM TEM
Uses Surface morphology and
sections (1-40 m)
Surface morphology Sections (40 150 nm) or small
particles on thin membranes
Source of
Illumination
Visible light High-speed electrons High-speed electrons
Best resolution ~200 nm 3 – 6 nm 0.2 nm
Magnification
range
2 – 2,000 20 – 150,000 500 – 1,000,000
Depth of field 0.002-0.05 nm
(NA=1.5)
0.003-1 mm 0.004-0.006 mm
(NA=10-3
)
Lens type Glass Electromagnetic Electromagnetic
Image ray
formation spot
On eye by lens On CRT by scanning device On phosphorescent screen by lens
Information
generated
Phases
Reflectivity
Topography, Composition,
Crystal orientation
Crystal structure, Crystal orientation,
Defects, Composition
Limiting Factors Wavelength of light Brightness, signal/noise ratio,
emission volume
Lens quality
Comparison of different types of microscope
How do electronmicroscopes work?
Form a stream of electrons and accelerate them towards a specimen using a positive electrical
potential.
Use apertures and magnetic lenses to focus the stream onto the sample.
Interactions occur inside the irradiated area of the sample that we collect in a suitable detector.
Optical Arrangement of SEM
Animation
Raster scan (singleframe)
Elements of a single-frame raster scan: AB
and YZ are the first and last line scans in the
frame, Y and Y’ represent adjacent pixels
SEM probe scans horizontally across the specimen in two perpendicular
(x and y) directions.
The x-scan is relatively fast and is generated by a saw tooth-wave
generator operating at a line frequency fx ;
The y-scan is much slower and is generated by a second sawtooth-wave
generator running at a frame frequency fy = fx /n where n is an integer
51.
How do weget an image?
156 electrons!
Image
Detector
Electron gun
288 electrons!
52.
Major components ofan SEM
Please visit nice animation on SEM:
http://www.kcvs.ca/site/projects/physics_files/sem
/resources/semIntro.html#
http://li155-94.members.linode.com/myscope/sem/practice/virtualsem/
Virtual SEM
53.
How is afine electron bean formed?
The electron source (diameter do) formed by electron gun
is reduced and made into a fine electron bean (diameter
dk) by the condenser lens and objective lens.
Haw can we obtain an even finer electron bean?
In order to obtain a fine electron bean, the instrument utilizes an
electron gun featuring:
a small electron source,
a large electrons per time per unit area (high current density)
a small energy width (small electron spot ) of discharged
electrons.
Electron guns (Source)
54.
What kind ofelectron sources is used in the SEM?
Field emission guns, create a strong electrical field to pull
electrons away from the atoms.
Thermionic guns type, apply thermal energy to a filament
(usually made of tungsten, which has a high melting point)
- cold field emission,
- Schottky,
- tungsten,
- LaB6 (lanthanum hexaboride)
There are three types of electron gun according to the method of emission:
- field emission type (FE) electron gun,
- Schottky electron gun and,
- thermal electron gun.
Modern: field emission guns (FEG) (cold/thermally assisted
guns, a strong electric field is used to extract electrons)
Traditional guns: thermionic electron gun (electrons are
emitted when a solid is heated)
Tungsten wire
Single crystal of LaB6 Single crystal of W, etched to a thin tip
55.
Emission (kind ofgun) Thermionic Field Emission Schottky
Cathode Material W
(tungsten hairpin)
LaB6
(single/multi
crystal)
FE
(tungsten)
Tungsten /zirconium
oxide (single crystal)
Diameter of Electron
Source (nm)
30,000 10,000 5 20
Cathode work Function
(eV)
4.4 2.6 to 2.7 4.1 2.7 to 2.9
Brightness (A/cm2
.sr*) 106
107
109
108
Energy spread (eV) 1-5 (~2) 0.5-3.0 (~1.5) 0.2-0.3 0.3-1.0
Operating Lifetime
(hrs/months)
~50 hrs ~1000 hrs ≥12 months ~9 months
Vacuum (Pa) ~10-4
~10-5
~10-8
~10-7
Temperature of cathode
(°C) ~2330 ~1530 ~25 (room temp.) ~1430-1530
Comparison of Characteristics of SEM Electron Guns
*square centimetre times steradian
56.
Signals and ElectronMicroscopy
Important signals in
analytical electron
microscopy:
Signals must escapethe
sample to be detected
Interaction Depth
Signals originate from different depths inside of the sample
Z = 29 (Cu)
@20kV
59.
Secondary Electrons (SE)and Backscattered Electrons (BSE)
A new electron is knocked out (Inelastic scattering)
SE BSE
An incoming electron rebounds back out
(Elastic scattering)
60.
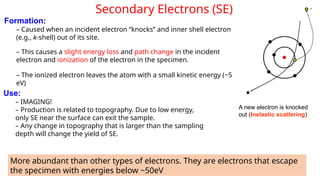
Secondary Electrons (SE)
Formation:
–Caused when an incident electron “knocks” and inner shell electron
(e.g., k-shell) out of its site.
– This causes a slight energy loss and path change in the incident
electron and ionization of the electron in the specimen.
– The ionized electron leaves the atom with a small kinetic energy (~5
eV)
More abundant than other types of electrons. They are electrons that escape
the specimen with energies below ~50eV
Use:
– IMAGING!
– Production is related to topography. Due to low energy,
only SE near the surface can exit the sample.
– Any change in topography that is larger than the sampling
depth will change the yield of SE.
A new electron is knocked
out (Inelastic scattering)
61.
Backscattered electrons (BSE)
Formation:
–Caused when incident electrons collide with an
atom in a specimen that is nearly normal to the path
of the incident beam.
– Incident electron is scattered backward
(“reflected”).
Use:
– Imaging: grain boundaries, phase boundaries, and
other crystal features
– crystal orientation: diffraction (EBSD) analysis
– Detect composition differences: Production varies
with atomic number (Z), Higher Z elements appear
brighter than lower Z elements.
Backscattered electrons are not as numerous as others. However, they generally
carry higher energies than other types of electrons.
An incoming electron rebounds
back out (Elastic scattering)
62.
How does BSEdetect differences in
composition?
• High atomic number (Z) greater elastic scattering &
shorter penetration depth
• Greater elastic scattering better spatial resolution
• Materials with low Z have greater inelastic scattering
• High Z materials appear brighter
63.
Factors that affectBSE emission
• Direction of the irritated surface
– more electrons will hit the BSE detector when the surface is aligned towards
the BSE detector
• Average atomic number
• When you want to study differences in atomic numbers the sample
should be as levelled as possible (sample preparation is an issue!)
64.
Titanium: Atomic No22 Silicon: Atomic No 14
SE Vs BSE Imaging
The higher the atomic number of the atoms the more backscattered electrons are ‘bounced back’ out. This makes the
image brighter for the larger atoms
Difference in contrast No difference in contrast
Higher the average atomic number, the
more primary electrons are scattered
(bounced) back out of the sample
semiconductor
sample
semiconductor
sample
65.
Secondary vs. Backscattered
Higherresolution, No Z contrast Lots of Z contrast, Lower resolution
Comparison between (a) a SE image and (b) BSE image of Ni alloy. Additional compositional
information is obtained from BSE image
Al2O3-Ni Composite
▶ non-conductive material
▶no electrons escaping from
specimen
▶ Gold coating
Au, Pd, Pt
More electron
Diffraction
Charging effect: Big concern of SEM
69.
Influence of charge-upon image quality
When a nonconductive specimen is directly illuminated with an electron beam, its electrons with a negative charge collect locally
(specimen charge-up), thus preventing normal emission of secondary electrons. This causes abnormal contrast, image deformation
and shift.
Specimen: Part of vinegar fly
Methods to reduce specimen charge-up:
1) Reducing the probe current 2) Lowering the accelerating voltage
3) Tilting the specimen to find a balanced point between the amount of incident electrons and the amount of electrons that go out
of the specimen (this point varies with the specimen).
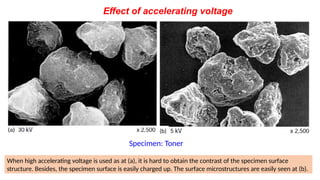
70.
When high acceleratingvoltage is used as at (a), it is hard to obtain the contrast of the specimen surface
structure. Besides, the specimen surface is easily charged up. The surface microstructures are easily seen at (b).
Effect of accelerating voltage
Specimen: Toner
(b)
71.
The image sharpnessand resolution are better at the higher accelerating voltage, 25 kV.
Effect of accelerating voltage
Specimen: Au Particles
72.
Effect of probecurrent
Smaller the electron probe diameter on the specimen, higher the magnification and resolution.
However, image smoothness, depends on the probe current.
• Soft (smooth) image: Details are less pronounced which means that
the difference between adjacent pixels is smaller.
• Sharpe image: More contrast between pixels which sometimes
referred to as micro-contrast as opposed to overall image contrast.
• Micro-contrast: Ability of the lens to differentiate between smaller
and smaller details of more and more nearly similar tonal value
73.
The smaller theprobe current, the sharper is the image, but the surface smoothness is lost.
Specimen: Ceramic
10 kV, x 5,400
Effect of probe current…contd.
74.
Effect of Workingdistance and objective aperture
BEI: Backscattered electron image
75.
Lenses with highNAs usually have a lower working distance
The working distance of an objective lens is the distance
between the front lens mount and the focal plane
Working Distance
76.
Effect of Workingdistance and objective aperture
The smaller the OL aperture diameter and the longer the WD, the greater the depth of field.
Specimen:
Electric bulb coil
5 kV, x540
77.
Specimen damage byelectron beam
Specimen: Compound eye of fly. , 5 kV, x1,00
Temperature at irradiated point dependent on:
1) The accelerating voltage
2) Scanning area.
3) Scanning time.
4) Heat conductivity of the specimen.
To avoid this damage:
1) Reduce accelerating voltage.
2) Decrease electron beam intensity.
3) Shorten exposure time
4) Photograph large scanning areas with low
magnifications.
5) Control the thickness of coating metal on the
specimen surface.
6) Adjust astigmatism and brightness beforehand using
another similar spot
The loss of electron beam energy in the specimen occurs mostly in the form of heat generation at the
irradiated point
• When amaterial is heated its structural and chemical composition can undergo
changes such as fusion, melting, crystallization, oxidation, decomposition,
transition, expansion and sintering.
Definition: Series of techniques for measuring the temperature dependency of a physical property of a
certain substance while varying the temperature of the substance according to a specific program.
Introduction
It is necessary to characterize
materials and their behavior over a
range of temperatures to determine
what materials are suitable for
specific uses and to determine what
temperature range materials or
chemicals can withstand without
changing.
Name of thetechnique Instrument employed Parameter measured Graph
Thermogravimetric analysis (TGA) Thermobalance Mass Mass vs temperature
Differential thermal analysis (DTA) DTA apparatus ∆T ∆T vs temperature
Differential scanning calorimetry
(DSC)
Differential scanning calorimeter Heat difference
dH/dt
dH/dt vs temperature
Thermometric titrimetry Calorimeter Temperature Temperature vs titrant volume
Dynamic reflectance spectroscopy
(DRS)
spectrophotometer Reflectance % reflectance vs temperature
Evolved gas detection (EGD) Thermal conductivity cell Thermal conductivity(TC) TC vs temperature
Dilatometry (TMA) Dilatometer Volume or length Volume or length vs
temperature
Electrical conductivity (EC) Electrometer or Bridget Current(I) or Resistance(R) I or R vs temperature
Emanation thermal analysis (ETA) ETA apparatus Radioactivity (E) E vs temperature
Derivative thermogravimetry (DTG) Thermobalance dm/dt dm/dt vs time
Thermal Analysis Methods
Thermogravimetric Analysis (TGA)
ATGA consists of three major parts:
1. Furnace surrounding a sample holder
2. Microgram balance
3. Purge gas system for providing inert or reactive atmospheres
Principle:
A sample is heated in a given environment (Air,
N2, CO2, He, Ar etc.) at controlled rate and
change in the weight of a substance is recorded
as a function of temperature or time.
Instrument: Instrument used for thermogravimetry is
“Thermobalance”. Data recorded in form of curve
known as ‘Thermogram’.
85.
Thermo Gravimetric Analysis(TGA)
Note: Processes occurring without change in mass (e.g.- Physical transitions ) cannot be
studied by TG.
Usually observes mass loss:
• decomposition
• sublimation
• reactivity and desorption of products
Can observe mass gain:
• oxidation, forming non-volatile oxides
Mass of material a functions of temperature.
Differential Thermal analysis(DTA)
Measure sample temperature relative to a reference, for the same heat transferred
If zero temperature difference b/w sample & reference material – sample does not undergo any chemical or
physical change.
If any reaction (physical or chemical change) takes place temperature difference (∆T) will occur b/w sample
& reference material .
DTA Plot
Note: Thearea under a DTA peak is the enthalpy change and is not affected by the heat
capacity of the sample.
Endothermic: Heat being absorbed by the sample-
phase changes such as melting (fusion),
vaporization, sublimation, and some transitions
between two different crystal structures for a
material. Chemical reactions can be endothermic,
including dehydration, decomposition, oxidation–
reduction, and solid–state reactions.
Exothermic: Heat being given off by the sample-
phase changes such as freezing (crystallization),
some transitions between different crystal
structures and chemical reactions; decomposition,
oxidation–reduction, and chemisorption can be
exothermic.
•The sample andreference are maintained at the same temperature, even
during a thermal event in the sample
•The energy (heat) required to maintain zero temperature difference between
the sample and the reference is measured
•During a thermal event in the sample, the system will transfer heat to or fro
from the sample pan to maintain the same temperature in reference and
sample pans
DSC: Principle
94.
DSC: The Instrument
Twobasic types of DSC instruments: Power compensation DSC and heat-flux DSC
Power compensation DSC
Heat flux DSC
Power compensated DSC: Temperature differences between the sample and reference are ‘compensated’ for by varying the
heat required to keep both pans at the same temperature. The energy difference is plotted as a function of sample
temperature
Heat flux DSC ultilizes a single furnace. Heat flow into both sample and reference material via an electrically heated
constantan thermoelectric disk and is proportional to the difference in output of the two themocouple junctions
95.
DSC Thermogram
Temperature
Heat
Flow
-
>
exothermic
Glass
Transition
Crystallization
Melting
Cross-Linking
(Cure)
Oxidation
The resultof a DSC experiment is a curve of heat flux
versus temperature or versus time.
• Exothermic: Positive or negative peak,
depending on the kind of technology used in
the experiment.
• Enthalpies: by integrating the peak
corresponding to a given transition. The
enthalpy of transition can be expressed using
equation: ΔH = KA
Where, ΔH is the enthalpy of transition,
K is the calorimetric constant,
A is the area under the peak.
• The calorimetric constant varies from
instrument to instrument, and can be
determined by analyzing a well-characterized
material of known enthalpies of transition.
• Area under the peak is directly proportional to
heat absorbed or evolved by the reaction
• height of the peak is directly proportional to
rate of the reaction
96.
Factors affecting DSCcurve
Instrumental factors
a- Furnace heating rate
b- Recording or chart speed
c- Furnace atmosphere
d- Geometry of sample
holder/location of sensors
e- Sensitivity of the recoding system
f-Composition of sample containers
Sample characteristics
a- Amount of sample
b- Nature of sample
c- Sample packing
d- Solubility of evolved
gases in the sample
e- Particle size
f- Heat of reaction
g- Thermal conductivity
97.
Influence of SampleMass
Temperature (°C)
150 152 154 156
0
-2
-4
-6
DSC
Heat
Flow
(W/g)
10mg
4.0mg
15mg
1.7mg
1.0mg
0.6mg
Indium at
10°C/minute
Normalized Data
158 160 162 164 166
Onset not
influenced
by mass
154 156 158 160 162 164 166 168 170
-5
-4
-3
-2
-1
0
1
Temperature (
°C)
Heat
Flow
(W/g)
heating rates = 2, 5, 10, 20
C/min
Effect of Heating Rate on Indium
Melting Temperature
Factors affecting DSC curve…Contd.
98.
Comparison of DTAand DSC
Aspect DSC DTA
Principle Measure heat absorbed
or liberated during
heating or cooling
Measure sample
temperature relative to
a reference, for the
same heat transferred
Size of the sample 2-10 mg 50-20 mg
Sensitivity of the
measurement
a few J/mole 0.5 KJ/mole
Heating and
cooling cycles
Programmed heating
and cooling possible
Generally programmed
heating
Specific heat
measurement
accurate Not accurate
DTA
DSC
99.
Thanks for Listening!!!
TG?..
DTA ??
DSC ???
ΔH ?
XRD
DTG
/DTA ???
ΔT ?
sample ?
Electron Gun
SEM
Any Question?
Editor's Notes
#50 During its x-deflection signal, the electron probe moves in a straight line, from A to B, forming a single line scan.
After reaching B, the beam is deflected back along the x-axis as quickly as possible (the flyback portion of the x- waveform).
But because the y-scan generator has increased its output during the line-scan period, it returns not to A but to point C , displaced in the y-direction.
A second line scan takes the probe to point D, at which point it flies back to E and the process is repeated until n lines have been scanned and the beam arrives at point Z.
This entire sequence constitutes a single frame of the raster scan
#54 “SEM electron sources – cold field emission, Shottky, tungsten, Lab6”
#72 micro-contrast: Ability of the lens to differentiate between smaller and smaller details of more and more nearly similar tonal value
#89 Definition: DTA is a technique in which the temperature between sample & thermally inert reference substance is continuously recorded as a function of temperature /time.


![Wavelength of Electrons
Commonly used KV
SEM: up to 40 kV
TEM: up to 400 kV
Maxwell’s equations: p=E/c=hf/c=h/ [since, c=f]
The wavelength of the electron can be tuned by changing the accelerating voltage.
de Broglie:
λ: wavelength associated with the particle
h: Plank’s constant 6.63×10⁻³⁴
Js;
mv: momentum of the particle
me= 9.1×10⁻³¹
kg; e= 1.6×10⁻¹⁹
coulomb
(for Vin KV, λ in Å)
V of 1eV , λ= 12.3 Å
V of 60 kV, λ= 0.05 Å
V of 100kV, λ= 0.039 Å
Microscopes using electrons as illuminating
radiation](https://image.slidesharecdn.com/xrd1ppt-251216042031-3f0382fe/85/Material-Characterization-techniques-pptx-42-320.jpg)