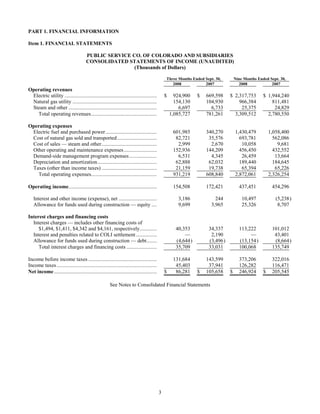
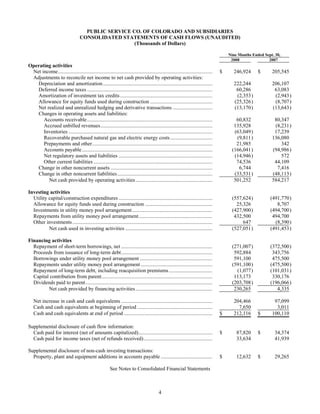
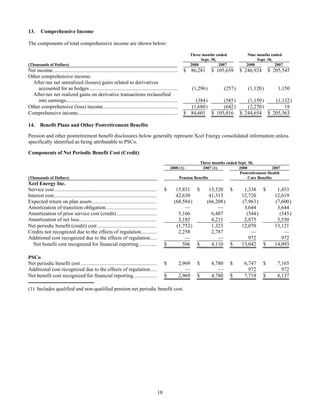
- Public Service Company of Colorado (PSCo) filed a quarterly report on Form 10-Q with the SEC for the quarter ended Sept. 30, 2008.
- PSCo is a wholly owned subsidiary of Xcel Energy Inc. that operates regulated electric and natural gas utilities in Colorado.
- For the quarter, PSCo reported net income of $86.3 million on operating revenues of $1.1 billion, compared to net income of $105.7 million on operating revenues of $781.3 million for the same quarter last year.
- Public Service Company of Colorado filed a quarterly report on Form 10-Q with the SEC for the quarter ended September 30, 2007.
- The company reported operating revenues of $781 million for the quarter and $2.78 billion for the nine months ended September 30, 2007.
- Net income for the quarter was $106 million and $210 million for the nine months ended September 30, 2007.
This document is Southwestern Public Service Company's Form 10-Q quarterly report filed with the SEC for the quarter ended September 30, 2008. It includes:
1) Financial statements showing operating revenues increased from the prior year quarter and year-to-date periods, while net income decreased slightly year-over-year.
2) Management's discussion and analysis of financial results, focusing on factors influencing revenues, expenses, and earnings.
3) Disclosure of controls and procedures to ensure the financial statements are fairly presented.
The report provides required public disclosures of the company's financial position and performance for the quarter.
- Northern States Power Company (NSP-Wisconsin), a wholly owned subsidiary of Xcel Energy Inc., filed a quarterly report on Form 10-Q with the SEC for the quarter ended September 30, 2007.
- The filing includes consolidated financial statements and notes to the financial statements for the third quarter and year-to-date periods ended September 30, 2007 and 2006.
- For the third quarter of 2007, NSP-Wisconsin reported net income of $16.65 million compared to $16.65 million for the same period in 2006. Year-to-date net income as of September 30, 2007 was $31.08 million compared to $40.09 million for
This document is SPS's Form 10-Q quarterly report filed with the SEC for the quarter ended September 30, 2007. It includes SPS's unaudited financial statements and notes. The financial statements show that for the quarter, SPS reported operating revenues of $471.5 million and net income of $21.2 million. For the nine months ended September 30, 2007, SPS reported operating revenues of $1.238 billion and net income of $28.4 million. The balance sheet shows that as of September 30, 2007, SPS had total assets of $2.694 billion, including $2.023 billion in net property, plant and equipment.
This document is NSP-Wisconsin's Form 10-Q quarterly report filed with the SEC for the quarter ended September 30, 2008. It includes NSP-Wisconsin's consolidated financial statements and notes. The financial statements show that for the quarter, operating revenues were $192 million, net income was $11.1 million, and basic earnings per share were $11.91. As of September 30, 2008, total assets were $1.48 billion and shareholders' equity was $450.7 million. The notes provide details on NSP-Wisconsin's significant accounting policies and recently issued accounting pronouncements.
This document provides an SEC quarterly report filed by Steiner Leisure Ltd for the period ending March 31, 2009. It includes Steiner Leisure's condensed consolidated balance sheet, statement of income, and statement of cash flows for the first quarter of 2009, as well as notes to the financial statements. The financial statements show that for the quarter, Steiner Leisure had total revenues of $117.1 million, net income of $7.9 million, and net cash provided by operating activities of $8.5 million.
This document is a Form 10-Q quarterly report filed by Tenet Healthcare Corporation with the SEC for the quarter ended August 31, 2002. It includes condensed consolidated financial statements such as the balance sheet, income statement, and cash flow statement. The balance sheet shows the company had total assets of $13.7 billion as of August 31, 2002, including $3.4 billion in goodwill. The income statement shows net income of $338 million for the quarter. Cash flow from operations was $696 million for the quarter.
This document is Northern States Power Company's (NSP-Minnesota) quarterly report filed with the Securities and Exchange Commission for the quarter ending September 30, 2007. It includes NSP-Minnesota's consolidated financial statements and notes. The financial statements show that for the quarter, NSP-Minnesota had operating revenues of $1.09 billion, operating income of $244 million, and net income of $121 million. For the nine months ended September 30, 2007, operating revenues were $3.21 billion, operating income was $465 million, and net income was $220 million. The balance sheet lists NSP-Minnesota's assets as $9.62 billion and liabilities and equity as also $
This document is an amendment to a quarterly report filed with the SEC that restates financial statements for the first quarters of 2003 and 2002. It includes adjustments to correct errors in accounting periods for certain expenses, workers' compensation accruals, rental expenses, consulting costs, and a deferred compensation plan. The restatements resulted in increases and decreases to previously reported net income and diluted earnings per share.
This document is Tenet Healthcare Corporation's annual report on Form 10-K for the fiscal year ended December 31, 2008. It provides information on Tenet's business operations, including that it operates 53 general hospitals and other healthcare facilities across 12 states. It lists the hospitals by region and state, and describes the services offered and accreditation of the facilities. The report also discusses Tenet's strategies to improve quality of care and operating efficiencies while maintaining compliance with regulations.
This document is Tenet Healthcare Corporation's annual report on Form 10-K for the fiscal year ended December 31, 2008. It provides information on Tenet's business operations, including that it operates general hospitals and related healthcare facilities in 12 states. It lists the specific hospitals owned or leased by Tenet in each state and other details such as number of beds. The report also discusses Tenet's strategies, acquisitions, divestitures, and new facilities. It provides an overview of Tenet's organizational structure and factors that affect its financial performance.
This document is Berkshire Hathaway's quarterly report filed with the SEC for the period ending June 30, 2005. It includes Berkshire's consolidated balance sheet, showing over $194 billion in total assets including over $162 billion in insurance and other assets, and over $28 billion in finance and financial products assets. It also shows over $94 billion in total liabilities, including over $45 billion in losses and loss adjustment expenses for its insurance operations. The report provides Berkshire's financial statements and disclosures for the quarter as required by the SEC.
This document is a quarterly report filed with the SEC by Public Service Company of Colorado (PSCo). It provides financial statements and notes for the quarter ended March 31, 2008. The financial statements show that PSCo had operating revenues of $1.2 billion for the quarter and net income of $94.3 million. Cash provided by operating activities was $260.3 million. The balance sheet lists PSCo's assets of $8.8 billion including property, plant and equipment of $7.1 billion and liabilities of $8.8 billion including long-term debt of $1.9 billion. The notes provide details on PSCo's significant accounting policies and recently issued accounting pronouncements.
This document is a quarterly report filed by Waste Management, Inc. with the SEC for the quarter ending March 31, 2009. It includes the company's condensed consolidated balance sheet and statements of operations for the quarter. The balance sheet shows the company had total assets of $20.4 billion and total liabilities of $14.2 billion. The statement of operations indicates the company reported revenues of $2.8 billion for the quarter, net income of $170 million, and net income attributable to Waste Management, Inc. of $155 million.
This document is an amendment to a quarterly report filed with the SEC that restates financial statements for the second quarter of 2003. It summarizes that the company is restating its condensed consolidated financial statements to correct accounting errors related to the timing of recognition for general and administrative expenses. The restatements were identified after the original quarterly report was filed. The amendment restates specific line items in the financial statements and notes for the periods presented and explains the purpose is to present restated financial information.
This document is Tenet Healthcare Corporation's quarterly report filed with the SEC for the quarter ended February 28, 2003. It includes condensed consolidated financial statements and notes. In the quarter, Tenet recorded $383 million in impairment charges for long-lived assets at 10 general hospitals, 1 psychiatric hospital, and other properties due to changes indicating the carrying amounts may not be recoverable. Tenet also announced a plan to dispose of 14 general hospitals that no longer fit its core operating strategy.
This document is a quarterly report filed by Tenet Healthcare Corporation with the SEC for the quarterly period ended November 30, 2002. It includes condensed consolidated financial statements and notes. Tenet is currently involved in significant legal proceedings including shareholder derivative lawsuits, federal securities class actions, qui tam lawsuits related to Medicare billing, and government investigations into Medicare outlier payments and physician relationships. The financial statements show that for the six months ended November 30, 2002, Tenet had net income of $653 million on revenues of $7.4 billion, compared to net income of $244 million on revenues of $6.7 billion in the prior year period.
This document is a Form 10-Q quarterly report filed by Toll Brothers, Inc. with the SEC for the quarter ended January 31, 2003. It includes:
1) Condensed consolidated balance sheets comparing assets/liabilities as of January 31, 2003 and October 31, 2002, showing increased cash/inventory and decreased debt.
2) Condensed consolidated statements of income for the quarters ended January 31, 2003 and 2002, though no financial figures are provided.
3) Notes to the condensed consolidated financial statements and standard sections including management's discussion of financial results, market risk, controls and procedures, and certifications. The document provides required regulatory financial disclosures for Toll Brothers' first fiscal
This document is Tenet Healthcare Corporation's Form 10-Q filing for the quarterly period ended June 30, 2006. It provides financial information including the condensed consolidated balance sheet, statement of operations, and statement of cash flows for the periods. Some key details include that Tenet operates 70 general hospitals with nearly 18,000 beds across 12 states. For the quarter, the company reported a net loss of $398 million compared to a net loss of $33 million in the same period the prior year. Revenues were $2.2 billion for the quarter.
- Southwestern Public Service Company (SPS) filed a quarterly report on Form 10-Q with the SEC for the quarter ended March 31, 2008.
- SPS operates as a public utility in Texas and New Mexico, providing electricity to residential, commercial, and industrial customers.
- For the quarter, SPS reported a net loss of $1.3 million compared to net income of $1.7 million in the prior year quarter. Total operating revenues increased 14.4% to $418.8 million due to higher electric fuel and purchased power costs.
This document is Tenet Healthcare Corporation's Form 10-Q quarterly report filed with the SEC for the quarter ended March 31, 2006. It provides condensed consolidated financial statements and notes for the company, including the balance sheet, income statement, and cash flow statement. Key details include operating revenues of $2.4 billion for the quarter, income from continuing operations of $15 million, and cash and cash equivalents of $975 million at the end of the period. The report also provides additional disclosures on the company's accounting policies, estimates, and commitments.
- This document is Northern States Power Company's (NSP-Minnesota) quarterly report filed with the SEC for the quarter ended June 30, 2006.
- It provides NSP-Minnesota's consolidated financial statements and notes to the financial statements for the periods ended June 30, 2006 and December 31, 2005.
- The financial statements show NSP-Minnesota's operating revenues, expenses, income, cash flows, assets, liabilities, and equity for the periods. Notes to the financial statements provide additional details on NSP-Minnesota's significant accounting policies and other financial information.
This document provides a summary from Dick Kelly, Chairman and CEO of Xcel Energy, at the Edison Electric Institute Financial Conference in November 2006. It discusses Xcel Energy's strategy of building its core utility business through meeting customer needs, environmental leadership, and regulatory and legislative accomplishments. Key points include delivering competitively priced and reliable energy, leading in renewables and emissions reductions, and significant investment opportunities through 2020 to support growth. Earnings guidance of $1.25-1.35 per share is provided for 2006 and $1.35-1.45 for 2007.
- Public Service Company of Colorado filed a Form 10-Q for the quarterly period ended March 31, 2005 with the SEC.
- The filing includes the company's consolidated statements of income and cash flows for the quarters ended March 31, 2005 and 2004.
- For the quarter ended March 31, 2005, the company reported net income of $65.6 million on total operating revenues of $1.04 billion.
This document provides an overview and summary of Xcel Energy's strategy for sustainable growth between 2006-2020. It discusses Xcel's focus on building its core utility business through meeting customer needs, environmental leadership, and constructive regulation. Key initiatives include investments in renewable energy, emissions reductions, and new technologies. The document also summarizes Xcel's recent rate case outcomes, future investment opportunities, sources of cash, and earnings guidance. It outlines Xcel's objectives of 5-7% annual EPS growth and increasing the dividend by 2-4% annually.
This document is Public Service Company of Colorado's (PSCo) quarterly report filed with the SEC for the period ending March 31, 2006. It includes PSCo's consolidated financial statements and notes. Some key events discussed include a FERC transmission rate case settlement that approved a $1.6 million rate increase, PSCo filing an electric rate case seeking a $210 million annual increase, and Colorado implementing renewable energy portfolio standards requiring PSCo to generate a certain level of electricity from renewable resources.
- Integrys Energy Group reported income from continuing operations of $24.8 million for Q2 2008, compared to a loss of $39.6 million in Q2 2007.
- Key drivers of improved performance included higher margins at natural gas utilities due to rate increases and weather, lower fuel costs for electric utilities, and unrealized gains on energy contracts at Integrys Energy Services.
- For 2008, Integrys expects diluted EPS between $3.33-$3.53, assuming normal weather, plant availability, merger impacts and synergy savings, and recent rate relief.
This document is Southwestern Public Service Company's Form 10-Q quarterly report filed with the SEC for the quarter ended September 30, 2008. It includes:
1) Financial statements showing operating revenues increased from the prior year quarter and year-to-date periods, while net income decreased slightly year-over-year.
2) Management's discussion and analysis of financial results, focusing on factors influencing revenues, expenses, and earnings.
3) Disclosure of controls and procedures to ensure the financial statements are fairly presented.
The report provides required public disclosures of the company's financial position and performance for the period.
This document is NSP-Wisconsin's quarterly report filed with the SEC for the quarter ended September 30, 2008. It includes NSP-Wisconsin's consolidated statements of income and cash flows for the three and nine month periods ended September 30, 2008 and 2007. For the nine months ended September 30, 2008, NSP-Wisconsin reported net income of $30.2 million on operating revenues of $624.4 million. Cash flows from operating activities provided $120.5 million for the nine months ended September 30, 2008. NSP-Wisconsin is a wholly owned subsidiary of Xcel Energy that meets reduced SEC disclosure requirements.
- The document is Northern States Power Company's (NSP-Minnesota) quarterly report filed with the SEC for the quarter ended September 30, 2008.
- It provides financial statements including income statements, cash flow statements, and balance sheets for that quarter and year-to-date as well as notes to the financial statements.
- Key details include operating revenues of $1.1 billion for the quarter and $3.4 billion year-to-date, and net income of $110 million for the quarter and $223 million year-to-date.
This document is Northern States Power Company's (NSP-Minnesota) quarterly report filed with the SEC for the quarter ended September 30, 2008. It summarizes NSP-Minnesota's financial results including operating revenues of $1.1 billion, operating expenses of $884.8 million, net income of $110.3 million. Additionally, it discloses that NSP-Minnesota has 1,000,000 shares of common stock outstanding and meets the conditions to file a reduced disclosure Form 10-Q.
This document is Reliance Steel & Aluminum Co.'s annual report (Form 10-K) filed with the SEC. It provides an overview of the company's business including: the metals service center industry, Reliance's history and operations, customers, suppliers, products/services, competition, regulations, and risk factors. Key details include that Reliance operates over 180 locations in North America and Asia, distributes over 100,000 metal products, and achieved record sales of $5.74 billion and net income of $354.5 million in 2006.
This document is Reliance Steel & Aluminum Co.'s annual report (Form 10-K) filed with the SEC for the fiscal year ending December 31, 2007. It provides an overview of the company's business including: the metals service center industry, Reliance's history and operations, customers and suppliers, products and processing services, competition, and financial results for 2007. Key details include that Reliance is one of the largest metals service center companies in North America, operating over 180 locations across several countries, with net sales of $7.26 billion and net income of $408 million in 2007.
This document is Reliance Steel & Aluminum Co.'s annual report on Form 10-K filed with the SEC. It provides an overview of the company's business including that it is the largest metals service center company in North America, operating over 200 locations. It discusses the company's growth strategy of acquisitions and expansion. While the first three quarters of 2008 were strong, the fourth quarter was significantly impacted by the economic downturn, though the company remained profitable. Key risks include volatility in metal prices and economic conditions that could impact demand and pricing.
This document is a Form 10-Q quarterly report filed by Public Service Company of Colorado (PSCo) with the Securities and Exchange Commission (SEC). It provides financial statements and other information for the quarter ended June 30, 2006. The report indicates that PSCo's net income for the quarter was $52.2 million, an increase from $47.2 million in the same quarter of the previous year. Key sources of revenue for PSCo include electric utility operations at $599.8 million and natural gas utility operations at $160 million for the quarter. The report provides further details on PSCo's operating expenses, cash flows, and other financial details for the period.
This document is a Form 10-Q quarterly report filed by Public Service Company of Colorado (PSCo) with the Securities and Exchange Commission. It provides financial statements and other information for the quarter ended June 30, 2006. The report indicates that PSCo's net income for the quarter was $52.2 million, an increase from $47.2 million in the same quarter of the previous year. Key drivers of this increase included higher electric utility revenues. The report also provides a condensed balance sheet, income statement, and statement of cash flows for the quarter and year-to-date.
This document is Calpine Corporation's annual report on Form 10-K for the fiscal year ended December 31, 2006 filed with the U.S. Securities and Exchange Commission. It provides an overview of Calpine's business operations, financial results, risk factors, legal proceedings, executive compensation and other disclosures required by the SEC. Specifically, it discusses Calpine's power generation assets, operations in competitive wholesale power markets, bankruptcy proceedings, and consolidated financial statements.
This document is a Form 10-Q quarterly report filed by Quiksilver, Inc. with the SEC for the quarter ended July 31, 2011. It includes condensed consolidated financial statements such as statements of operations and balance sheets, as well as notes to the financial statements. In the statements of operations, Quiksilver reports revenues of $503 million for the quarter, with net income of $10.4 million. Assets on the balance sheet total $1.7 billion, with current liabilities of $387 million and long-term debt of $733 million. The report provides key financial data on Quiksilver's performance and financial position for the quarter ended July 31, 2011 in a condensed format.
The document is Clear Channel Communications' annual report on Form 10-K for the fiscal year ended December 31, 2005. It provides an overview of Clear Channel's business operations, financial performance, risks, properties, legal proceedings, and other required disclosures. Specifically, it notes that Clear Channel owns radio stations and outdoor advertising displays across the United States and internationally. It also previously operated a live entertainment business that was spun off in 2005. The report includes segment financial data and discusses Clear Channel's strategy of serving local communities through diverse media assets.
The document is CIT Group Inc.'s Form 10-Q quarterly report filed with the SEC for the quarter ended September 30, 2003. It includes CIT's consolidated balance sheets, statements of income, statements of cash flows, and notes to the financial statements. The financial statements show that CIT's net income for the quarter was $147.8 million, with total assets of $45.5 billion and total stockholders' equity of $5.2 billion as of September 30, 2003.
This document is Tenet Healthcare Corporation's annual report on Form 10-K for the fiscal year ended December 31, 2008. It provides information on Tenet's business operations, including that it operates 53 general hospitals and other healthcare facilities across 12 states. It lists the hospitals by region and state, and describes the services offered and accreditation of the facilities. The report also discusses Tenet's strategies to improve quality of care and operating efficiencies while maintaining compliance with regulations.
This document is Tenet Healthcare Corporation's annual report on Form 10-K for the fiscal year ended December 31, 2008. It provides information on Tenet's business operations, including that it operates 53 general hospitals and other healthcare facilities across 12 states. It lists the hospitals by region and state, and describes the services offered and accreditations. The report also discusses Tenet's strategies, recent facility acquisitions, divestitures and openings, and factors that affect its operating results.
This document is Berkshire Hathaway's quarterly report filed with the SEC for the quarter ending September 30, 2005. It includes Berkshire's consolidated balance sheet, earnings statement, and cash flow statement for the periods presented. Berkshire's revenues increased from the prior year due to growth across its insurance and non-insurance businesses. Net earnings for the quarter and year-to-date were lower than the prior year partly due to higher catastrophe losses in the insurance operations. Berkshire continued acquiring additional businesses during the periods.
This document is a quarterly report filed with the SEC by Public Service Company of Colorado (PSCo). It provides financial statements and notes for the quarter ended March 31, 2008. The financial statements show that PSCo had operating revenues of $1.2 billion for the quarter and net income of $94.3 million. Cash provided by operating activities was $260.3 million. The balance sheet lists PSCo's assets of $8.8 billion including property, plant and equipment of $7.1 billion and liabilities of $8.8 billion including long-term debt of $1.9 billion. The notes provide details on PSCo's significant accounting policies and recently issued accounting pronouncements.
This document is Toll Brothers' Form 10-Q quarterly report filed with the SEC for the quarter ended July 31, 2005. The summary includes:
1) Toll Brothers reported revenues of $3.8 billion for the nine months ended July 31, 2005, with net income of $495.8 million.
2) As of July 31, 2005, Toll Brothers had $5.9 billion in total assets, $3.4 billion in total liabilities, and $2.5 billion in total stockholders' equity.
3) For the three months ended July 31, 2005, Toll Brothers reported revenues of $1.6 billion and net income of $215.5 million.
This document provides an overview and financial projections for Xcel Energy. It discusses Xcel Energy's integrated utility operations, forecasts steady customer and earnings growth, and outlines plans to reduce emissions and refurbish coal plants. It also summarizes Xcel Energy's liquidity and debt refinancing plans, provides 2003 earnings guidance, and outlines priorities including resolving its involvement with bankrupt company NRG.
This document provides an overview and financial projections for Xcel Energy. It discusses Xcel Energy's integrated utility operations, forecasts steady customer and earnings growth, and outlines plans to reduce emissions and refurbish coal plants. It also summarizes Xcel Energy's liquidity and debt refinancing plans, provides 2003 earnings guidance, and outlines priorities including resolving its NRG investment and maintaining its dividend.
This document provides an overview and financial projections for Xcel Energy. It discusses Xcel Energy's integrated utility operations, forecasts steady customer and earnings growth, and outlines plans to reduce emissions and refurbish coal plants. It also summarizes Xcel Energy's liquidity and debt refinancing plans, provides 2003 earnings guidance, and outlines priorities including resolving its involvement with bankrupt company NRG.
This document summarizes Xcel Energy's presentation at the 2003 Banc of America Securities Investment Conference. It outlines Xcel Energy's operations as an integrated utility across multiple US states, financial metrics including earnings growth and dividend yield, efforts to divest from the unprofitable NRG Energy business, and capital expenditure plans including converting coal plants to natural gas to reduce emissions. It also provides guidance for 2003 earnings per share and outlines financing plans to redeem higher interest debt.
This document summarizes Xcel Energy's presentation at the 2003 Banc of America Securities Investment Conference. It outlines Xcel Energy's operations as an integrated utility across multiple US states, its financial performance and guidance, initiatives to reduce emissions in Minnesota, and capital expenditure and financing plans. It highlights Xcel Energy's regulated business model, commitment to dividends, efforts to resolve issues related to its former subsidiary NRG, and expectations for continued earnings growth.
This document summarizes an investor presentation by Xcel Energy on its business operations and financial outlook. It discusses Xcel Energy's integrated utility operations, positive cash flow generation, plans to divest its stake in NRG Energy through bankruptcy proceedings, financial guidance for 2003 including earnings per share, and capital expenditure plans. The presentation also provides comparisons of Xcel Energy's operating metrics to industry peers.
This document provides an overview of Xcel Energy's financial performance and objectives presented at the Edison Electric Institute Financial Conference in October 2003. Key points include: Xcel achieved several accomplishments in 2003 including settling with NRG creditors and maintaining investment grade ratings. Objectives are to invest in utility assets, provide competitive returns, and improve credit ratings. Earnings guidance for 2003 is $1.48-$1.53 per share and $1.15-$1.25 for 2004, driven by utility operations and tax benefits from NRG. The presentation outlines capital expenditures, financing plans, and regulatory strategies.
This document provides an overview of Xcel Energy from their presentation at the Edison Electric Institute Financial Conference in October 2003. Key points include Xcel achieving several accomplishments in 2003 including settling with NRG creditors, maintaining investment grade ratings, and refinancing debt. Projections for 2004 include earnings of $1.15-1.25 per share assuming NRG emerges from bankruptcy. The presentation outlines Xcel's objectives, investments, regulatory strategy, and earnings drivers to emphasize the company as a low-risk, integrated utility with a total return of 7-8%.
This document provides an overview of Xcel Energy from their presentation at the Banc of America Securities Energy & Power Conference in November 2003. Key points include that Xcel achieved several accomplishments in 2003 including settling with NRG creditors and maintaining investment grade ratings. Objectives for 2004 include investing additional capital in utilities, providing competitive returns to shareholders, and improving credit ratings. Earnings guidance for 2003 is $1.48-$1.53 per share and $1.15-$1.25 per share for 2004.
This document summarizes Xcel Energy's presentation at the Banc of America Securities Energy & Power Conference on November 17-19, 2003. It discusses Xcel Energy's accomplishments in 2003, objectives for investment, earnings growth, and credit ratings improvement. It also provides guidance on projected 2003 and 2004 earnings, cash flows, utility investments, and the expected timeline for NRG's emergence from bankruptcy.
This document provides an overview of Xcel Energy Inc. for investors attending the EEI International Financial Conference. It summarizes Xcel's financial performance, business segments, generation assets, environmental commitments, regulatory strategy, and earnings guidance. The presentation outlines Xcel's strengths as a utility, investment merits, and objectives to invest additional capital in its utility business and improve credit ratings while providing competitive returns.
This document provides an overview of Xcel Energy Inc. for investors attending the EEI International Financial Conference. It summarizes Xcel's financial performance, business segments, generation assets, environmental commitments, regulatory strategy, and earnings guidance. The presentation outlines Xcel's strengths as a growing utility, its investment merits, and capital expenditure plans to improve its credit ratings and provide competitive returns.
This document provides an overview of Xcel Energy Inc. for investors attending the EEI International Financial Conference. It summarizes Xcel's business segments, strengths, investment merits, capital investment plans, power supply, environmental commitments, and financial performance. Projections for 2004 earnings per share and cash flow are also presented. Key points include Xcel being the 4th largest US electric and gas utility, a growing service area, low rates, and a goal of providing competitive total returns of 7-9% to shareholders.
Xcel Energy reported improved second quarter 2004 earnings compared to the second quarter of 2003. Net income for the quarter was $86 million, or $0.21 per share, compared to a net loss of $283 million, or $0.71 per share in 2003. Regulated utility earnings from continuing operations improved to $89 million in 2004 from $77 million in 2003. Results from discontinued operations were earnings of $5 million in 2004 compared to losses of $337 million in 2003. The company maintained its annual earnings guidance of $1.15 to $1.25 per share.
This document summarizes a presentation given by Dick Kelly, president and COO of Xcel Energy, at a Lehman Brothers energy conference on September 8, 2004. Kelly outlines Xcel Energy's strategy of investing $900-950 million annually in its utility assets to meet growth, while also pursuing specific generation projects, including a $1 billion coal plant expansion in Colorado. Kelly projects total shareholder return of 7-9% annually through earnings growth of 2-4% and a dividend yield of around 5%.
Wayne Brunetti is the Chairman and CEO of Xcel Energy, a major electric and gas utility. The document discusses Xcel Energy's business strategy, which involves continued investment in its utility assets to meet growth. Key capital projects include a $1 billion emissions reduction program in Minnesota and a proposed $1.3 billion coal plant in Colorado. The summary also provides Xcel Energy's earnings guidance for 2004 and discusses its dividend policy. Brunetti emphasizes that Xcel Energy needs clarity on public policy regarding energy and the environment to effectively plan and invest.
Wayne Brunetti is the Chairman and CEO of Xcel Energy, a major electric and gas utility. The document discusses Xcel Energy's business strategy, which involves continued investment in its utility assets to meet growth. Key capital projects include a $1 billion emissions reduction program in Minnesota and a proposed $1.3 billion coal plant in Colorado. The summary also outlines Xcel Energy's financial metrics, earnings guidance, and dividend policy. Brunetti emphasizes that Xcel Energy needs clarity on public policy regarding energy and the environment to effectively plan and invest.
Wayne Brunetti is the Chairman and CEO of Xcel Energy, a major electric and gas utility. The document discusses Xcel Energy's business strategy, which involves continued investment in its utility assets to meet growth. Key capital projects include a $1 billion emissions reduction program in Minnesota and a proposed $1.3 billion coal plant in Colorado. The summary also provides Xcel Energy's earnings guidance for 2004 and discusses its dividend policy. Brunetti emphasizes that Xcel Energy needs clarity on public policy regarding energy and the environment to effectively plan and invest.
A toxic combination of 15 years of low growth, and four decades of high inequality, has left Britain poorer and falling behind its peers. Productivity growth is weak and public investment is low, while wages today are no higher than they were before the financial crisis. Britain needs a new economic strategy to lift itself out of stagnation.
Scotland is in many ways a microcosm of this challenge. It has become a hub for creative industries, is home to several world-class universities and a thriving community of businesses – strengths that need to be harness and leveraged. But it also has high levels of deprivation, with homelessness reaching a record high and nearly half a million people living in very deep poverty last year. Scotland won’t be truly thriving unless it finds ways to ensure that all its inhabitants benefit from growth and investment. This is the central challenge facing policy makers both in Holyrood and Westminster.
What should a new national economic strategy for Scotland include? What would the pursuit of stronger economic growth mean for local, national and UK-wide policy makers? How will economic change affect the jobs we do, the places we live and the businesses we work for? And what are the prospects for cities like Glasgow, and nations like Scotland, in rising to these challenges?
Discover the Future of Dogecoin with Our Comprehensive Guidance36 Crypto
Learn in-depth about Dogecoin's trajectory and stay informed with 36crypto's essential and up-to-date information about the crypto space.
Our presentation delves into Dogecoin's potential future, exploring whether it's destined to skyrocket to the moon or face a downward spiral. In addition, it highlights invaluable insights. Don't miss out on this opportunity to enhance your crypto understanding!
https://36crypto.com/the-future-of-dogecoin-how-high-can-this-cryptocurrency-reach/
Economic Risk Factor Update: June 2024 [SlideShare]Commonwealth
May’s reports showed signs of continued economic growth, said Sam Millette, director, fixed income, in his latest Economic Risk Factor Update.
For more market updates, subscribe to The Independent Market Observer at https://blog.commonwealth.com/independent-market-observer.
Vicinity Jobs’ data includes more than three million 2023 OJPs and thousands of skills. Most skills appear in less than 0.02% of job postings, so most postings rely on a small subset of commonly used terms, like teamwork.
Laura Adkins-Hackett, Economist, LMIC, and Sukriti Trehan, Data Scientist, LMIC, presented their research exploring trends in the skills listed in OJPs to develop a deeper understanding of in-demand skills. This research project uses pointwise mutual information and other methods to extract more information about common skills from the relationships between skills, occupations and regions.
Enhancing Asset Quality: Strategies for Financial Institutionsshruti1menon2
Ensuring robust asset quality is not just a mere aspect but a critical cornerstone for the stability and success of financial institutions worldwide. It serves as the bedrock upon which profitability is built and investor confidence is sustained. Therefore, in this presentation, we delve into a comprehensive exploration of strategies that can aid financial institutions in achieving and maintaining superior asset quality.
Solution Manual For Financial Accounting, 8th Canadian Edition 2024, by Libby...Donc Test
Solution Manual For Financial Accounting, 8th Canadian Edition 2024, by Libby, Hodge, Verified Chapters 1 - 13, Complete Newest Version Solution Manual For Financial Accounting, 8th Canadian Edition by Libby, Hodge, Verified Chapters 1 - 13, Complete Newest Version Solution Manual For Financial Accounting 8th Canadian Edition Pdf Chapters Download Stuvia Solution Manual For Financial Accounting 8th Canadian Edition Ebook Download Stuvia Solution Manual For Financial Accounting 8th Canadian Edition Pdf Solution Manual For Financial Accounting 8th Canadian Edition Pdf Download Stuvia Financial Accounting 8th Canadian Edition Pdf Chapters Download Stuvia Financial Accounting 8th Canadian Edition Ebook Download Stuvia Financial Accounting 8th Canadian Edition Pdf Financial Accounting 8th Canadian Edition Pdf Download Stuvia
Tdasx: In-Depth Analysis of Cryptocurrency Giveaway Scams and Security Strate...
xcel energy PSCo_10Q_Q32008
1. UNITED STATES
SECURITIES AND EXCHANGE COMMISSION
Washington, D.C. 20549
FORM 10-Q
⌧ QUARTERLY REPORT PURSUANT TO SECTION 13 OR 15(d) OF THE SECURITIES
EXCHANGE ACT OF 1934
For the quarterly period ended Sept. 30, 2008
or
TRANSITION REPORT PURSUANT TO SECTION 13 OR 15(d) OF THE SECURITIES
EXCHANGE ACT OF 1934
For the transition period from to
Commission File Number: 001-3280
Public Service Company of Colorado
(Exact name of registrant as specified in its charter)
Colorado 84-0296600
(State or other jurisdiction of (I.R.S. Employer Identification No.)
incorporation or organization)
1225 17th Street, Denver
Colorado 80202
(Address of principal executive (Zip Code)
offices)
Registrant’s telephone number, including area code (303) 571-7511
Indicate by check mark whether the registrant (1) has filed all reports required to be filed by Section 13 or 15(d) of the Securities Exchange
Act of 1934 during the preceding 12 months (or for such shorter period that the registrant was required to file such reports), and (2) has
been subject to such filing requirements for the past 90 days. Yes ⌧ No
Indicate by check mark whether the registrant is a large accelerated filer, an accelerated filer, a non-accelerated filer or a smaller reporting
company. See the definitions of “large accelerated filer,” “accelerated filer” and “smaller reporting company” in Rule 12b-2 of the
Exchange Act. (Check one):
Large accelerated filer Accelerated filer
Non-accelerated filer ⌧ Smaller reporting company
(Do not check if a smaller reporting company)
No ⌧
Indicate by check mark whether the registrant is a shell company (as defined in Rule 12b-2 of the Exchange Act). Yes
Indicate the number of shares outstanding of each of the issuer’s classes of common stock, as of the latest practicable date.
Class Outstanding at Oct. 27, 2008
Common Stock, $0.01 par value 100 shares
Public Service Company of Colorado meets the conditions set forth in General Instruction H (1)(a) and (b) of Form 10-Q and is therefore
filing this Form 10-Q with the reduced disclosure format specified in General Instruction H (2) to such Form 10-Q.
2. TABLE OF CONTENTS
3
PART I - FINANCIAL INFORMATION
Item l. Financial Statements (Unaudited) ..................................................................................................................... 3
Item 2. Management’s Discussion and Analysis of Financial Condition and Results of Operations............................ 19
Item 4 Controls and Procedures ................................................................................................................................... 24
25
PART II - OTHER INFORMATION ..........................................................................................................................
Item 1. Legal Proceedings............................................................................................................................................. 25
Item 1A. Risk Factors ...................................................................................................................................................... 25
Item 6. Exhibits ............................................................................................................................................................. 26
27
SIGNATURES
Certifications Pursuant to Section 302
Certifications Pursuant to Section 906
Statement Pursuant to Private Litigation
This Form 10-Q is filed by Public Service Company of Colorado, a Colorado corporation (PSCo). PSCo is a wholly owned
subsidiary of Xcel Energy Inc. (Xcel Energy). Additional information on Xcel Energy is available on various filings with the
Securities and Exchange Commission (SEC).
2
3. PART 1. FINANCIAL INFORMATION
Item 1. FINANCIAL STATEMENTS
PUBLIC SERVICE CO. OF COLORADO AND SUBSIDIARIES
CONSOLIDATED STATEMENTS OF INCOME (UNAUDITED)
(Thousands of Dollars)
Three Months Ended Sept. 30, Nine Months Ended Sept. 30,
2008 2007 2008 2007
Operating revenues
Electric utility ....................................................................... $ 924,900 $ 669,598 $ 2,317,753 $ 1,944,240
Natural gas utility ................................................................. 154,130 104,930 966,384 811,481
Steam and other .................................................................... 6,697 6,733 25,375 24,829
Total operating revenues................................................... 1,085,727 781,261 3,309,512 2,780,550
Operating expenses
Electric fuel and purchased power........................................ 601,985 340,270 1,430,479 1,058,400
Cost of natural gas sold and transported ............................... 82,721 35,576 693,781 562,086
Cost of sales — steam and other........................................... 2,999 2,670 10,058 9,681
Other operating and maintenance expenses .......................... 152,936 144,209 456,450 432,552
Demand-side management program expenses ...................... 6,531 4,345 26,459 13,664
Depreciation and amortization.............................................. 62,888 62,032 189,440 184,645
Taxes (other than income taxes) ........................................... 21,159 19,738 65,394 65,226
Total operating expenses................................................... 931,219 608,840 2,872,061 2,326,254
154,508 172,421 437,451 454,296
Operating income....................................................................
Interest and other income (expense), net .............................. 3,186 244 10,497 (5,238)
Allowance for funds used during construction — equity ..... 9,699 3,965 25,326 8,707
Interest charges and financing costs
Interest charges — includes other financing costs of
$1,494, $1,411, $4,342 and $4,161, respectively.............. 40,353 34,337 113,222 101,012
Interest and penalties related to COLI settlement ................. — 2,190 — 43,401
Allowance for funds used during construction — debt......... (4,644) (3,496) (13,154 ) (8,664)
Total interest charges and financing costs ........................ 35,709 33,031 100,068 135,749
Income before income taxes ..................................................... 131,684 143,599 373,206 322,016
Income taxes ............................................................................. 45,403 37,941 126,282 116,471
$ 86,281 $ 105,658 $ 246,924 $ 205,545
Net income ...............................................................................
See Notes to Consolidated Financial Statements
3
4. PUBLIC SERVICE CO. OF COLORADO AND SUBSIDIARIES
CONSOLIDATED STATEMENTS OF CASH FLOWS (UNAUDITED)
(Thousands of Dollars)
Nine Months Ended Sept. 30,
2008 2007
Operating activities
Net income...................................................................................................................... $ 246,924 $ 205,545
Adjustments to reconcile net income to net cash provided by operating activities:
Depreciation and amortization .................................................................................... 222,244 206,107
Deferred income taxes ................................................................................................ 60,286 63,083
Amortization of investment tax credits....................................................................... (2,353) (2,943)
Allowance for equity funds used during construction ................................................ (25,326) (8,707)
Net realized and unrealized hedging and derivative transactions ............................... (13,170) (13,643)
Changes in operating assets and liabilities:
Accounts receivable................................................................................................ 60,832 80,347
Accrued unbilled revenues...................................................................................... 135,928 (8,231)
Inventories .............................................................................................................. (63,049) 17,239
Recoverable purchased natural gas and electric energy costs................................. (9,811) 136,080
Prepayments and other............................................................................................ 21,985 342
Accounts payable.................................................................................................... (166,041) (94,986)
Net regulatory assets and liabilities ........................................................................ (14,946) 572
Other current liabilities ........................................................................................... 74,536 44,109
Change in other noncurrent assets .............................................................................. 6,744 7,416
Change in other noncurrent liabilities ......................................................................... (33,531) (48,113)
Net cash provided by operating activities ........................................................... 501,252 584,217
Investing activities
Utility capital/construction expenditures ........................................................................ (557,624) (491,770)
Allowance for equity funds used during construction .................................................... 25,326 8,707
Investments in utility money pool arrangement.............................................................. (427,900) (494,700)
Repayments from utility money pool arrangement......................................................... 432,500 494,700
Other investments ........................................................................................................... 647 (8,390)
Net cash used in investing activities ................................................................... (527,051) (491,453)
Financing activities
Repayment of short-term borrowings, net ...................................................................... (271,007) (372,500)
Proceeds from issuance of long-term debt...................................................................... 592,884 343,756
Borrowings under utility money pool arrangement ........................................................ 591,100 475,500
Repayments under utility money pool arrangement ....................................................... (591,100) (475,500)
Repayment of long-term debt, including reacquisition premiums .................................. (1,077) (101,031)
Capital contribution from parent..................................................................................... 113,173 330,176
Dividends paid to parent ................................................................................................. (203,708) (196,066)
Net cash provided by financing activities ........................................................... 230,265 4,335
Net increase in cash and cash equivalents ...................................................................... 204,466 97,099
Cash and cash equivalents at beginning of period .......................................................... 7,650 3,011
Cash and cash equivalents at end of period .................................................................... $ 212,116 $ 100,110
Supplemental disclosure of cash flow information:
Cash paid for interest (net of amounts capitalized)......................................................... $ 87,820 $ 34,374
Cash paid for income taxes (net of refunds received)..................................................... 33,634 41,939
Supplemental disclosure of non-cash investing transactions:
Property, plant and equipment additions in accounts payable ........................................ $ 12,632 $ 29,265
See Notes to Consolidated Financial Statements
4
5. PUBLIC SERVICE CO. OF COLORADO AND SUBSIDIARIES
CONSOLIDATED BALANCE SHEETS (UNAUDITED)
(Thousands of Dollars)
Sept. 30, 2008 Dec. 31, 2007
ASSETS
Current assets:
Cash and cash equivalents............................................................................................................. $ 212,116 $ 7,650
Investments in utility money pool arrangement ............................................................................ 96,000 100,600
Accounts receivable, net................................................................................................................ 320,772 375,265
Accounts receivable from affiliates............................................................................................... 28,245 34,584
Accrued unbilled revenues ............................................................................................................ 224,263 360,191
Inventories..................................................................................................................................... 272,969 209,920
Recoverable purchased natural gas and electric energy costs........................................................ 23,668 13,857
Deferred income taxes................................................................................................................... 67,388 59,564
Derivative instruments valuation................................................................................................... 25,283 33,635
Prepayments and other .................................................................................................................. 17,653 17,851
Total current assets ................................................................................................................... 1,288,357 1,213,117
Property, plant and equipment, net .................................................................................................... 7,390,849 7,029,155
Other assets:
Regulatory assets........................................................................................................................... 564,094 539,989
Derivative instruments valuation................................................................................................... 124,072 141,410
Other ............................................................................................................................................. 52,297 55,759
Total other assets ...................................................................................................................... 740,463 737,158
Total assets ........................................................................................................................... $ 9,419,669 $ 8,979,430
LIABILITIES AND EQUITY
Current liabilities:
Current portion of long-term debt ................................................................................................. $ 501,497 $ 301,445
Short-term debt.............................................................................................................................. — 271,007
Accounts payable .......................................................................................................................... 310,671 466,710
Accounts payable to affiliates ....................................................................................................... 18,972 27,445
Taxes accrued................................................................................................................................ 85,281 76,569
Dividends payable to parent .......................................................................................................... 67,258 68,453
Derivative instruments valuation................................................................................................... 36,829 21,521
Accrued interest ............................................................................................................................ 54,592 45,486
Other ............................................................................................................................................. 165,833 108,979
Total current liabilities.............................................................................................................. 1,240,933 1,387,615
Deferred credits and other liabilities:
Deferred income taxes................................................................................................................... 1,178,704 1,090,740
Deferred investment tax credits..................................................................................................... 52,813 55,166
Regulatory liabilities ..................................................................................................................... 519,109 516,401
Pension and employee benefit obligations .................................................................................... 182,179 231,232
Customer advances........................................................................................................................ 290,376 280,270
Derivative instruments valuation................................................................................................... 59,921 84,190
Asset retirement obligations .......................................................................................................... 45,459 44,267
Other ............................................................................................................................................. 20,195 12,063
Total deferred credits and other liabilities................................................................................. 2,348,756 2,314,329
Commitments and contingent liabilities
Capitalization:
Long-term debt.............................................................................................................................. 2,289,441 1,891,644
Common stock — authorized 100 shares of $0.01 par value; outstanding 100 shares .................. — —
Additional paid in capital .............................................................................................................. 2,872,301 2,759,128
Retained earnings .......................................................................................................................... 658,061 614,267
Accumulated other comprehensive income................................................................................... 10,177 12,447
Total common stockholder’s equity.......................................................................................... 3,540,539 3,385,842
Total liabilities and equity .................................................................................................... $ 9,419,669 $ 8,979,430
See Notes to Consolidated Financial Statements
5
6. PUBLIC SERVICE CO. OF COLORADO AND SUBSIDIARIES
NOTES TO CONSOLIDATED FINANCIAL STATEMENTS (UNAUDITED)
In the opinion of management, the accompanying unaudited consolidated financial statements contain all adjustments
necessary to present fairly the financial position of PSCo and its subsidiaries as of Sept. 30, 2008, and Dec. 31, 2007; the
results of its operations for the three and nine months ended Sept. 30, 2008 and 2007; and its cash flows for the nine months
ended Sept. 30, 2008 and 2007. All adjustments are of a normal, recurring nature, except as otherwise disclosed. The
Dec. 31, 2007 balance sheet information has been derived from the audited 2007 financial statements. For further
information, refer to the Consolidated Financial Statements and notes thereto, included in the PSCo Annual Report on
Form 10-K for the year ended Dec. 31, 2007, filed with the Securities and Exchange Commission on Feb. 25, 2008. Due to
the seasonality of PSCo’s electric and natural gas sales, such interim results are not necessarily an appropriate base from
which to project annual results.
1. Significant Accounting Policies
Except to the extent updated or described below, the significant accounting policies set forth in Note 1 to the consolidated
financial statements in PSCo’s Annual Report on Form 10-K for the year ended Dec. 31, 2007, appropriately represent, in all
material respects, the current status of accounting policies and are incorporated herein by reference.
Fair Value Measurements — PSCo presents cash equivalents and commodity derivatives at estimated fair values in its
consolidated financial statements. Cash equivalents are recorded at cost plus accrued interest to approximate fair value.
Changes in the observed trading prices and liquidity of cash equivalents, including commercial paper and money market
funds, are also monitored as additional support for determining fair value, and losses are recorded in earnings if fair value
falls below recorded cost. For commodity derivatives, the most observable inputs available are used to determine the fair
value of each contract. In the absence of a quoted price for an identical contract in an active market, PSCo may use quoted
prices for similar contracts, or internally prepared valuation models as primary inputs to determine fair value.
2. Recently Issued Accounting Pronouncements
Statement of Financial Accounting Standards (SFAS) No. 157 Fair Value Measurements (SFAS No. 157) — In
September 2006, the Financial Accounting Standards Board (FASB) issued SFAS No. 157, which provides a single
definition of fair value, together with a framework for measuring it, and requires additional disclosure about the use of fair
value to measure assets and liabilities. SFAS No. 157 also emphasizes that fair value is a market-based measurement, and
sets out a fair value hierarchy with the highest priority being quoted prices in active markets. Fair value measurements are
disclosed by level within that hierarchy. SFAS No. 157 was effective for financial statements issued for fiscal years
beginning after Nov. 15, 2007.
As of Jan. 1, 2008, PSCo adopted SFAS No. 157 for all assets and liabilities measured at fair value except for non-financial
assets and non-financial liabilities measured at fair value on a non-recurring basis, as permitted by FASB Staff Position
No. 157-2. The adoption did not have a material impact on its consolidated financial statements. For additional discussion
and SFAS No. 157 required disclosures, see Note 10 to the consolidated financial statements.
The Fair Value Option for Financial Assets and Financial Liabilities — Including an Amendment of FASB Statement
No. 115 (SFAS No. 159) — In February 2007, the FASB issued SFAS No. 159, which provides companies with an option to
measure, at specified election dates, many financial instruments and certain other items at fair value that are not currently
measured at fair value. A company that adopts SFAS No. 159 will report unrealized gains and losses on items, for which the
fair value option has been elected, in earnings at each subsequent reporting date. This statement also establishes presentation
and disclosure requirements designed to facilitate comparisons between entities that choose different measurement attributes
for similar types of assets and liabilities. This statement was effective for fiscal years beginning after Nov. 15, 2007.
Effective Jan. 1, 2008, PSCo adopted SFAS No. 159 and the adoption did not have a material impact on its consolidated
financial statements.
Business Combinations (SFAS No. 141 (revised 2007)) — In December 2007, the FASB issued SFAS No. 141R, which
establishes principles and requirements for how an acquirer in a business combination recognizes and measures in its
financial statements the identifiable assets acquired, the liabilities assumed, and any noncontrolling interest; recognizes and
measures the goodwill acquired in the business combination or a gain from a bargain purchase; and determines what
information to disclose to enable users of the financial statements to evaluate the nature and financial effects of the business
combination. SFAS No. 141R is to be applied prospectively to business combinations for which the acquisition date is on or
after the beginning of an entity’s fiscal year that begins on or after Dec. 15, 2008. PSCo will evaluate the impact of SFAS
No. 141R on its consolidated financial statements for any potential business combinations subsequent to Jan. 1, 2009.
6
7. Noncontrolling Interests in Consolidated Financial Statements, an Amendment of Accounting Research Bulletin (ARB)
No. 51 (SFAS No. 160) — In December 2007, the FASB issued SFAS No. 160, which establishes accounting and reporting
standards that require the ownership interest in subsidiaries held by parties other than the parent be clearly identified and
presented in the consolidated balance sheets within equity, but separate from the parent’s equity; the amount of consolidated
net income attributable to the parent and the noncontrolling interest be clearly identified and presented on the face of the
consolidated statement of earnings; and changes in a parent’s ownership interest while the parent retains its controlling
financial interest in its subsidiary be accounted for consistently. This statement is effective for fiscal years beginning on or
after Dec. 15, 2008. PSCo is currently evaluating the impact of SFAS No. 160 on its consolidated financial statements.
Disclosures about Derivative Instruments and Hedging Activities (SFAS No. 161) — In March 2008, the FASB issued
SFAS No. 161, which is intended to enhance disclosures to help users of the financial statements better understand how
derivative instruments and hedging activities affect an entity’s financial position, financial performance and cash flows.
SFAS No. 161 amends and expands the disclosure requirements of SFAS No. 133, Accounting for Derivative Instruments
and Hedging Activities, to require disclosures of objectives and strategies for using derivatives, gains and losses on derivative
instruments, and credit-risk-related contingent features in derivative agreements. SFAS No. 161 is effective for financial
statements issued for fiscal years and interim periods beginning after Nov. 15, 2008, with early application encouraged.
PSCo is currently evaluating the impact of adoption of SFAS No. 161 on its consolidated financial statements.
The Hierarchy of Generally Accepted Accounting Principles (GAAP) (SFAS No. 162) — In May 2008, the FASB issued
SFAS No. 162, which establishes the GAAP hierarchy, identifying the sources of accounting principles and the framework
for selecting the principles to be used in the preparation of financial statements. SFAS No. 162 is effective Nov. 15, 2008.
PSCo does not believe that implementation of SFAS No. 162 will have any material impact on its consolidated financial
statements.
Accounting for Deferred Compensation and Postretirement Benefit Aspects of Endorsement Split-Dollar Life Insurance
Arrangements (Emerging Issues Task Force (EITF) Issue No. 06-4) — In June 2006, the EITF reached a consensus on
EITF No. 06-4, which provides guidance on the recognition of a liability and related compensation costs for endorsement
split-dollar life insurance policies that provide a benefit to an employee that extends to postretirement periods. Therefore, this
EITF would not apply to a split-dollar life insurance arrangement that provides a specified benefit to an employee that is
limited to the employee’s active service period with an employer. EITF No. 06-4 was effective for fiscal years beginning
after Dec. 15, 2007, with earlier application permitted. Upon adoption of EITF No. 06-4 on Jan. 1, 2008, PSCo recorded a
liability of $0.6 million, net of tax, as a reduction of retained earnings. Thereafter, changes in the liability are reflected in
operating results.
Accounting for Income Tax Benefits of Dividends on Share-Based Payment Awards (EITF No. 06-11) — In June 2007,
the EITF reached a consensus on EITF No. 06-11, which states that an entity should recognize a realized tax benefit
associated with dividends on nonvested equity shares and nonvested equity share units charged to retained earnings as an
increase in additional paid in capital. The amount recognized in additional paid in capital should be included in the pool of
excess tax benefits available to absorb potential future tax deficiencies on share-based payment awards. EITF No. 06-11
should be applied prospectively to income tax benefits of dividends on equity-classified share-based payment awards that are
declared in fiscal years beginning after Dec. 15, 2007. The adoption of EITF No. 06-11 did not have a material impact on
PSCo’s consolidated financial statements.
7
8. 3. Selected Balance Sheet Data
(Thousands of Dollars) Sept. 30, 2008 Dec. 31, 2007
Accounts receivable, net:
Accounts receivable........................................................................................................ $ 345,160 $ 398,566
Less allowance for bad debts .......................................................................................... (24,388) (23,301)
$ 320,772 $ 375,265
Inventories:
Materials and supplies .................................................................................................... $ 41,577 $ 40,409
Fuel ................................................................................................................................. 43,316 40,811
Natural gas ...................................................................................................................... 188,076 128,700
$ 272,969 $ 209,920
Property, plant and equipment, net:
Electric utility plant ........................................................................................................ $ 6,914,271 $ 6,633,695
Natural gas utility plant................................................................................................... 1,930,042 1,887,824
Common utility and other property................................................................................. 740,778 726,049
Construction work in progress ........................................................................................ 1,021,532 864,517
Total property, plant and equipment ........................................................................... 10,606,623 10,112,085
Less accumulated depreciation ....................................................................................... (3,215,774) (3,082,930)
$ 7,390,849 $ 7,029,155
4. Income Taxes
Accounting for Uncertainty in Income Taxes — an interpretation of FASB Statement No. 109 (FIN 48) — PSCo is a
member of the Xcel Energy affiliated group that files consolidated income tax returns. In the first quarter of 2008, the
Internal Revenue Service (IRS) completed an examination of Xcel Energy’s federal income tax returns for 2004 and 2005
(and research credits for 2003). The IRS did not propose any material adjustments for those tax years. Tax year 2004 is the
earliest open year and the statute of limitations applicable to Xcel Energy’s 2004 federal income tax return remains open until
Dec. 31, 2009. In the third quarter of 2008, the IRS commenced an examination of tax years 2006 and 2007.
As of Sept. 30, 2008, PSCo’s earliest open tax year in which an audit can be initiated by state taxing authorities under
applicable statutes of limitations is 2004. There currently are no state income tax audits in progress.
The amount of unrecognized tax benefits was $8.8 million and $13.1 million on Dec. 31, 2007 and Sept. 30, 2008,
respectively. These unrecognized tax benefit amounts were reduced by the tax benefits associated with net operating loss
(NOL) and tax credit carryovers of $3.8 million and $5.4 million as of Dec. 31, 2007 and Sept. 30, 2008, respectively.
The unrecognized tax benefit balance included $2.8 million and $3.9 million of tax positions on Dec. 31, 2007 and Sept. 30,
2008, respectively, which if recognized would affect the annual effective tax rate. In addition, the unrecognized tax benefit
balance included $6.0 million and $9.2 million of tax positions on Dec. 31, 2007 and Sept. 30, 2008, respectively, for which
the ultimate deductibility is highly certain but for which there is uncertainty about the timing of such deductibility. A change
in the period of deductibility would not affect the effective tax rate but would accelerate the payment of cash to the taxing
authority to an earlier period.
The increase in the unrecognized tax benefit balance of $2.8 million from July 1, 2008 to Sept. 30, 2008, was due to the
addition of similar uncertain tax positions related to ongoing activity. PSCo’s amount of unrecognized tax benefits could
significantly change in the next 12 months as the IRS audit progresses, when state audits resume and as statutes of limitations
expire. At this time, as it relates to ongoing and upcoming audits, it is not reasonably possible to estimate an overall range of
possible change. However, as it relates to the expiration of statutes of limitations, it is reasonably possible that the amount of
unrecognized tax benefits could decrease up to $3.0 million.
The liability for interest related to unrecognized tax benefits is partially offset by the interest benefit associated with NOL
and tax credit carryovers. The amount of interest expense related to unrecognized tax benefits reported within interest
charges in the third quarter of 2008 was $0.1 million. The liability for interest related to unrecognized tax benefits was $3.8
million on Dec. 31, 2007 and $4.2 million on Sept. 30, 2008.
8
9. No amounts were accrued for penalties in the third quarter of 2008. The liability for penalties related to unrecognized tax
benefits was $1.0 million on Dec. 31, 2007 and Sept. 30, 2008.
Other Income Tax Matters — Income tax expense increased by $9.8 million for the first nine months of 2008, compared
with the first nine months of 2007. The increase in income tax expense was primarily due to an increase in pretax income in
2008 (excluding corporate-owned life insurance (COLI)), partially offset by $16.1 million of tax expense related to the COLI
settlement in 2007. The effective tax rate was 33.8 percent for the first nine months of 2008, compared with 36.2 percent for
the same period in 2007. The higher effective tax rate for the first nine months of 2007 was primarily due to the COLI
settlement, partially offset by an increase in the forecasted annual effective tax rate for 2008, which was largely a result of
PSR Investments, Inc. (PSRI) terminating the COLI program in 2007. Without these charges and benefits, the effective tax
rate for the first nine months of 2008 and 2007 would have been 34.0 percent and 35.7 percent, respectively.
COLI — On June 19, 2007, a settlement in principle was reached between Xcel Energy and representatives of the United
States Government regarding PSCo’s right to deduct interest expense on policy loans related to its COLI program that
insured lives of certain
PSCo employees. These COLI policies were owned and managed by PSRI, a wholly owned subsidiary of PSCo.
In September 2007, Xcel Energy and the United States finalized a settlement, which terminated the tax litigation pending
between the parties. As a result of the settlement, the lawsuit filed by Xcel Energy in the United States District Court has
been dismissed and the Tax Court proceedings are in the process of being dismissed. Xcel Energy paid the government a
total of $64.4 million in full settlement of the government’s claims for tax, penalty, and interest for tax years 1993-2007.
5. Rate Matters
Except to the extent noted below, the circumstances set forth in Note 12 to the consolidated financial statements included in
PSCo’s Annual Report on Form 10-K for the year ended Dec. 31, 2007 appropriately represent, in all material respects, the
current status of other rate matters, and are incorporated herein by reference. The following include unresolved proceedings
that are material to PSCo’s financial position.
Pending and Recently Concluded Regulatory Proceedings — Colorado Public Utilities Commission (CPUC)
Electric, Purchased Gas and Resource Adjustment Clauses
Transmission Cost Adjustment (TCA) Rider — In September 2007, PSCo filed with the CPUC a request to implement a
TCA. In December 2007, the CPUC approved PSCo’s application to implement the TCA. The CPUC limited the scope of
the costs that could be recovered through the rider during 2008 to only those costs associated with transmission investment
made after the new legislation authorizing the rider became effective on March 26, 2007. The CPUC also required PSCo to
base its revenue requirement calculation on a thirteen-month average net transmission plant balance. As a result of the
CPUC’s decision, PSCo implemented a rider on Jan. 1, 2008, expected to recover approximately $4.5 million in 2008. PSCo
expects to file updates to the TCA on Nov. 3, 2008 for rates to go into effect Jan. 1, 2009.
Enhanced Demand Side Management (DSM) Program — In October 2007, PSCo filed an application with the CPUC for
approval to implement an expanded DSM program and to revise its DSM cost adjustment mechanism to include current cost
recovery and incentives designed to reward PSCo for successfully implementing cost-effective DSM programs and measures.
In July 2008, the CPUC issued an order approving PSCo’s proposal to expand the DSM program and recover 100 percent of
its forecasted expenses associated with the DSM program during the year in which the rider is in effect, beginning in 2009.
An incentive mechanism was also approved to reward PSCo for meeting and exceeding program goals.
Pending and Recently Concluded Regulatory Proceedings — Federal Energy Regulatory Commission (FERC)
Pacific Northwest FERC Refund Proceeding — In July 2001, the FERC ordered a preliminary hearing to determine whether
there may have been unjust and unreasonable charges for spot market bilateral sales in the Pacific Northwest for the period
Dec. 25, 2000 through June 20, 2001. PSCo supplied energy to the Pacific Northwest markets during this period and has been
an active participant in the hearings. In September 2001, the presiding administrative law judge (ALJ) concluded that prices
in the Pacific Northwest during the referenced period were the result of a number of factors, including the shortage of supply,
excess demand, drought and increased natural gas prices. Under these circumstances, the ALJ concluded that the prices in the
Pacific Northwest markets were not unreasonable or unjust and no refunds should be ordered. Subsequent to the ruling, the
FERC has allowed the parties to request additional evidence regarding the use of certain strategies and how they may have
impacted the markets in the Pacific Northwest markets. For the referenced period, parties have claimed that the total amount
9
10. of transactions with PSCo subject to refund are $34 million. In June 2003, the FERC issued an order terminating the
proceeding without ordering further proceedings. Certain purchasers filed appeals of the FERC’s orders in this proceeding
with the U. S. Court of Appeals for the Ninth Circuit.
In an order issued in August 2007, the Ninth Circuit remanded the proceeding back to the FERC. The court of appeals
preliminarily determined that it had jurisdiction to review the FERC’s decision not to order refunds and remanded the case
back to the FERC, directing that the FERC consider evidence that had been presented regarding intentional market
manipulation in the California markets and its potential ties to transactions in the Pacific Northwest. The court of appeals also
indicated that the FERC should consider other rulings addressing overcharges in the California organized markets. The
FERC has yet to act on this order on remand.
PSCo Wholesale Rate Case — In February 2008, PSCo requested a $12.5 million, or 5.88 percent, increase in wholesale
rates, based on 11.5 percent requested return on equity (ROE). The $12.5 million total increase was composed of $8.8
million of traditional base rate recovery and $3.7 million of construction work in progress recovery for the Comanche 3 and
Fort St. Vrain projects. The increase is applicable to all wholesale firm service customers with the exception of
Intermountain Rural Electric Cooperative, which would be under a rate moratorium until January 2009.
In March 2008, PSCo reached an agreement with Rural Electric Association (REA) customers Holy Cross, Yampa Valley
and Grand Valley, which resolved all issues based on a “black box” settlement with an implied ROE of 10.4 percent. Parties
filed the settlement with the FERC on April 17, 2008, with rates effective May 1, 2008. PSCo has reached an agreement with
the cities of Burlington and Center, as well as Aquila under the same substantive terms and conditions as the REA settlement.
This settlement was filed with the FERC on April 25, 2008. The settlements provide for:
• A traditional annual rate base rate increase of $6.6 million with allowance for funds used during construction continuing
for Comanche and Fort St. Vrain.
• Implementation of new rates several months earlier than is typical in a disputed filing.
• The ability to implement rates in PSCo’s next general rate case that will involve Comanche 3 costs upon a nominal
suspension.
The FERC approved the settlement agreements on June 19, 2008.
6. Commitments and Contingent Liabilities
Except as noted below, the circumstances set forth in Notes 12 and 13 to the consolidated financial statements in PSCo’s
Annual Report on Form 10-K for the year ended Dec. 31, 2007 and Note 5 to the consolidated financial statements in this
Quarterly Report on Form 10-Q appropriately represent, in all material respects, the current status of respective commitments
and contingent liabilities and are incorporated herein by reference. The following are contingencies and unresolved
contingencies that are material to PSCo’s financial position.
Operating Leases — PSCo began taking power under two purchased power agreements during the second quarter of 2008
that are being accounted for as operating leases in accordance with EITF No. 01-8, Determining Whether an Arrangement
Contains a Lease, and SFAS No. 13, Accounting for Leases. Future commitments under these purchase power agreements
being accounted for as operating leases are:
Purchase Power
Agreement
Operating Leases
(Millions of Dollars)
2008 ............................................................................................................................. $ 12.1
2009 ............................................................................................................................. 18.2
2010 ............................................................................................................................. 18.2
2011 ............................................................................................................................. 18.2
2012 ............................................................................................................................. 18.2
Thereafter..................................................................................................................... 330.3
Environmental Contingencies
PSCo has been, or is currently, involved with the cleanup of contamination from certain hazardous substances at several sites.
In many situations, PSCo believes it will recover some portion of these costs through insurance claims. Additionally, where
applicable, PSCo is pursuing, or intends to pursue, recovery from other potentially responsible parties (PRP) and through the
10
11. rate regulatory process. New and changing federal and state environmental mandates can also create added financial
liabilities for PSCo, which are normally recovered through the rate regulatory process. To the extent any costs are not
recovered through the options listed above, PSCo would be required to recognize an expense.
Site Remediation — PSCo must pay all or a portion of the cost to remediate sites where past activities of PSCo or other
parties have caused environmental contamination. Environmental contingencies could arise from various situations including
sites of former manufactured gas plants (MGPs) operated by PSCo, its predecessors, or other entities; and third party sites,
such as landfills, to which PSCo is alleged to be a PRP that sent hazardous materials and wastes. At Sept. 30, 2008, the
liability for the cost of remediating these sites was estimated to be $1.4 million, of which $0.6 million was considered to be a
current liability.
Manufactured Gas Plant Site
Fort Collins Manufactured Gas Plant Site — Prior to 1926, the Poudre Valley Gas Co. operated an MGP in Fort Collins,
Colo., not far from the Cache la Poudre River. In 1926, after acquiring the assets of the Poudre Valley Gas Co., PSCo shut
down the MGP and has subsequently sold most of the property. In 2002, an oily substance similar to MGP byproducts was
discovered in the Cache la Poudre River. In November 2004, PSCo entered into an agreement with the Environmental
Protection Agency (EPA), the city of Fort Collins and Schrader Oil Co. (Schrader) under which PSCo performed remediation
and monitoring work. PSCo has substantially
completed work at the site, with the exception of ongoing maintenance and monitoring.
In November 2006, PSCo filed a natural gas rate case with the CPUC requesting recovery of additional clean-up costs at the
Fort Collins MGP site spent through September 2006, plus unrecovered amounts previously authorized from the last rate
case, which amounted to $10.8 million to be amortized over four years. In June 2007, PSCo entered into a settlement
agreement that included recovery of the full $10.8 million, but with a five-year amortization period. The CPUC approved the
agreement on June 18, 2007. The total amount to be recovered from customers is $13.1 million. Estimated future project
costs, based upon an assumed 30-year system operating life, including EPA oversight costs, are approximately $2.8 million.
This reflects a reduction in estimated EPA oversight costs over the life of the project, based upon the most recent EPA
oversight billing.
In April 2005, PSCo brought a contribution action against Schrader and related parties (collectively “Schrader”) alleging
Schrader released hazardous substances into the environment and these releases caused MGP byproducts to migrate to the
Cache la Poudre River, thereby substantially increasing the scope and cost of remediation. PSCo requested damages,
including a portion of the costs PSCo incurred to investigate and remove contaminated sediments from the Cache la Poudre
River. PSCo and Schrader have reached an agreement in principle and are in the process of finalizing a settlement
agreement. Net proceeds from the settlement will be credited to ratepayers.
Third Party and Other Environmental Site Remediation
Asbestos Removal — Some of PSCo’s facilities contain asbestos. Most asbestos will remain undisturbed until the facilities
that contain it are demolished or renovated. PSCo has recorded an estimate for final removal of the asbestos as an asset
retirement obligation. See additional discussion of asset retirement obligations in Note 13 of the PSCo Annual Report on
Form 10-K for the year ended Dec. 31, 2007. It may be necessary to remove some asbestos to perform maintenance or make
improvements to other equipment. The cost of removing asbestos as part of other work is immaterial and is recorded as
incurred as operating expenses for maintenance projects, capital expenditures for construction projects or removal costs for
demolition projects.
Other Environmental Requirements
Regional Haze Rules — In June 2005, the EPA finalized amendments to the July 1999 regional haze rules. These
amendments apply to the provisions of the regional haze rule that require emission controls, known as best available retrofit
technology (BART), for industrial facilities emitting air pollutants that reduce visibility by causing or contributing to regional
haze. Some PSCo generating facilities will be subject to BART requirements.
The EPA required states to develop implementation plans to comply with BART by December 2007. States are required to
identify the facilities that will have to reduce sulfur dioxide (SO2), nitrogen oxide (NOx) and particulate matter emissions
under BART and then set BART emissions limits for those facilities. In May 2006, the Colorado Air Quality Control
Commission (AQCC) promulgated BART regulations requiring certain major stationary sources to evaluate and install,
operate and maintain BART or an approved BART alternative to make reasonable progress toward meeting the national
11
12. visibility goal. PSCo estimates that implementation of the BART alternatives will cost approximately $201 million in capital
costs, which includes approximately $59 million in environmental upgrades for the existing Comanche Station project, which
are included in the capital budget. PSCo expects the cost of any required capital investment will be recoverable from
customers. Emissions controls are expected to be installed between 2011 and 2014. Colorado’s state implementation plan
has been submitted to EPA for approval. In early 2008, the Colorado Air Pollution Control Division (CAPCD) initiated a
stakeholder process to establish reasonable progress goals for Colorado’s Class I areas. To meet these goals, more controls
may be required from certain sources, which may or may not include those sources previously controlled under BART. The
reasonable progress stakeholder process has been placed on hold by the CAPCD due to limited resources and is expected to
resume in early 2009.
Clean Air Mercury Rule (CAMR) — In March 2005, the EPA issued the CAMR, which regulated mercury emissions from
power plants. In February 2008, the D.C. Circuit Court of Appeals vacated CAMR, which impacts federal CAMR
requirements, but not necessarily state-only mercury legislation and rules. Colorado’s mercury rule requires mercury
emission controls capable of achieving 80 percent capture be installed at the Pawnee Generating Station by 2012 and all other
Colorado units by 2014. PSCo is in the process of installing mercury monitors on five Colorado units at an estimated
aggregate cost of approximately $1.9 million. PSCo is evaluating the mercury emission controls required to meet the state
rule and is currently unable to provide a capital cost estimate.
Federal Clean Water Act — The Federal Clean Water Act requires the EPA to regulate cooling water intake structures to
assure that these structures reflect the “best technology available” (BTA) for minimizing adverse environmental impacts. In
July 2004, the EPA published phase II of the rule, which applies to existing cooling water intakes at steam-electric power
plants. Several lawsuits were filed against the EPA in the United States Court of Appeals for the Second Circuit challenging
the phase II rulemaking. In January 2007, the court issued its decision and remanded virtually every aspect of the rule to the
EPA for reconsideration. In June 2007, the EPA suspended the deadlines and referred any implementation to each state’s
best professional judgment until the EPA is able to fully respond to the court-ordered remand. As a result, the rule’s
compliance requirements and associated deadlines are currently unknown. It is not possible to provide an accurate estimate
of the overall cost of this rulemaking at this time due to the many uncertainties involved. In April 2008, the U.S. Supreme
Court granted limited review of the Second Circuit’s opinion to determine whether the EPA has the authority to consider
costs and benefits in assessing BTA. A decision is not expected until 2009.
Notice of Violation — In July 2002, PSCo received a Notice of Violation (NOV) from the EPA alleging violations of the
New Source Review (NSR) requirements of the Clean Air Act (CAA) at the Comanche and Pawnee plants in Colorado. The
NOV specifically alleges that various maintenance, repair and replacement projects undertaken at the plants in the mid- to
late-1990s should have required a permit under the NSR process. PSCo believes it has acted in full compliance with the
CAA and NSR process. PSCo believes that the projects identified in the NOV fit within the routine maintenance, repair and
replacement exemption contained within the NSR regulations or are otherwise not subject to the NSR requirements. PSCo
disagrees with the assertions contained in the NOV and intends to vigorously defend its position.
Cherokee Station Alleged CAA Violations — In January 2008, Xcel Energy, the parent company of PSCo, received a notice
letter from Rocky Mountain Clean Air Action stating that the group intends to sue Xcel Energy for alleged CAA violations at
Cherokee Station. The group claims that Cherokee Station’s opacity emissions have exceeded allowable limits over the past
five years and that its opacity monitors exceeded downtime limits. Xcel Energy disputes these claims and believes they are
without merit. The CAA requires notice be given 60 days prior to filing a lawsuit. If the group does in fact file its threatened
lawsuit, Xcel Energy will vigorously defend itself against these claims.
Legal Contingencies
Lawsuits and claims arise in the normal course of business. Management, after consultation with legal counsel, has recorded
an estimate of the probable cost of settlement or other disposition of them. The ultimate outcome of these matters cannot
presently be determined. Accordingly, the ultimate resolution of these matters could have a material adverse effect on PSCo’s
financial position and results of operations.
Cabin Creek Hydro Generating Station Accident
In October 2007, employees of RPI Coatings Inc. (RPI), a contractor retained by PSCo, were applying an epoxy coating to
the inside of a penstock at PSCo’s Cabin Creek Hydro Generating Station near Georgetown, Colo. This work was being
performed as part of a corrosion prevention effort. A fire occurred inside the penstock, which is a 4,000-foot long, 12-foot
wide pipe used to deliver water from a reservoir to the hydro facility. Four of the nine RPI employees working inside the
penstock were positioned below the fire and were able to exit the pipe. The remaining five RPI employees were unable to exit
12
13. the penstock. Rescue crews located the five employees a few hours later and confirmed their deaths. The accident was
investigated by several state and federal agencies, including the federal Occupational Safety and Health Administration
(OSHA) and the U.S. Chemical Safety Board and the Colorado Bureau of Investigations.
In March 2008, OSHA proposed penalties totaling $189,900 for twenty-two serious violations and three willful violations
arising out of the accident. In April 2008, Xcel Energy notified OSHA of its decision to contest all of the proposed citations.
On May 28, 2008 the Secretary of Labor filed its complaint, and Xcel Energy subsequently filed its answer on June 17, 2008.
The Court ordered this proceeding stayed until March 3, 2009 and indicated an extension of the stay is possible. A lawsuit
has been filed in Denver District Court on behalf of four of the deceased workers and four of the injured workers. PSCo and
Xcel Energy Inc. are named as defendants, along with RPI Coatings, its parent company, Prezioso, and two other contractors
who performed work in connection with the relining project at Cabin Creek. A second lawsuit (Ledbetter et. al vs. Xcel
Energy et. al) has also been filed by and on behalf of three employees allegedly injured in the accident. Neither complaint
filed in court has been served upon Xcel Energy or PSCo. Xcel Energy and PSCo intend to vigorously defend themselves
against the claims asserted in the lawsuits.
Environmental Litigation
Carbon Dioxide Emissions Lawsuit — In July 2004, the attorneys general of eight states and New York City, as well as
several environmental groups, filed lawsuits in U.S. District Court in the Southern District of New York against five utilities,
including Xcel Energy, the parent company of PSCo, to force reductions in carbon dioxide (CO2) emissions. The other
utilities include American Electric Power Co., Southern Co., Cinergy Corp. and Tennessee Valley Authority. The lawsuits
allege that CO2 emitted by each company is a public nuisance as defined under state and federal common law because it has
contributed to global warming. The lawsuits do not demand monetary damages. Instead, the lawsuits ask the court to order
each utility to cap and reduce its CO2 emissions. In October 2004, Xcel Energy and the other defendants filed a motion to
dismiss the lawsuit. On Sept. 19, 2005, the court granted the motion to dismiss on constitutional grounds. Plaintiffs filed an
appeal to the Second Circuit Court of Appeals. In June 2007, the Second Circuit Court of Appeals issued an order requesting
the parties to file a letter brief regarding the impact of the United States Supreme Court’s decision in Massachusetts v. EPA,
127 S.Ct. 1438 (April 2, 2007) on the issues raised by the parties on appeal. Among other things, in its decision in
Massachusetts v. EPA, the United States Supreme Court held that CO2 emissions are a “pollutant” subject to regulation by
the EPA under the CAA. In response to the request of the Second Circuit Court of Appeals, in June 2007, the defendant
utilities filed a letter brief stating the position that the United States Supreme Court’s decision supports the arguments raised
by the utilities on appeal. The Court of Appeals has taken the matter under advisement and is expected to issue an opinion in
due course.
Comer vs. Xcel Energy Inc. et al. — In April 2006, Xcel Energy received notice of a purported class action lawsuit filed in
U.S. District Court in the Southern District of Mississippi. The lawsuit names more than 45 oil, chemical and utility
companies, including Xcel Energy, the parent company of PSCo, as defendants and alleges that defendants’ CO2 emissions
“were a proximate and direct cause of the increase in the destructive capacity of Hurricane Katrina.” Plaintiffs allege in
support of their claim, several legal theories, including negligence and public and private nuisance and seek damages related
to the loss resulting from the hurricane. Xcel Energy believes this lawsuit is without merit and intends to vigorously defend
itself against these claims. In August 2007, the court dismissed the lawsuit in its entirety against all defendants on
constitutional grounds. In September 2007, plaintiffs filed a notice of appeal to the Fifth Circuit Court of Appeals. Oral
arguments were presented to the Court of Appeals on Aug. 6, 2008. On Sept. 26, 2008, the Court of Appeals notified the
parties that this matter was set for re-argument on Nov. 3, 2008. No explanation was given for the decision.
Native Village of Kivalina vs. Xcel Energy Inc. et al. — In February 2008, the City and Native Village of Kivalina, Alaska,
filed a lawsuit in U.S. District Court for the Northern District of California against Xcel Energy, the parent company of
PSCo, and 23 other oil, gas and coal companies. The suit was brought on behalf of approximately 400 native Alaskans, the
Inupiat Eskimo, who claim that Defendants’ emission of CO2 and other greenhouse gases (GHG) contribute to global
warming, which is harming their village. Plaintiffs claim that as a consequence, the entire village must be relocated at a cost
of between $95 million and $400 million. Plaintiffs assert a nuisance claim under federal and state common law, as well as a
claim asserting “concert of action” in which defendants are alleged to have engaged in tortious acts in concert with each
other. Xcel Energy was not named in the civil conspiracy claim. Xcel Energy believes the claims asserted in this lawsuit are
without merit and joined with other utility defendants in filing a motion to dismiss on June 30, 2008.
13
14. Employment, Tort and Commercial Litigation
Qwest vs. Xcel Energy Inc. — In June 2004, an employee of PSCo was seriously injured when a pole owned by Qwest
malfunctioned. In September 2005, the employee commenced an action against Qwest in Denver state court. In April 2006,
Qwest filed a third party complaint against PSCo based on terms in a joint pole use agreement between Qwest and PSCo.
Pursuant to this agreement, Qwest asserted PSCo had an affirmative duty to properly train and instruct its employees on pole
safety, including testing the pole for soundness before climbing. In May 2006, PSCo filed a counterclaim against Qwest
asserting Qwest had a duty to PSCo and an obligation under the contract to maintain its poles in a safe and serviceable
condition. In May 2007, the matter was tried and the jury found Qwest solely liable for the accident and this determination
resulted in an award of damages in the amount of approximately $90 million. On June 16, 2008, Qwest filed its appellate
brief. After the matter is fully briefed by the parties, oral arguments will be scheduled.
Mallon v. Xcel Energy Inc. — In July 2007, Theodore Mallon and TransFinancial Corporation filed a declaratory judgment
action against Xcel Energy in U.S. District Court in Colorado (Mallon Federal Action). In this lawsuit, plaintiffs seek a
determination that Xcel Energy is not entitled to assert claims against plaintiffs related to the 1984 and 1985 sale of COLI to
PSCo, a predecessor of Xcel Energy. In August 2007, Xcel Energy, PSCo and PSRI commenced a lawsuit in Colorado state
court against Mallon and TransFinancial Corporation (Mallon State Action). In the Mallon State Action, Xcel Energy, PSCo
and PSRI seek damages against Mallon and TransFinancial for, among other things, breach of contract and breach of
fiduciary duties associated with the sale of the COLI policies. In August 2007, Xcel Energy also filed a motion to stay or, in
the alternative, to dismiss the Mallon Federal Action. In September 2007, a motion to stay the Mallon State Court action was
subsequently filed by Mallon and TransFinancial. In November 2007, the U.S. District Court in Colorado dismissed the
complaint in the Mallon Federal Action and Mallon and TransFinancial subsequently withdrew their motion to stay the
Mallon State Court Action. In May 2008, Xcel Energy, PSCo and PSRI filed a second amended complaint that, among other
things, adds Provident Life & Accident Insurance Company (Provident) as a defendant and asserts claims for breach of
contract, unjust enrichment and fraudulent concealment against the insurance company. On June 23, 2008, Provident filed a
motion to dismiss the complaint. Xcel Energy, PSCo and PSRI filed a brief in opposition to the motion on July 28, 2008. Oral
arguments were presented to the court on Sept. 19, 2008. On Oct. 22, 2008, Judge Morris Sandstead, Jr. granted Provident’s
motion in part, but denied the motion with respect to a majority of the core causes of action asserted by PSCo, Xcel Energy
Inc. and PSRI Investments.
7. Short-Term Borrowings and Other Financing Activities
Commercial Paper — At Sept. 30, 2008 and Dec. 31, 2007, PSCo had commercial paper outstanding of $0.0 million and
$271.0 million, respectively. The weighted average interest rate at Dec. 31, 2007 was 5.64 percent.
Money Pool — Xcel Energy has established a utility money pool arrangement that allows for short-term loans between the
utility subsidiaries and from the holding company to the utility subsidiaries at market-based interest rates. The utility money
pool arrangement does not allow loans from the utility subsidiaries to the holding company. PSCo has approval to borrow up
to $250 million under the arrangement. At Sept. 30, 2008 and Dec. 31, 2007, PSCo had money pool loans outstanding of
$96.0 million and $100.6 million, respectively. The weighted average interest rates at Sept. 30, 2008 and Dec. 31, 2007,
were 3.00 percent and 5.64 percent, respectively.
8. Long-Term Borrowings and Other Financing Instruments
On Aug. 13, 2008, PSCo issued $300 million of 5.80 percent first mortgage bonds, series due Aug. 1, 2018 and $300 million
of 6.50 percent first mortgage bonds, series due Aug. 1, 2038. PSCo added the net proceeds from the sale of the first
mortgage bonds to its general funds and applied a portion of such net proceeds to fund the payment at maturity of $300
million of 4.375 percent first mortgage bonds due Oct. 1, 2008.
9. Derivative Instruments
PSCo uses derivative instruments in connection with its interest rate hedging, short-term wholesale, and commodity trading
activities, including forward contracts, futures, swaps and options. Qualifying hedging relationships are designated as a
hedge of a forecasted transaction or future cash flow (cash flow hedge). The types of qualifying hedging transactions that
PSCo is currently engaged in are discussed below.
Cash Flow Hedges
Commodity Cash Flow Hedges — PSCo enters into derivative instruments to manage variability of future cash flows from
14
15. changes in commodity prices. This could include the purchase or sale of energy or energy-related products, the use of natural
gas to generate electric energy, or gas purchased for resale and fuel for fleet vehicles. These derivative instruments are
designated as cash flow hedges for accounting purposes. At Sept. 30, 2008, PSCo had various commodity-related contracts
designated as cash flow hedges extending through December 2010. Changes in the fair value of cash flow hedges are
recorded in other comprehensive income or deferred as a regulatory asset or liability. This classification is based on the
regulatory recovery mechanisms in place.
At Sept. 30, 2008, PSCo had $1.4 million of net losses in accumulated other comprehensive income related to commodity
cash flow hedge contracts; $0.7 million is expected to be recognized in earnings during the next 12 months as the hedged
transactions settle.
Interest Rate Cash Flow Hedges — PSCo enters into various instruments that effectively fix the yield or price on a specified
benchmark interest rate for a specific period. These derivative instruments are designated as cash flow hedges for accounting
purposes.
At Sept. 30, 2008, PSCo had $1.5 million of net gains in accumulated other comprehensive income related to interest rate
derivatives that are expected to be recognized in earnings during the next 12 months.
The following table shows the major components of the derivative instruments valuation in the consolidated balance sheets at
Sept. 30 and Dec. 31:
Sept. 30, 2008 Dec. 31, 2007
Derivative Derivative Derivative Derivative
Instruments Instruments Instruments Instruments
Valuation – Valuation - Valuation - Valuation -
(Thousands of Dollars) Assets Liabilities Assets Liabilities
Long term purchased power agreements .................................. $ 141,982 $ 69,748 $ 155,928 $ 96,654
Electricity and natural gas trading and hedging instruments .... 7,373 27,002 19,117 9,057
Total...................................................................................... $ 149,355 $ 96,750 $ 175,045 $ 105,711
In 2003, as a result of FASB Statement 133 Implementation Issue No. C20, PSCo began recording several long-term
purchased power agreements at fair value due to accounting requirements related to underlying price adjustments. As these
purchases are recovered through normal regulatory recovery mechanisms in the respective jurisdictions, the changes in fair
value for these contracts were offset by regulatory assets and liabilities. During 2006, PSCo qualified these contracts under
the normal purchase exception. Based on this qualification, the contracts are no longer adjusted to fair value and the previous
carrying value of these contracts will be amortized over the remaining contract lives along with the offsetting regulatory
assets and liabilities.
The impact of qualifying cash flow hedges on PSCo’s accumulated other comprehensive income, included as a component of
common stockholder’s equity, is detailed in the following table:
Nine months ended Sept. 30,
(Thousands of Dollars) 2008 2007
Accumulated other comprehensive income related to cash flow hedges at Jan. 1.............. $ 12,447 $ 12,614
After-tax net unrealized (losses) gains related to derivatives accounted for as hedges ...... (1,120) 1,150
After-tax net realized gains on derivative transactions reclassified into earnings .............. (1,150) (1,132)
Accumulated other comprehensive income related to cash flow hedges at Sept. 30 .......... $ 10,177 $ 12,632
10. Fair Value Measurements
Effective Jan. 1, 2008, PSCo adopted SFAS No. 157 for recurring fair value measurements. SFAS No. 157 provides a single
definition of fair value and requires enhanced disclosures about assets and liabilities measured at fair value. SFAS No. 157
establishes a hierarchal framework for disclosing the observability of the inputs utilized in measuring assets and liabilities at
fair value. The three levels defined by the SFAS No. 157 hierarchy and examples of each level are as follows:
Level 1 – Quoted prices are available in active markets for identical assets or liabilities as of the reported date. The
types of assets and liabilities included in Level 1 are highly liquid and actively traded instruments with quoted
prices.
Level 2 – Pricing inputs are other than quoted prices in active markets, but are either directly or indirectly
15
16. observable as of the reported date. The types of assets and liabilities included in Level 2 are typically either
comparable to actively traded securities or contracts or priced with models using highly observable inputs.
Level 3 – Significant inputs to pricing have little or no observability as of the reporting date. The types of assets and
liabilities included in Level 3 are those with inputs requiring significant management judgment or estimation.
PSCo held several commodity derivatives measured at fair value on a recurring basis as of Sept. 30, 2008. Fair value for
these commodity derivatives was primarily determined based on observable prices for identical or similar forward contracts,
or internally prepared option valuation models using observable forward curves and volatilities. For certain instruments, it
may be necessary to use inputs requiring significant management judgment or estimation, such as the long-term commodity
price forecasts used to determine the fair value of long-term energy forwards. PSCo continuously monitors the
creditworthiness of the counterparties to its commodity derivative contracts and assesses each counterparty’s ability to
perform on the transactions set forth in the contracts. Given this assessment, as well an assessment of the impact of PSCo’s
own credit risk when determining the fair value of commodity derivative liabilities, the impact of considering credit risk was
immaterial to the fair value of commodity derivative assets and liabilities at Sept. 30, 2008.
The following table presents, for each of the SFAS No. 157 hierarchy levels, PSCo’s assets and liabilities that are measured
at fair value on a recurring basis as of Sept. 30, 2008:
Counterparty
(Thousands of Dollars) Level 1 Level 2 Level 3 Net Balance
Netting (a)
Commodity derivative assets .......................... $ 107 $ 5,189 $ 5,947 $ (3,870 ) $ 7,373
Commodity derivative liabilities..................... 1,437 26,862 3,815 (5,112 ) 27,002
(a) FASB Interpretation No. 39 Offsetting of Amounts Relating to Certain Contracts, as amended by FASB Staff Position
FIN 39-1 Amendment of FASB Interpretation No. 39, permits the netting of receivables and payables for derivatives and
related collateral amounts when a legally enforceable master netting agreement exists between PSCo and a counterparty. A
master netting agreement is an agreement between two parties who have multiple contracts with each other that provides for
the net settlement of all contracts in the event of default on or termination of any one contract.
The following tables present the changes in Level 3 recurring fair value measurements for the three and nine months ended
Sept. 30, 2008:
Commodity
Derivatives,
Net
(Thousands of Dollars)
Balance, July 1, 2008............................................................................................... $ 2,508
Purchases, issuances, and settlements, net........................................................... (2,011 )
Gains recognized in earnings ............................................................................... 1,635
Balance, Sept. 30, 2008 ........................................................................................... $ 2,132
Commodity
Derivatives,
(Thousands of Dollars) Net
Balance, Jan. 1, 2008 ............................................................................................... $ 4,121
Purchases, issuances, and settlements, net........................................................... (3,615 )
Gains recognized in earnings ............................................................................... 1,626
Balance, Sept. 30, 2008 ........................................................................................... $ 2,132
Gains on Level 3 commodity derivatives recognized in earnings for the three and nine months ended Sept. 30, 2008, include
$0.6 million and $1.1 million, respectively, of net unrealized gains relating to commodity derivatives held at Sept. 30, 2008.
Realized and unrealized gains and losses on commodity trading activities are included in electric utility revenues.
16
17. 11. Detail of Interest and Other Income (Expense), Net
Interest and other income (expense), net, for the three and nine months ended Sept. 30 consisted of the following:
Three months ended Sept. 30, Nine months ended Sept. 30,
(Thousands of Dollars) 2008 2007 2008 2007
Interest income.......................................................................... $ 2,470 $ 3,328 $ 6,024 $ 6,439
Other nonoperating income ...................................................... 531 923 2,310 1,918
Insurance policy income (expense)........................................... 185 (4,007) 2,163 (13,595)
Total interest and other income (expense), net ..................... $ 3,186 $ 244 $ 10,497 $ (5,238)
12. Segment Information
PSCo has two reportable segments, regulated electric utility and regulated natural gas utility. Commodity trading operations
are not a reportable segment and commodity trading results are included in the regulated electric utility segment.
Regulated Regulated
All Reconciling Consolidated
Electric Natural
(Thousands of Dollars) Utility Gas Utility Other Eliminations Total
Three months ended Sept. 30, 2008
Revenues from:
External customers.......................................... $ 924,900 $ 154,130 $ 6,697 $ — $ 1,085,727
Internal customers........................................... 52 10 — (62 ) —
Total revenues............................................. $ 924,952 $ 154,140 $ 6,697 $ (62 ) $ 1,085,727
Segment net income........................................ $ 75,308 $ 8,065 $ 2,908 $ —$ 86,281
Three months ended Sept. 30, 2007
Revenues from:
External customers.......................................... $ 669,598 $ 104,930 $ 6,733 $ — $ 781,261
Internal customers........................................... 27 (30) — 3 —
Total revenues............................................. $ 669,625 $ 104,900 $ 6,733 $ 3 $ 781,261
Segment net income........................................ $ 87,991 $ 9,289 $ 8,378 $ — $ 105,658
Regulated Regulated
All Reconciling Consolidated
Electric Natural
(Thousands of Dollars) Utility Gas Utility Other Eliminations Total
Nine months ended Sept. 30, 2008
Revenues from:
External customers.......................................... $ 2,317,753 $ 966,384 $ 25,375 $ — $ 3,309,512
Internal customers........................................... 182 78 — (260 ) —
Total revenues............................................. $ 2,317,935 $ 966,462 $ 25,375 $ (260 ) $ 3,309,512
Segment net income........................................ $ 177,377 $ 59,043 $ 10,504 $ — $ 246,924
Nine months ended Sept. 30, 2007
Revenues from:
External customers.......................................... $ 1,944,240 $ 811,481 $ 24,829 $ — $ 2,780,550
Internal customers........................................... 184 22 — (206 ) —
Total revenues............................................. $ 1,944,424 $ 811,503 $ 24,829 $ (206 ) $ 2,780,550
Segment net income........................................ $ 194,419 $ 49,846 $ (38,720) $ — $ 205,545
17
18. 13. Comprehensive Income
The components of total comprehensive income are shown below:
Three months ended Nine months ended
Sept. 30, Sept. 30,
(Thousands of Dollars) 2008 2007 2008 2007
Net income............................................................................................... $ 86,281 $ 105,658 $ 246,924 $ 205,545
Other comprehensive income:
After-tax net unrealized (losses) gains related to derivatives
accounted for as hedges ................................................................... (1,296) (257 ) (1,120) 1,150
After-tax net realized gains on derivative transactions reclassified
into earnings..................................................................................... (384) (385 ) (1,150) (1,132)
Other comprehensive (loss) income......................................................... (1,680) (642 ) (2,270) 18
Comprehensive income............................................................................ $ 84,601 $ 105,016 $ 244,654 $ 205,563
14. Benefit Plans and Other Postretirement Benefits
Pension and other postretirement benefit disclosures below generally represent Xcel Energy consolidated information unless
specifically identified as being attributable to PSCo.
Components of Net Periodic Benefit Cost (Credit)
Three months ended Sept. 30,
2008 (1) 2007 (1) 2008 2007
Postretirement Health
(Thousands of Dollars) Pension Benefits Care Benefits
Xcel Energy Inc.
Service cost............................................................................... $ 15,851 $ 15,520 $ 1,338 $ 1,453
Interest cost............................................................................... 42,630 41,313 12,720 12,619
Expected return on plan assets.................................................. (68,584) (66,208) (7,963 ) (7,600)
Amortization of transition obligation........................................ — — 3,644 3,644
Amortization of prior service cost (credit)................................ 5,166 6,487 (544 ) (545)
Amortization of net loss............................................................ 3,185 4,211 2,875 3,550
Net periodic benefit (credit) cost .............................................. (1,752) 1,323 12,070 13,121
Credits not recognized due to the effects of regulation............. 2,258 2,787 — —
Additional cost recognized due to the effects of regulation...... — — 972 972
Net benefit cost recognized for financial reporting............... $ 506 $ 4,110 $ 13,042 $ 14,093
PSCo
Net periodic benefit cost ........................................................... $ 2,969 $ 4,780 $ 6,747 $ 7,165
Additional cost recognized due to the effects of regulation...... — — 972 972
Net benefit cost recognized for financial reporting................... $ 2,969 $ 4,780 $ 7,719 $ 8,137
(1) Includes qualified and non-qualified pension net periodic benefit cost.
18