Download as PDF, PPTX

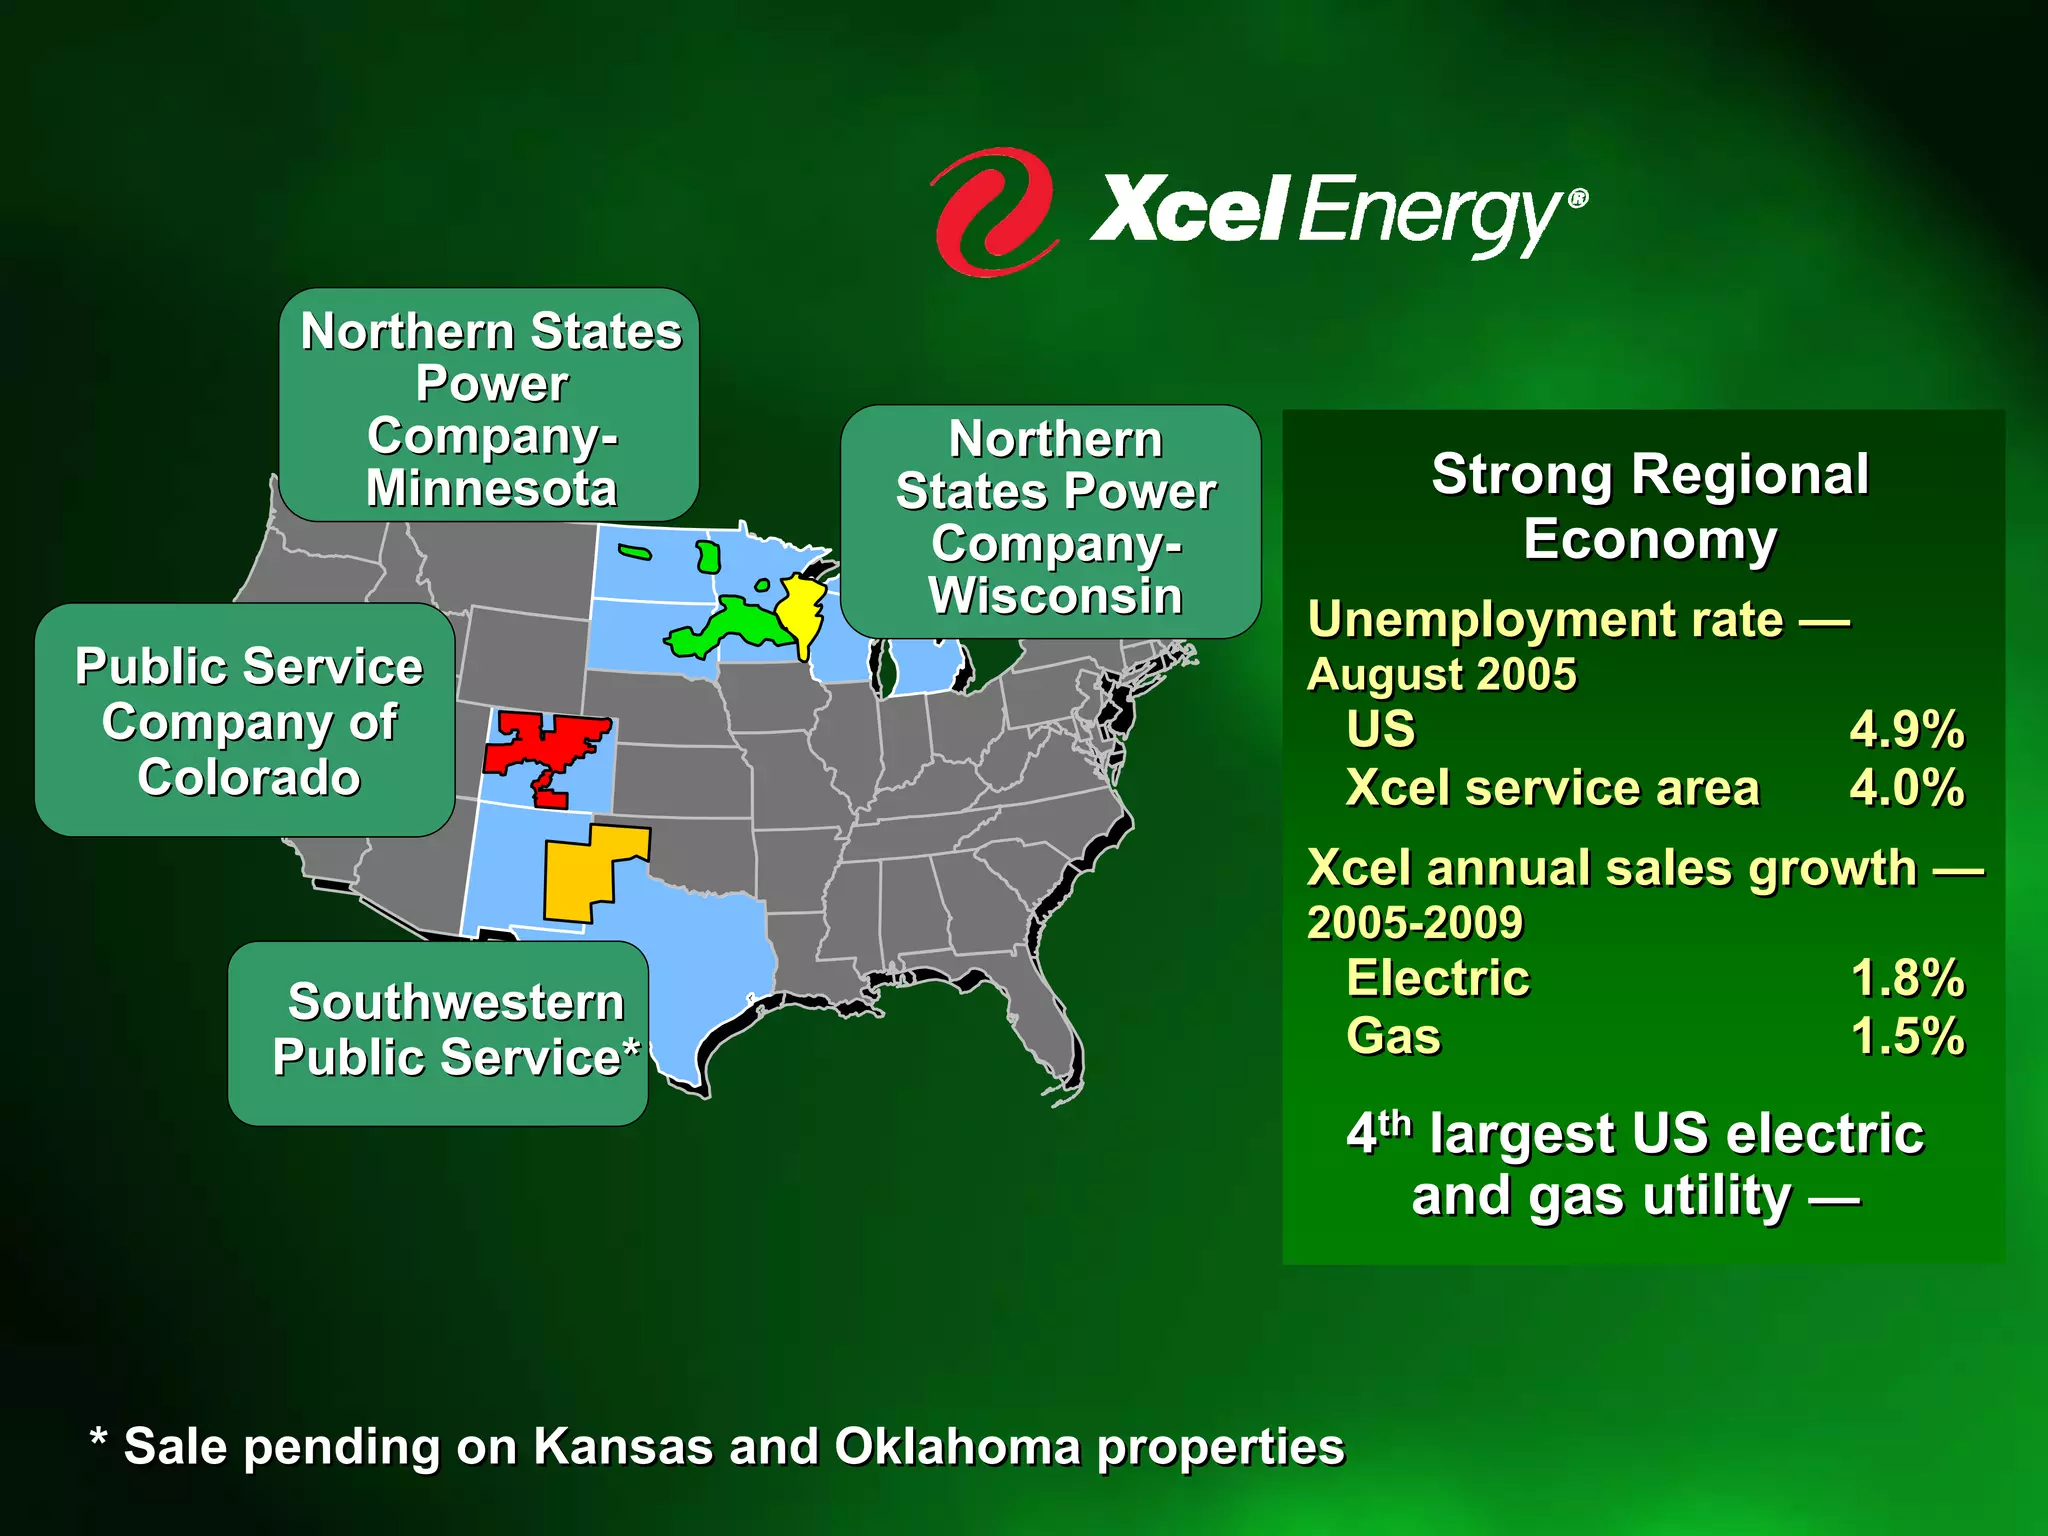

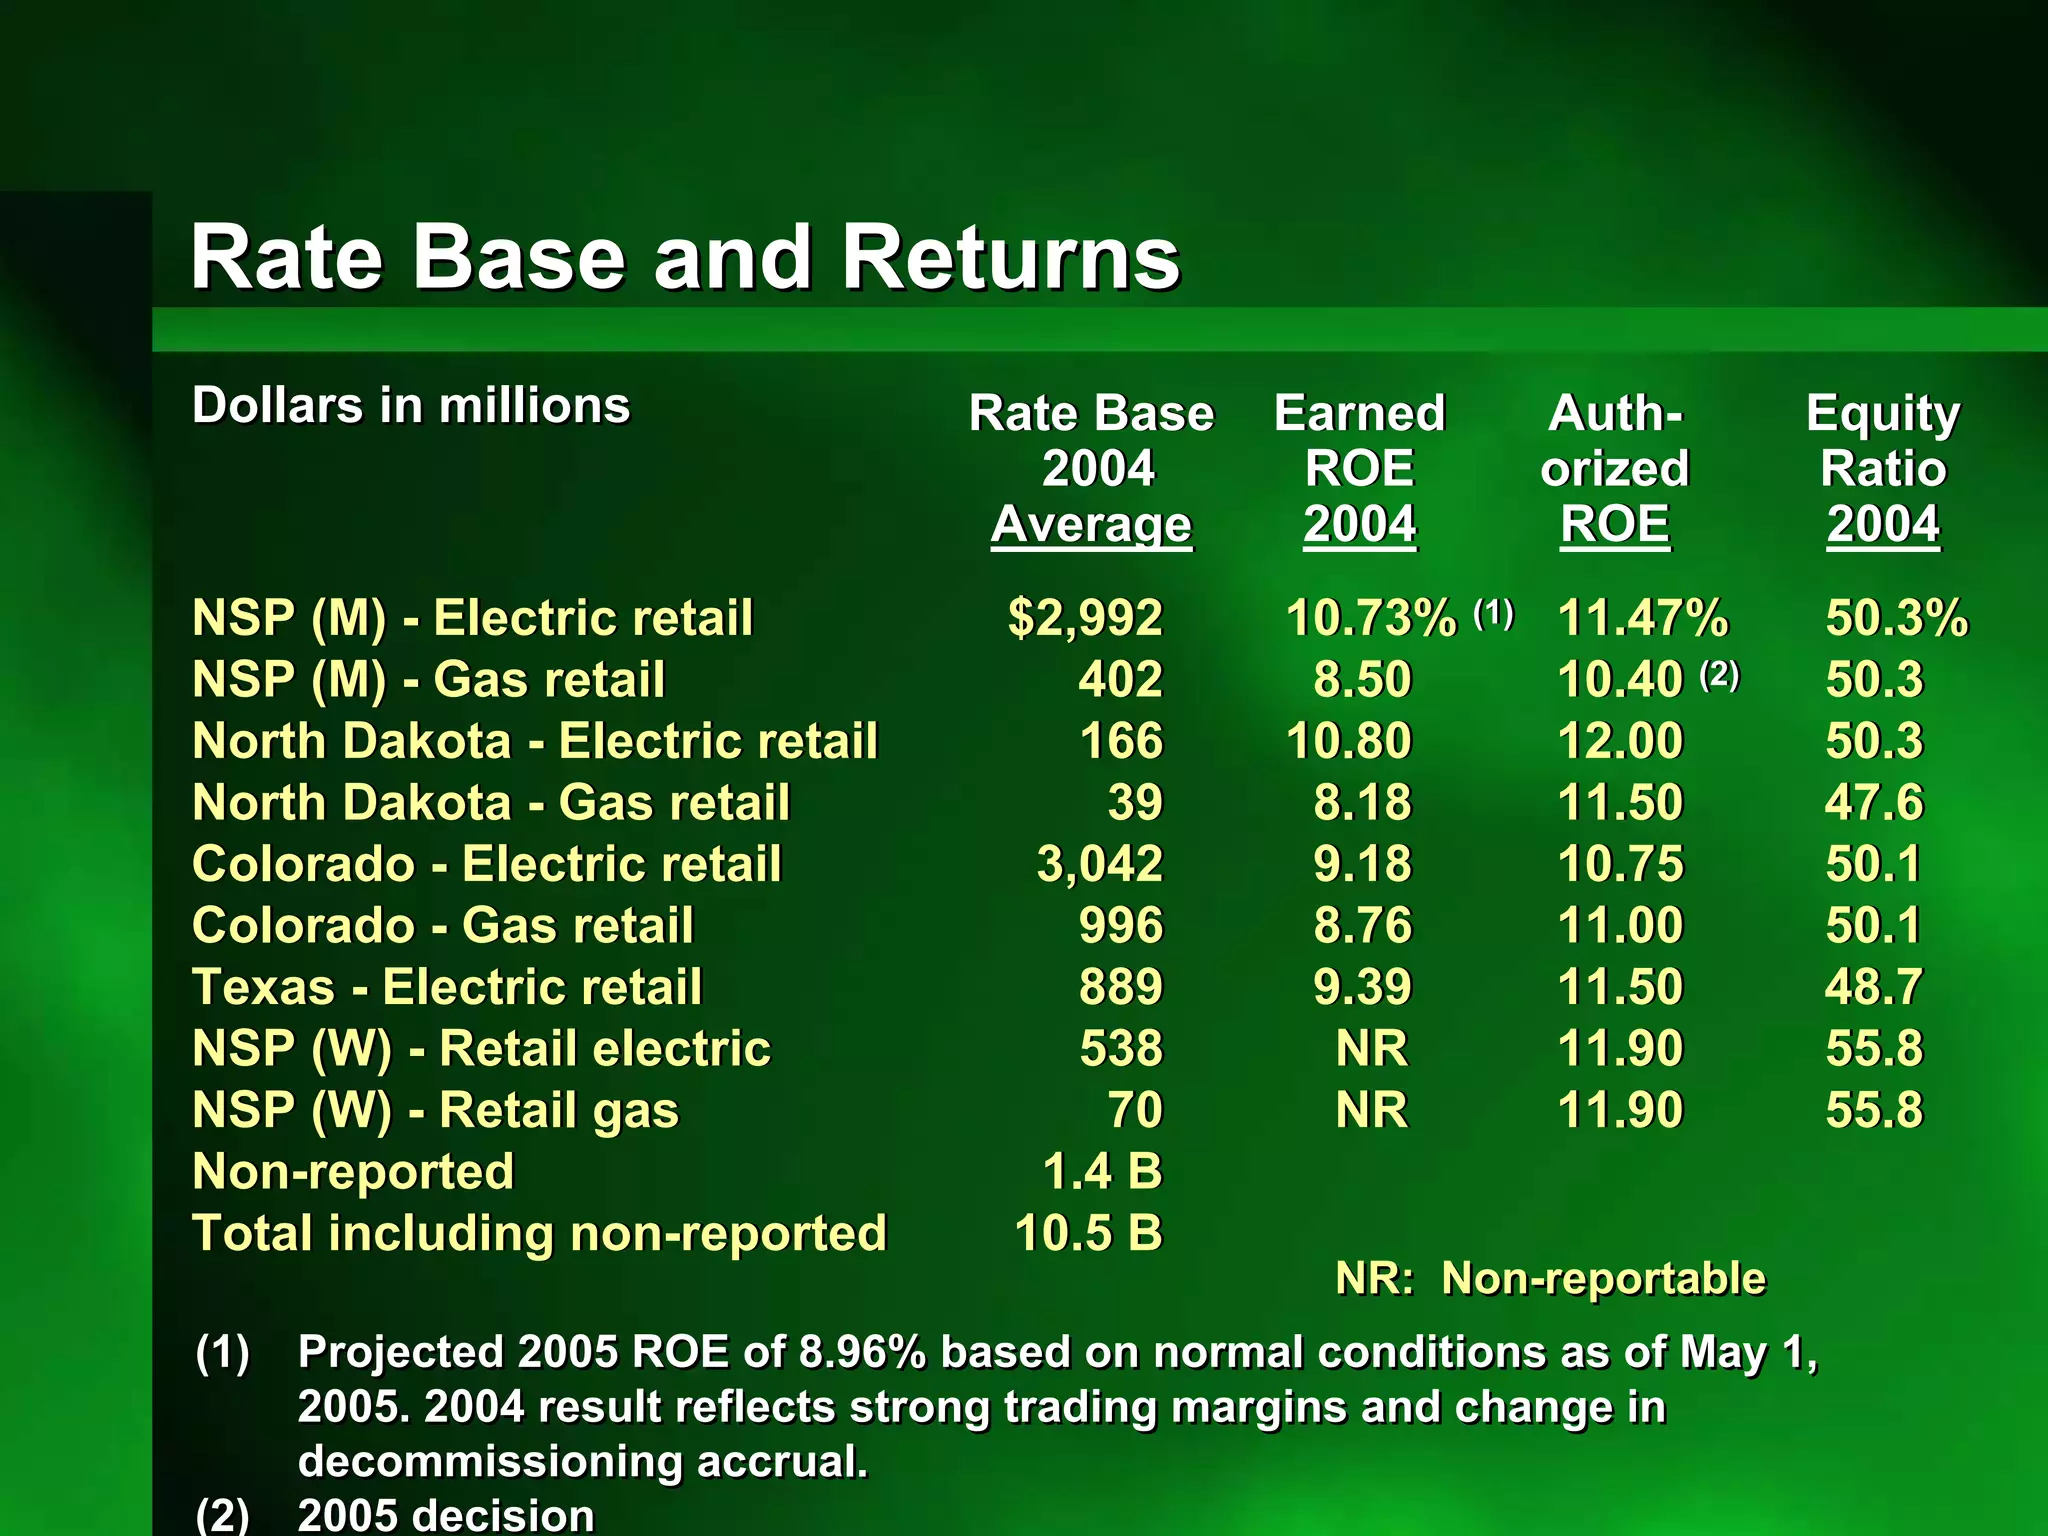


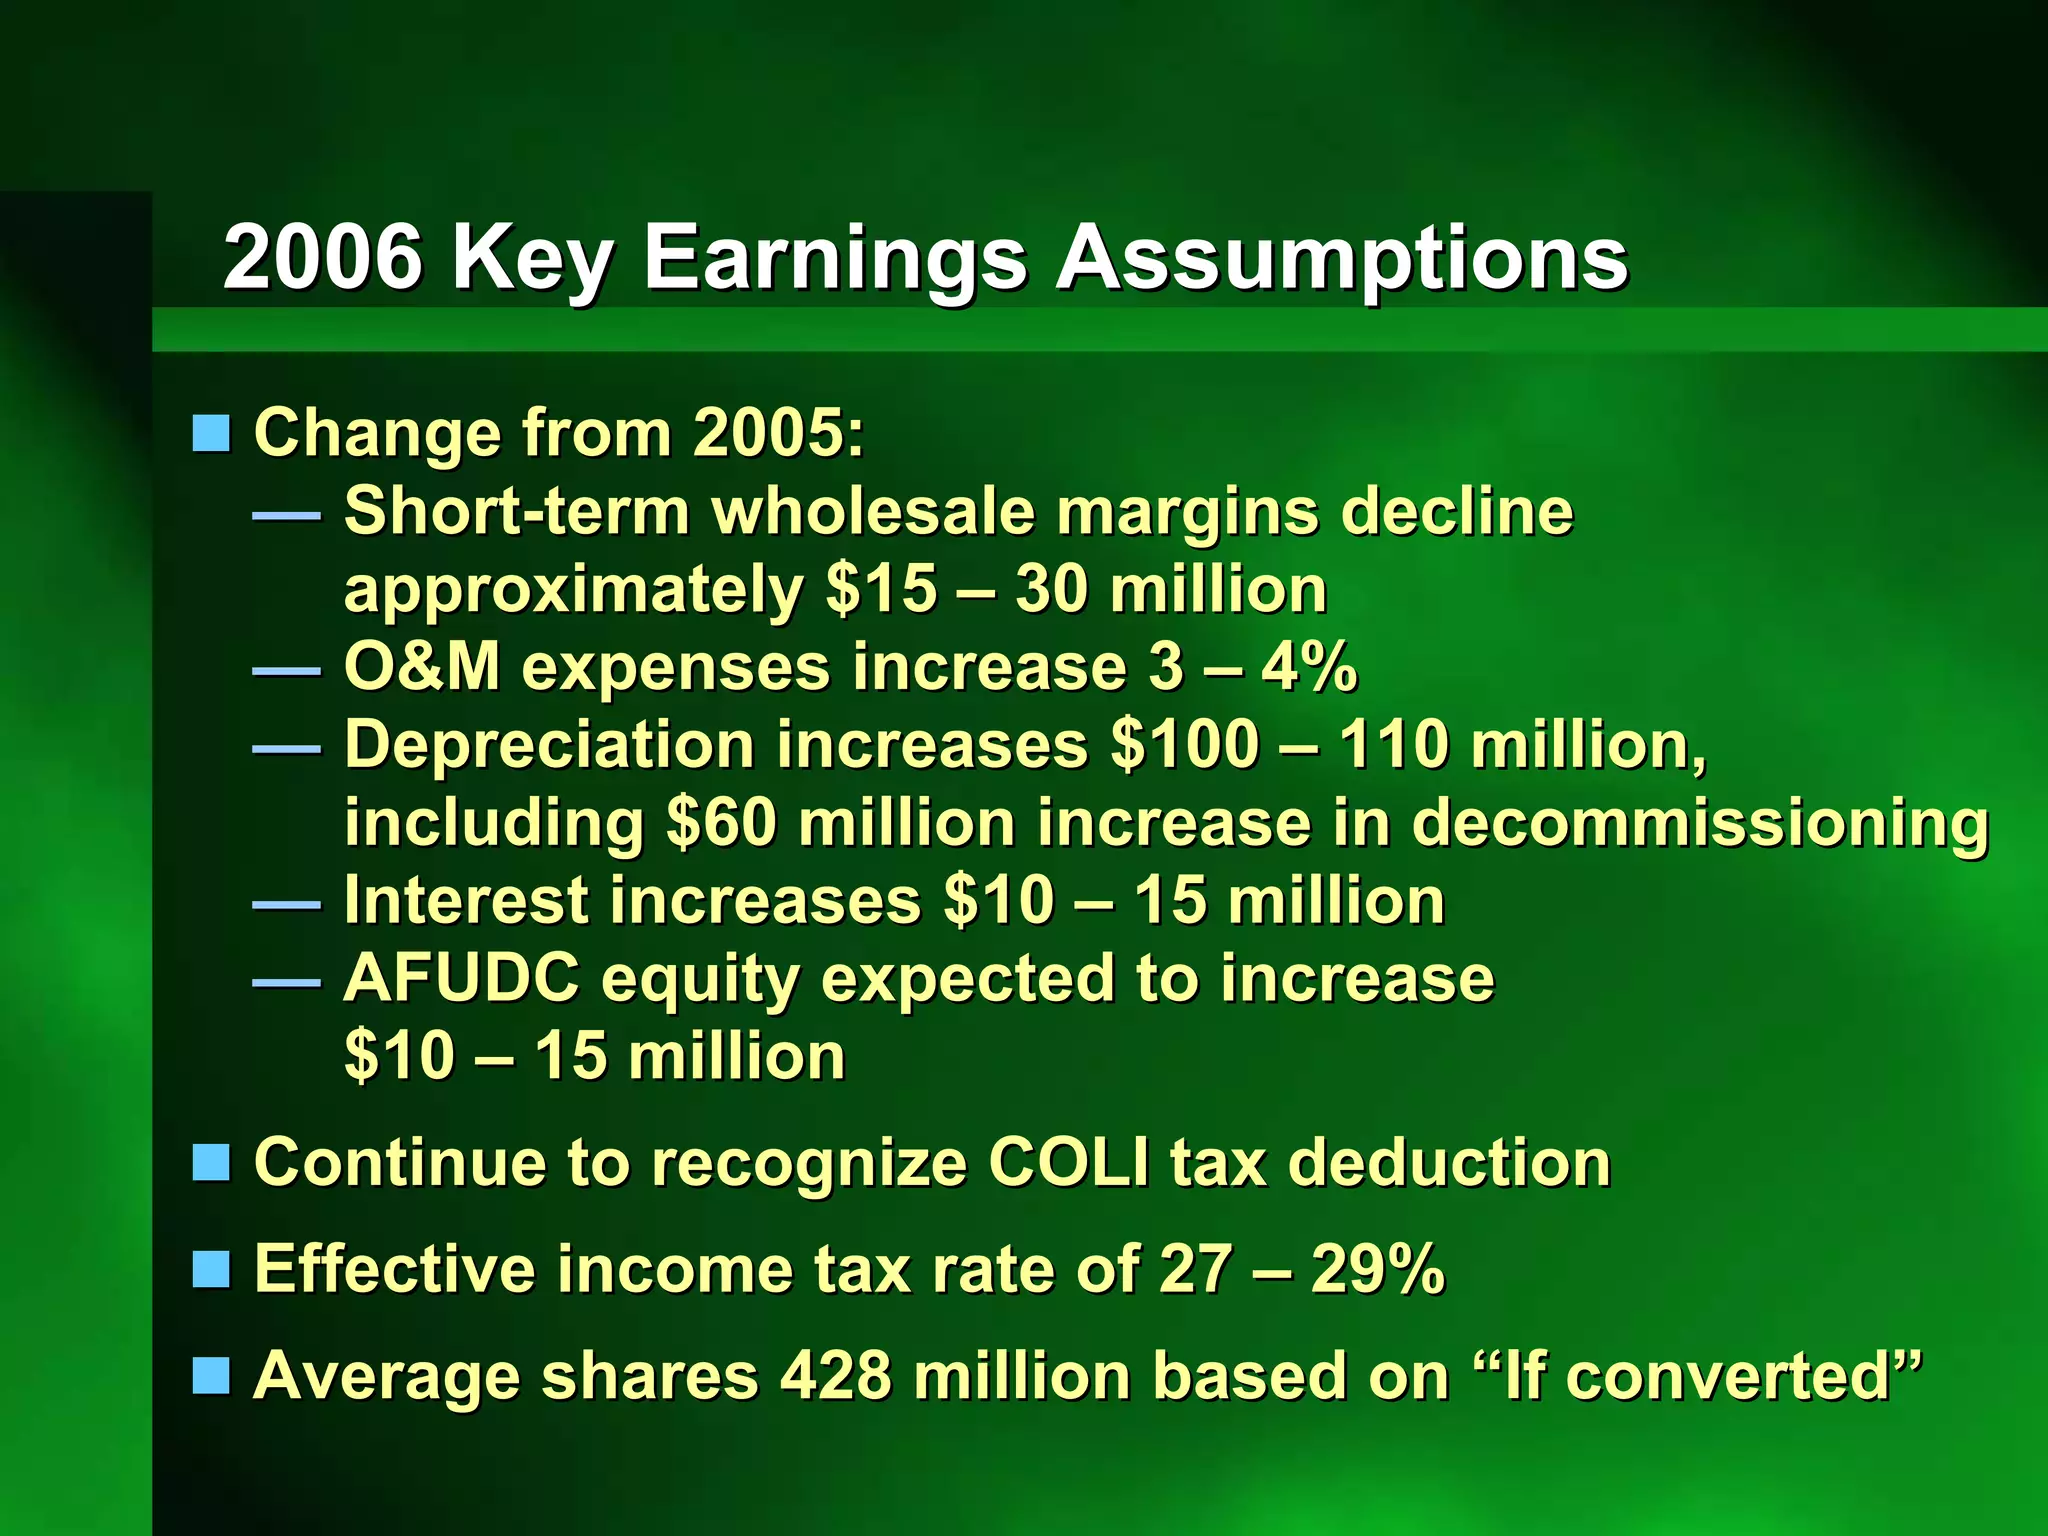


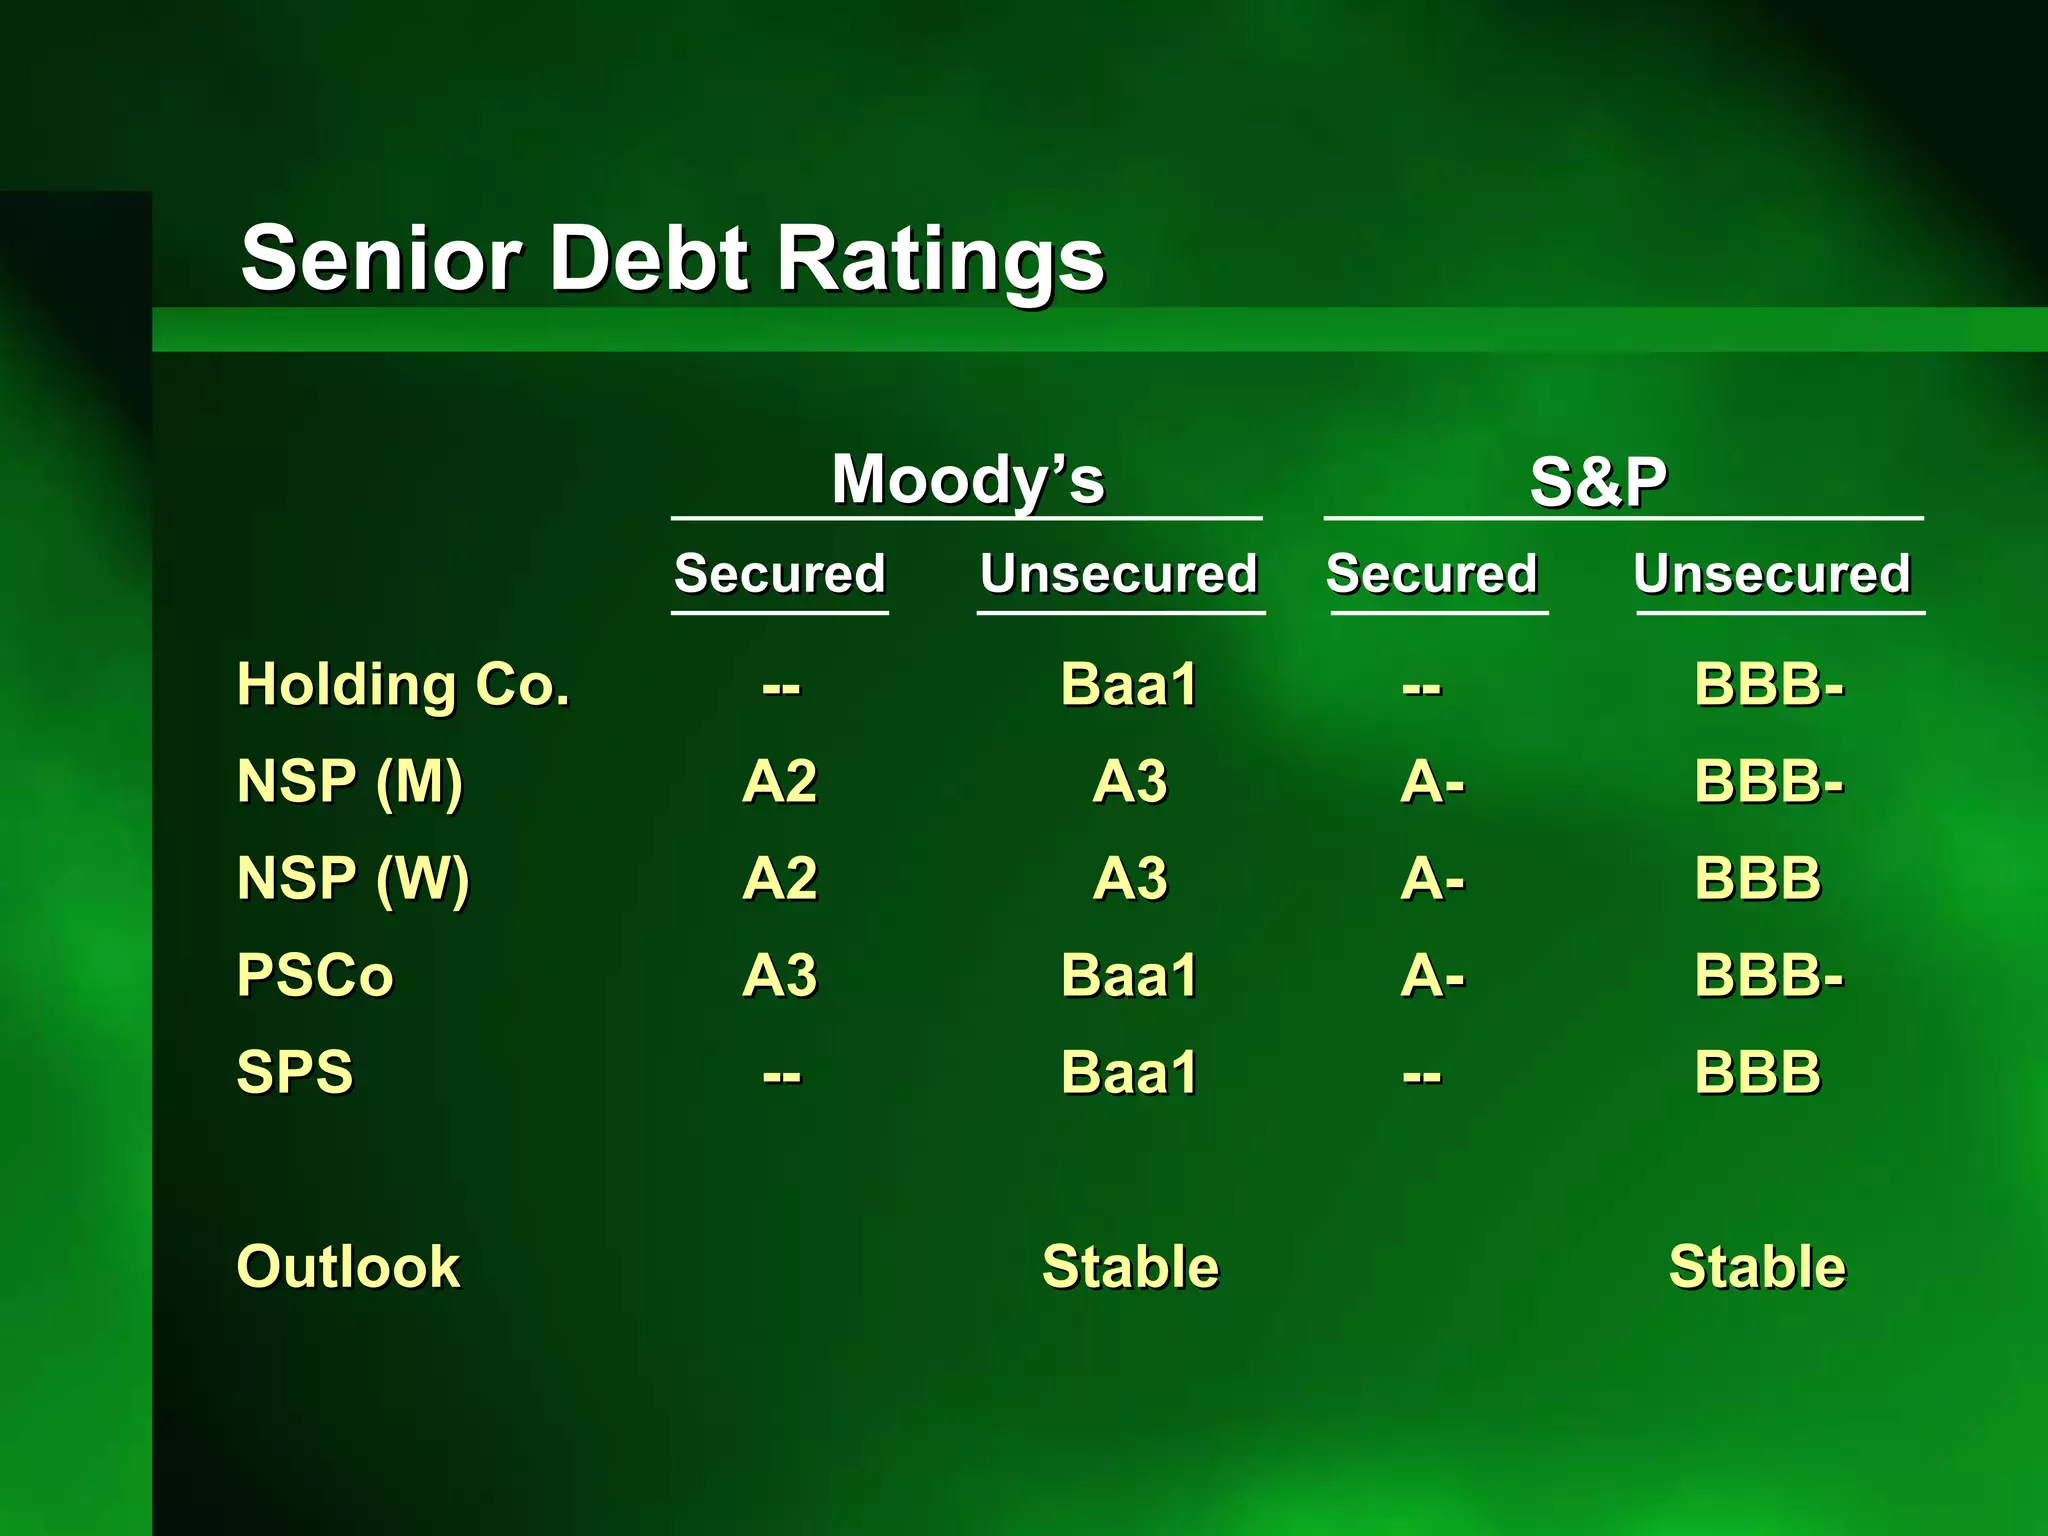


This document provides an overview of Xcel Energy's operations and financial projections. It discusses Xcel's regulated utility subsidiaries, rate base and returns, reconciliation of regulatory and GAAP financial reporting, assumptions for 2006 earnings guidance, and projected capital expenditures and potential earnings from major projects. Key details include projected 2006 O&M and interest expenses, sales growth assumptions, coal supply contracts through 2008, and senior debt ratings of A- to BBB- with a stable outlook.


