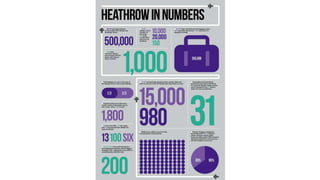
Three flavours of taxonomy tools Joyce van AaltenJoyce van Aalten
Presentation on three flavours of taxonomy tooling (spreadsheets, built-in modules and dedicated taxonomy solutions) by Joyce van Aalten on the Taxonomy Boot Camp Londen 2018
Three flavours of taxonomy tools Joyce van AaltenJoyce van Aalten
Presentation on three flavours of taxonomy tooling (spreadsheets, built-in modules and dedicated taxonomy solutions) by Joyce van Aalten on the Taxonomy Boot Camp Londen 2018
Lego and Duplo: Is SharePoint's Managed Metadata Child's Play?Joyce van Aalten
Presentation by Joyce van Aalten at Taxonomy Boot Camp London 2017.
This presentation is an introduction to SharePoint’s managed metadata: what are they, what can they do and what can’t they do. Joyce van Aalten illustrates with LEGO and DUPLO what the possibilities and limitations of managed metadata are. And how they relate to site columns, libraries and content types. Finally, Joyce gives some suggestions from her own consultancy projects how to successfully implement SharePoint managed metadata.
Mind the mindmap: structure and organise your taxonomy termsJoyce van Aalten
Presentation by Joyce van Aalten at Taxonomy Boot Camp London 2017.
Cardsorting is a well-known tool for organizing and structuring terms in a taxonomy or thesaurus. But mindmapping is another tool that, although often used for brainstorming, is ideal in several stages of taxonomy development. In this short talk Joyce van Aalten shows you how mindmapping as a concept and mindmapping tools can be used when collecting, structuring and validating taxonomy terms. Whether you choose the top down method or the bottom up approach in taxonomy development. Joyce gives you insight in how mindmapping made taxonomies come to live in the organizations she has worked for.
3. Wat is een infographic
• Een visuele weergave van informatie en data
“Charts and graphs can communicate data; infographics turn
data into information”
4. Een goede infographic…
• Vertelt een verhaal met begin en eind
• Heeft één centrale boodschap
• Komt met nieuwe kijk, iets verrassends
• Is visueel prettig om naar te kijken
• Is goed onderbouwd
5. Elementen van een infographic
• Duidelijk titel/inleiding
• Grafieken en iconen
• Korte teksten
• Conclusie of boodschap
6.
7.
8.
9.
10.
11.
12.
13. Stappen in een infographic
• Bepaal context: boodschap, doel, publiek
• Verzamel en structureer data
• Bepaal type infographic en grafiek(en)
• Trek de aandacht
• Vertel het verhaal
14. Trek de aandacht
• Kies kleuren (max. 3) en lettertypen (max. 2)
• Kies foto’s, iconen die bij elkaar passen
• Verwijder rommel
• Durf leeg te laten
• Benadruk wat belangrijk is met kleur, vet, schuin, grootte
15.
16.
17. Aan de slag: voorbeeldcase
• Lees hoofdstuk 2 “Effecten van lezen”
• https://sardes.nl/pathtoimg.php?id=1786
18. Aan de slag: bepaal elementen
• Lees nogmaals hoofdstuk 2
• Bepaal minimaal 3 elementen die je
in je infographic wilt verwerken
19. Aan de slag: verwerk elementen
• Verwerk je elementen tot een infographic in
• www.piktochart.com