
Recommended
More Related Content
Viewers also liked
Viewers also liked (17)
West Stores
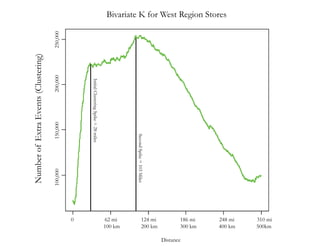
- 1. 0 62 mi 124 mi 186 mi 248 mi 310 mi 100 km 200 km 300 km 400 km 500km Distance InitialClusteringSpike=28miles SecondSpike=103Miles Bivariate K for West Region Stores 100,000150,000200,000250,000 NumberofExtraEvents(Clustering)