1
Week 6 Analysis
The survey for week 6 went well. We had a new survey given out. Some questions were
the same and some questions were changed or worded differently due to the response
from the analysis from the last survey. In this analysis I will be breaking down the
questions and how the customers responded to these questions. At the end of the
analysis, I will give my conclusion with the way the questions were answered and give
feedback.
Question 1
The first question was the same as the last survey which was “How did you contact
us?” (Department of Revenue) Like the previous survey, the majority of the interns
were doing surveys via phone, the data concludes that 1,866 responded to this
question and 1,848 (99%) of customers took the survey via telephone call and 18 (1%)
of customers took the survey via walk-in this week. Since this question was self
explanatory our supervisors and trainers told us not to ask this question to the
customers.
Question 2
This question asks “What was the representative’s name or agent ID. This is the same
question from the previous analysis however this survey came with two fill in boxes
that has the representative’s name and the agent ID number. With this question, only
1,728 customers answered the question and 1,493 had the agents name and 1,098
had the agent’s ID.
Question 3
Question 3 is a new question added to the survey. The questions asked “How long did
you wait before speaking with a representative?” With this question we have a range of
wait-time (in minutes) from 0-10, 11-20, 21-30, 41-50, 51-60, 61+. We had 1,921
responses with this question and 1,752 (91.2%) of customers had a wait time from 0-
10 minutes, 117 (6.1%) had a wait time from 11-20 minutes, 27 (1.4%) had a wait time
of 21-30 minutes, 8 (0.4%) had a wait time of 31-40 minutes, 6 (0.3%) had a wait time
of 41-50 minutes, 4 (0.2%) had a wait time of 51-60 minutes, and 7 (0.4%) had a wait
time of 61 minutes or more. Below is the data that was collected during week 6.
1
Question 4
Question 4 is the same question from the previous survey. The question ask, “What
letter grade would you give to rate your satisfaction with the wait time before
speaking to a representative?” When I asked this question, I usually would tell the
callers the grading scale from A-F with A being the best and F being the worst. With is
question, there were 1,918 responses and 1,202 (62.7%) gave wait time satisfaction
an A, 215 (19.1%) gave wait time satisfaction a B, 215 (11.2%) gave wait time
satisfaction a C, 91 (4.7%) gave wait time satisfaction a D, and 43 (2.2%) gave wait
time satisfaction a F.
Question 5
Like question 4, this question is one of the same questions from the last survey. This
questions asks, “What letter grade would you give to rate your overall satisfaction with
the customer service you received?” With this question, I asked this the same way I did
in question 4. This question had 1,920 responses and 1,756 (91.5%) gave customer
service satisfaction an A, 120 (6.3%) gave customer service satisfaction a B, 25 (1.3%)
Answer Options
Response
Percent
Response
Count
0-10 91.2% 1752
11-20 6.1% 117
21-30 1.4% 27
31-40 0.4% 8
41-50 0.3% 6
51-60 0.2% 4
61+ 0.4% 7
answered question 1921
skipped question 9
1
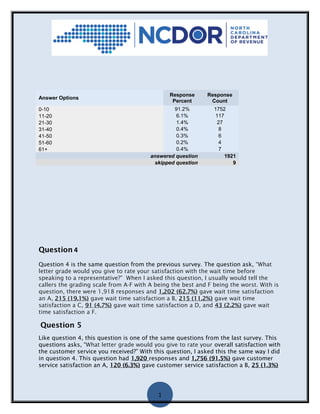
gave customer service satisfaction a C, 14 (0.7%) gave customer satisfaction a D, and
5 (3%) gave customer satisfaction grade of an F.
Question 6
This question is similar to question 5 from the last survey but is slightly worded
differently. The question asks, “Why did you rate your customer service satisfaction as
[letter grade given]?” With this question, there were several responses. Most were
mainly positive for example, “She (the agent) was prompt, put everything in a matter
of seconds. I told her what the problem was and she fixed it.” Others were, “Agent was
very friendly and she paid attention to what was being asked; was very thorough, had
a pretty good customer service attitude.” I did not see too many bad reviews in this
week’s data.
Question 7
Question 7 was also a new question that was added on to the survey. This question
asks, “Was your issue resolved today?” With this question we had 1,918 responses and
1,596 (83.2%) customers had their issue resolved, 83 (4.3%) customers did not have
their issue resolved, and 239 (12.5%) customers had their issue in the process of
being resolved. Below are the question and the results and the percentage of the
results.
Question 8
Question 8 is one of the additional questions that was added on to the survey for July.
This question asks, “Was this the first time you called about this issue?” This question
had a total of 1,920 responses and 1,456 (75.8%) of customers said that it was their
first time calling about their issue while 464 (24.2%) customers have called about
their issue before. Below is a chart with the percentages.
1
Question 9
Question 9 is the last question of the survey. This question asks, “Are there any
additional comments that you would like to leave related to your customer service
experience?” This question had 861 responses and 1,069 customers skipped this
question. With this question the customers responded with their own answer like, “She
was very thorough, told step-by-step what was needed to do and why it was needed.
Explained what the customer needed to take with her.” And “Doesn't like being on
hold without background music. Its dead silence and customer thought she was hung
up on. Suggests that there should be she was very thorough, told step-by-step what
was needed to do and why it was needed. Explained what the customer needed to
take with her. The other response were either a no, none, N/A, or did not answer the
question.
Conclusion/Feedback
This month’s survey had a lot of new questions. I think the new questions helped
make this month’s survey better. This month was still have the majority of our surveys
via telephone call, we had more customers give us the agent’s name than the ID, the
customers wait time was mainly around 0-10 minutes, the customer’s wait time
satisfaction was mainly an A as well as customer service satisfaction. The reason for
the overall grade was mainly on a positive note; the majority of customers got their
issue resolved as well as it being the first time calling about their issue, and the
majority did not have any comments of concern about their customer experience.
1
With the new questions, we were able to get more detail with the results. I still think
that the letter grade questions need to be reworded differently in order for the
customers to distinguish them. In all we have received better improved results from
last month’s survey.
1
With the new questions, we were able to get more detail with the results. I still think
that the letter grade questions need to be reworded differently in order for the
customers to distinguish them. In all we have received better improved results from
last month’s survey.

Week6Analysis.AshleySnipes

  • 1.
    1 Week 6 Analysis Thesurvey for week 6 went well. We had a new survey given out. Some questions were the same and some questions were changed or worded differently due to the response from the analysis from the last survey. In this analysis I will be breaking down the questions and how the customers responded to these questions. At the end of the analysis, I will give my conclusion with the way the questions were answered and give feedback. Question 1 The first question was the same as the last survey which was “How did you contact us?” (Department of Revenue) Like the previous survey, the majority of the interns were doing surveys via phone, the data concludes that 1,866 responded to this question and 1,848 (99%) of customers took the survey via telephone call and 18 (1%) of customers took the survey via walk-in this week. Since this question was self explanatory our supervisors and trainers told us not to ask this question to the customers. Question 2 This question asks “What was the representative’s name or agent ID. This is the same question from the previous analysis however this survey came with two fill in boxes that has the representative’s name and the agent ID number. With this question, only 1,728 customers answered the question and 1,493 had the agents name and 1,098 had the agent’s ID. Question 3 Question 3 is a new question added to the survey. The questions asked “How long did you wait before speaking with a representative?” With this question we have a range of wait-time (in minutes) from 0-10, 11-20, 21-30, 41-50, 51-60, 61+. We had 1,921 responses with this question and 1,752 (91.2%) of customers had a wait time from 0- 10 minutes, 117 (6.1%) had a wait time from 11-20 minutes, 27 (1.4%) had a wait time of 21-30 minutes, 8 (0.4%) had a wait time of 31-40 minutes, 6 (0.3%) had a wait time of 41-50 minutes, 4 (0.2%) had a wait time of 51-60 minutes, and 7 (0.4%) had a wait time of 61 minutes or more. Below is the data that was collected during week 6.
  • 2.
    1 Question 4 Question 4is the same question from the previous survey. The question ask, “What letter grade would you give to rate your satisfaction with the wait time before speaking to a representative?” When I asked this question, I usually would tell the callers the grading scale from A-F with A being the best and F being the worst. With is question, there were 1,918 responses and 1,202 (62.7%) gave wait time satisfaction an A, 215 (19.1%) gave wait time satisfaction a B, 215 (11.2%) gave wait time satisfaction a C, 91 (4.7%) gave wait time satisfaction a D, and 43 (2.2%) gave wait time satisfaction a F. Question 5 Like question 4, this question is one of the same questions from the last survey. This questions asks, “What letter grade would you give to rate your overall satisfaction with the customer service you received?” With this question, I asked this the same way I did in question 4. This question had 1,920 responses and 1,756 (91.5%) gave customer service satisfaction an A, 120 (6.3%) gave customer service satisfaction a B, 25 (1.3%) Answer Options Response Percent Response Count 0-10 91.2% 1752 11-20 6.1% 117 21-30 1.4% 27 31-40 0.4% 8 41-50 0.3% 6 51-60 0.2% 4 61+ 0.4% 7 answered question 1921 skipped question 9
  • 3.
    1 gave customer servicesatisfaction a C, 14 (0.7%) gave customer satisfaction a D, and 5 (3%) gave customer satisfaction grade of an F. Question 6 This question is similar to question 5 from the last survey but is slightly worded differently. The question asks, “Why did you rate your customer service satisfaction as [letter grade given]?” With this question, there were several responses. Most were mainly positive for example, “She (the agent) was prompt, put everything in a matter of seconds. I told her what the problem was and she fixed it.” Others were, “Agent was very friendly and she paid attention to what was being asked; was very thorough, had a pretty good customer service attitude.” I did not see too many bad reviews in this week’s data. Question 7 Question 7 was also a new question that was added on to the survey. This question asks, “Was your issue resolved today?” With this question we had 1,918 responses and 1,596 (83.2%) customers had their issue resolved, 83 (4.3%) customers did not have their issue resolved, and 239 (12.5%) customers had their issue in the process of being resolved. Below are the question and the results and the percentage of the results. Question 8 Question 8 is one of the additional questions that was added on to the survey for July. This question asks, “Was this the first time you called about this issue?” This question had a total of 1,920 responses and 1,456 (75.8%) of customers said that it was their first time calling about their issue while 464 (24.2%) customers have called about their issue before. Below is a chart with the percentages.
  • 4.
    1 Question 9 Question 9is the last question of the survey. This question asks, “Are there any additional comments that you would like to leave related to your customer service experience?” This question had 861 responses and 1,069 customers skipped this question. With this question the customers responded with their own answer like, “She was very thorough, told step-by-step what was needed to do and why it was needed. Explained what the customer needed to take with her.” And “Doesn't like being on hold without background music. Its dead silence and customer thought she was hung up on. Suggests that there should be she was very thorough, told step-by-step what was needed to do and why it was needed. Explained what the customer needed to take with her. The other response were either a no, none, N/A, or did not answer the question. Conclusion/Feedback This month’s survey had a lot of new questions. I think the new questions helped make this month’s survey better. This month was still have the majority of our surveys via telephone call, we had more customers give us the agent’s name than the ID, the customers wait time was mainly around 0-10 minutes, the customer’s wait time satisfaction was mainly an A as well as customer service satisfaction. The reason for the overall grade was mainly on a positive note; the majority of customers got their issue resolved as well as it being the first time calling about their issue, and the majority did not have any comments of concern about their customer experience.
  • 5.
    1 With the newquestions, we were able to get more detail with the results. I still think that the letter grade questions need to be reworded differently in order for the customers to distinguish them. In all we have received better improved results from last month’s survey.
  • 6.
    1 With the newquestions, we were able to get more detail with the results. I still think that the letter grade questions need to be reworded differently in order for the customers to distinguish them. In all we have received better improved results from last month’s survey.