Downloaded 28 times


![1.1 Why water treatment?
1
CHAPTER
1.1 Why water treatment?
Pure water [H2O] is a colourless, odourless and tasteless
liquid. It plays a huge part in everyday life: 70% of the earth’s sur-
face is covered by water in the form of oceans, and the rest of
the planet has large quantities of water in the form of lakes,
rivers and watercourses, ice and snow, and humidity, as well as
the principal element of animal life (>50%) and plants
(approx. 80%).
When we talk about water in general, we usually mean water
for some specific purpose, e.g. drinking water or process
water for industry. This is where the term water treatment
comes into the picture, as the available water resources or that
provided by nature is not always of a suitable quality for
immediate use for the specific purpose.
Drinking water must be pure, and should preferably taste good
too, and it must not contain substances that could cause prob-
lems with daily use. Process water, which is water that forms a
direct and important part of a process or product in industry,
must have a chemical composition and temperature that is pre-
cisely suited to the specific requirements.
1.1.1 Treatment of drinking water
When we look at drinking water, the presence of fairly small
undissolved (suspended) particles will often give it a cloudy ap-
pearance, making it look unappealing to drink. This problem is
almost always seen with surface water intake (e.g. rivers). The
colour, smell and taste of the water are also crucial for its suit-
ability. The water may also have too high a content of
dissolved salts, e.g. sea water, which is suitable neither for drink-
ing nor for use as process water.
As the water is in contact with various types of metal in the form
of pipes, fittings, tanks etc. on its way from intake location to
end-user, one requirement will be that the water should not de-
teriorate these components, i.e. it should not be corrosive.
As mentioned above, pure water is colourless, odourless and
tasteless. Totally pure water is not particularly enjoyable to
drink, but it is safe and quenches thirst, just as water should. For
drinking water to be good, it must contain certain substances,
not only for its appearance, taste and smell, but also for health
reasons. WHO has drawn up a list of a number of these sub-
stances that it recommends should be present in “good water”.
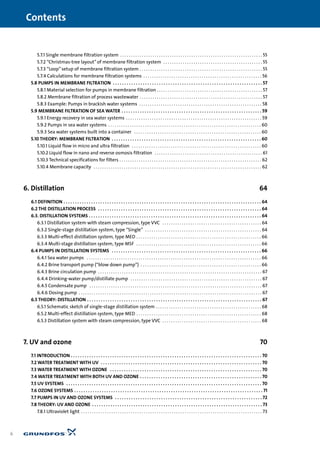
The list indicates recommended and/or upper limits for the con-
centration of these substances in drinking water. The water’s
microorganism content is also considered.
WHO’s list, as a matter of routine, also takes into consideration
non-health factors by including recommended quantities for
substances that improve water and make it suitable for ordinary
practical purposes in other respects. Recommended and maxi-
mum permissible concentrations for some of the most impor-
tant substances in drinking water are listed in table 1 below. This
list is by and large identical to WHO’s recommendations.
1. Introduction
8
1. Introduction](https://image.slidesharecdn.com/water-treatment-150521102613-lva1-app6891/85/Water-treatment-9-320.jpg)
![1.2 The chemistry of water
1
CHAPTER
1.1.3 Requirements for water treatment pumps
In all water treatment processes it is necessary to move the wa-
ter around and/or raise the water pressure significantly. Some
forms of water treatment only require the water to be forced
through a simple filter with a few metres’ head, while others,
such as reverse osmosis, for example, require up to 70 bar (10.15
p.s.i.) This factor, together with the varied chemical composi-
tions and temperatures of water, means that there is a huge
range of pumps for water treatment. In addition to the pressure
requirement, aggressive (i.e. corrosive) water will make certain
demands on material selection.
Therefore it is important to be well informed about the chem-
istry of the water and the parameters causing corrosion when
choosing a pump.
1.2 The chemistry of water
Water, which has the chemical formula H2O, has a fantastic abil-
ity to dissolve diverse substances, which can necessitate purifi-
cation in order to achieve the desired quality for each applica-
tion.
There is always a limit to how much of a given substance can be
dissolved in water. Once this limit is reached, the solution is sat-
urated. If a substance dissolves to a high degree, it is said to be
readily soluble (e.g. common salt). Then there are slightly solu-
ble substances (e.g. gypsum), and totally insoluble substances
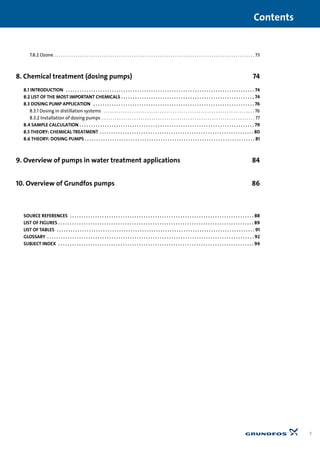
(e.g. sand). Those we are most interested in in connection with
water treatment are typically the substances, or ions, as they are
most usually designated, show in table 2 above.
The total content of dissolved substances in water, other than dis-
solved gases, is calledTDS (Total Dissolved Solids).
Theacidityofthewater(pHvalue)andtemperaturearealsostated.
1.2.1 Gases dissolved in water
In water, there are also dissolved gases such as oxygen [O2], car-
bon dioxide [CO2], and in some cases methane [CH4] and hydro-
gen sulphide [H2S].
The presence of oxygen and carbon dioxide makes the water
fresh. Hydrogen sulphide [H2S] makes water smell like rotten
eggs.
1.2.2 The conductivity of water
The term ion is easiest to explain with an example: If we look at
common cooking salt (sodium chloride), which has the chemical
symbol NaCl, in an aqueous solution it will consist of two
charged “particles”, Na+ and Cl- ions, which can move freely in
the solution. The solid form of the salt [NaCl] can be formed
when the solution becomes supersaturated, e.g. by evaporation.
The salt precipitates, the ions combine into a solid compound,
and have now outwardly become electrically neutral. Ions with a
positive charge are called cations and those with a negative
charge are called anions.
Another measure of the ion content of water is the water’s elec-
trical conductivity. Conductivity is measured in S/m, Siemens
per meter (Siemens = mho = ohm-1). The most commonly used
are mS/cm (milliSiemens per cm) or µS/cm (micro-Siemens per
cm). There is, on the whole, direct proportionality between the
concentration of ions in water and the water’s conductivity.
Therefore we often see a simplified water analysis given with
only the water’s conductivity, degree of hardness, pH and tem-
perature. If you have some information or an impression of
which ions are involved, an estimate of the concentration can be
done using tables and graphs of the ions’ conductivity in an
aqueous solution.
1. Introduction
10
Substance Chemical symbol Substance Chemical symbol
Ammonium NH4
+ Bicarbonate HCO3
-
Calcium Ca++ Carbonate CO3
--
Iron Fe++(+) Chloride Cl-
Magnesium Mg++ Fluoride F-
Manganese Mn++ Hydroxide OH-
Potassium K+ Nitrate NO3
-
Sodium Na+ Phosphate PO4
---
Silicate SiO3
--
Sulphate SO4
--
Note:
The measuring units for ions are usually given in mg/l or mval/l. 1 mval contains naturally as many mg of the ion as its equivalent weight states. The equivalent
weight is the ion’s atomic weight (molecular weight) divided by the number of charges (see below). E.g.: Calcium has an atomic weight of 40. 1 mval Calcium/l is
therefore: 40/2 = 20 mg/l.
Table 2: Chemical symbols for various soluble substances](https://image.slidesharecdn.com/water-treatment-150521102613-lva1-app6891/85/Water-treatment-11-320.jpg)
![1.2 The chemistry of water
1
CHAPTER
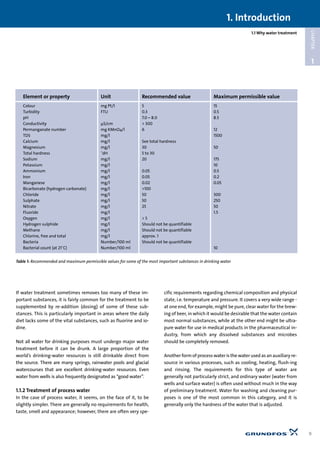
Fig. 1 shows an example of various ions’conductivity in water.
1.2.3 The hardness of water
As ions are electrically charged, they influence one another, and
they enter into a state of chemical equilibrium in an
aqueous solution. A fundamental state of equilibrium in water
chemistry is one involving calcium [Ca++] and bicarbonate
[HCO3
-]:
The equilibrium could also be written with Mg++ in place of
Ca++. The interesting thing about the equilibrium is that it ex-
presses something about the hardness of the water (the quanti-
ty of Ca++ ions) and its CO2 aggressiveness, i.e. the ability to dis-
solve lime scale [CaCO3] and corrode metal surfaces. Depending
which direction the equilibrium is shifted to, the water will be
hard (a shift to the left) or aggressive/soft (a shift to the right).
By removing CO2 (e.g. by heating or degassing) the equilibrium
will be shifted towards the right, Ca++ and HCO3
- will form
CaCO3, which is deposited (limestone), and the hardness in the
water is thus reduced.
This hardness is called carbonate hardness or temporary hard-
ness, as it can be removed in this simple way.
What is most commonly understood by “hardness” is the wa-
ter’s total content of Ca++ and Mg++ ions. This is designated total
hardness. A high calcium and magnesium content produces
hard water, while a low content gives soft water.
Permanent hardness is defined as the difference between
total and temporary hardness and can be loosely explained as
the quantity of calcium and magnesium that corresponds to sul-
phate [SO4
2-] and chloride [Cl-]. Permanent hardness is charac-
terised by the fact that it cannot be removed by boiling etc.
The correlation between the different specifications of hardness
is that total hardness is equal to temporary hardness plus per-
manent hardness.
Hardness can be specified in several ways:
The German hardness degree, °dH, is defined as the hardness
that corresponds to the equivalent quantity of CaO/l. 1°dH is
equal to 10 mg CaO/l.
The French hardness degree, °F, is defined as the hardness that
corresponds to the equivalent quantity of CaCO3/l. 1°F is
equal to 10 mg CaCO3/l.
A commonly used unit for hardness, which is used by experts in
water treatment technology, is the hardness that corresponds
to the equivalent quantity of CaCO3 and is measured
directly in mg/l.
The relationship between these three methods of measuring
hardness is:
1°dH = 1.8°F = 18 mg CaCO3/l
Water of varying hardness can be divided into the following
groups:
The hardness of the water has no effect on the taste, smell and
appearance of the water or on health, but it can be a major
nuisance, as it causes scaling (calcarous deposits) in pipes, boil-
ers and sanitary appliances.
1. Introduction
11
Hardness °dH °F CaCO3 mg/l
Very soft water 0 - 4 0 - 7 0 - 70
Soft water 4 - 8 7 - 14 70 - 140
Moderately hard water 8 - 12 14 - 22 140 - 220
Fairly hard water 12 - 18 22 - 32 220 - 320
Hard water 18 - 30 32 - 54 320 - 540
Very hard water Over 30 Over 54 Over 540
Table 3: Hardness of various types of water specified in three different units
0.1 0.2 0.4 0.6 0.8 1 2 4 6 8 10 20 40 60 80 100
0.1
0.2
0.4
0.6
0.8
1
2
4
6
8
10
20
40
60
80
100
Concentration, g/m3 (mg/l)
HCl
Conductivity,µS/cm
H2SO4NaOHKOH
NaCl
NH2
CO2
Fig.1: The conductivity of various ions in water at different concentrations](https://image.slidesharecdn.com/water-treatment-150521102613-lva1-app6891/85/Water-treatment-12-320.jpg)
![1.3 Corrosion
1
CHAPTER
1.2.4 The pH value of water (degree of acidity)
The pH value of water expresses its degree of acidity, and for
ground water is normally determined by the temporary hard-
ness and the carbon dioxide content.
pH = 7 is equivalent to a neutral reaction, above pH 7 the
water is alkaline (basic), and below pH 7 it is acidic.
CO2-aggressive water (see the section on the hardness of
water) will have a pH value below 7, and has the adverse
property of corroding ordinary carbon steel, cast iron, hot-dip
galvanised steel and copper.
1.2.5 Other ions in water
Too much iron causes rust-coloured water and discolouration of
sanitary appliances. Too much potassium and the presence of
ammonium, nitrate and phosphate is usually a sign of organi-
cally-polluted water. Too little fluorine causes caries and too
much results in brown teeth. Too much chloride and partly also
sulphate gives a salty taste, and so on. If the composition of the
water fulfils the “WHO list” above, these inconveniences do not
occur.
1.2.6 Content of organic and inorganic substances
in water
Definition, organic substance: Substances that contain carbon
chemically bound to hydrogen. They often contain other ele-
ments (particularly O, N, halogens such as chlorine, or S). Organic
substances were once thought to be produced only by living
things. We now know that any organic substance can be synthe-
sised in the laboratory (although this can be extremely difficult
in practice).
Definition, inorganic substance: A substance that does not con-
tain carbon chemically bound to hydrogen. Carbonates, bicar-
bonates, carbides, and carbon oxides are considered inorganic
substance, even though they contain carbon.
Measuring organic substances: For water containing organic
substances, e.g. surface water, there are special methods for
measuring these.
One of the methods of measurement is called BOD (“Biological
Oxygen Demand”), which like the potassium permanganate
number [KMnO4] expresses the content of oxidable organic sub-
stances in the water.
The COD (“Chemical Oxygen Demand”) method of measure-
ment slightly resembles BOD, but differs in that it includes all
oxidable substances in the calculation.
Measuring inorganic substances: Water, surface water in partic-
ular, also contains varying quantities of suspended particles,
such as clay which can harbour plant residues and
microorganisms. The weight unit is as for organic substances
mg/l and is designated SS (Suspended Solids).
There are various ways of indicating organic and inorganic sub-
stances. One of these is SDI (Silt Density Index), which can re-
semble turbidity, which expresses the cloudiness of the
water caused by suspended, undissolved substances. The units
of measurement are called FTU (Formazin Turbidity Units) or NTU
(Nephelometric Turbidity Units).
If the water is discoloured, this can also be measured. The unit is
called mg Pt/l, and water discolouration is measured by compar-
ing a water sample with some known solutions of a platinum
compound (Pt is the chemical symbol for platinum).
Finally, in connection with polluted water, we have microorgan-
isms such as bacteria. A common measurement here is the num-
ber (germs) per 100 ml of water. WHO also specifies limits for
the number of different microorganisms in drinking water.
See Table 1.
The chemical composition of the water is not of particularly cru-
cial significance for the pump, except where it causes corrosion
or deposits, affecting a pump’s ability to function at a consistent
level of performance over a long period.
1.3 Corrosion
1.3.1 Introduction
Definition: Corrosion is usually defined as the deterioration of a
metal or its properties caused by a reaction with its environ-
ment. Most metals occur naturally in the form of oxides and are
usually chemically stable. When exposed to oxygen and other
oxidising agents, the refined metal will try to revert to its natu-
ral oxide state. In the case of iron, the oxides will be in the form
of ferrous or ferric oxide, commonly known as rust.
Metallic corrosion generally involves the loss of metal at a par-
ticular location on an exposed surface. Corrosion occurs in
various forms ranging from a generalised attack over the entire
surface to a severe concentrated attack. In most cases, it is im-
possible or economically impractical to completely arrest the
corrosion process; however, it is usually possible to control the
process to acceptable levels.
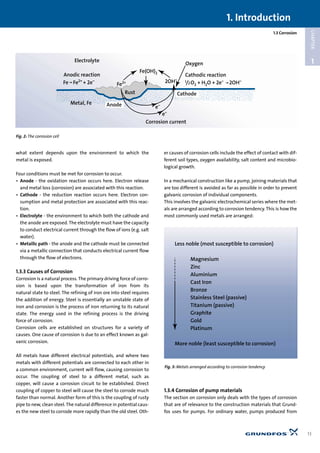
1.3.2 The corrosion cell
Metallic corrosion is caused by the flow of direct current from
one part of the metal surface to another. This flow of direct cur-
rent causes the loss of metal at the point where current dis-
charges into the environment (oxidation or anodic reaction).
Protection occurs at the point where current returns to the
metal surface (reduction or cathodic reaction). The rate of cor-
rosion is proportional to the magnitude of the corrosion cur-
rent. One ampere of direct current removes approximately ten
kilograms of steel in one year. Where corrosion occurs and to
1. Introduction
12](https://image.slidesharecdn.com/water-treatment-150521102613-lva1-app6891/85/Water-treatment-13-320.jpg)
![1.3 Corrosion
1
CHAPTER
composites will generally be suitable. In instances where
process water, for example, may contain chemical solvents etc.,
however, composite components could also be attacked.
Corrosion of the following materials is described below:
• Cast iron
• Bronze
• Stainless steel, types AISI 304, AISI 316 and 904 L.
• Titanium
Note: Several types of stainless steel are used, but in terms of
corrosion they can be grouped with the types above.
The following parameters may influence corrosion of pumps in
ordinary water:
• Aggressive carbon dioxide [CO2]
• Aggressive ions (particularly chloride, [Cl-])
• Free chlorine [Cl2]
• Oxygen [O2]
• Acidity [pH]
• Hydrogen sulphide [H2S]
• Temperature
Cast iron: With cast iron, which is the most vulnerable of the
above-mentioned materials, the pH value of the water will
affect its corrosion resistance. It is normally recommended not
to use cast iron with pH values below 6.5. The presence of
aggressive carbon dioxide will cause problems for cast iron,
while other pump materials will not be affected. Nevertheless
cast-iron pumps are used, giving satisfactory results, in ground
water and rainwater with a pH value as low as 5.
In these cases resistance will be determined by temperature,
water composition and operating conditions for the specific ap-
plication. The risk of discolouration, caused by iron contamina-
tion, will be greater, however.
Cast iron is very widespread for applications in ground water,
and it is suitable in most instances. Even though corrosion will
occur in a cast-iron pump, it is generally acceptable, provided
the rate of corrosion remains at a suitably low level.
Usually corrosion of less than 0.5 mm/year will be acceptable
provided a corrosion allowance of several millimetres of
material thickness is taken into account. In brackish water
and sea water, however, the corrosion resistance of cast iron will
be limited.
Surface coating is also applied to cast iron, but this sets high re-
quirements with regard to both the quality of the coating, which
must be free of porosity, and the handling of the pumps, to
avoid damage to the coating.
Bronze: Bronze is generally a better material than cast iron and
can be used for ground water, brackish water and salt
water. However, with bronze, as with cast iron, one must be
aware of the water treatment processes that involve cleaning
with various chemicals.
Cleaning with acids in particular is the most critical. With bronze
specifically there is also a risk of corrosion attack if it comes into
contact with ammonia compounds.
For the aforementioned reasons, the use of cast iron or bronze
pumps for membrane filtration is prohibited, so the choice will
usually come down to stainless steel or titanium.
For water treatment, therefore, most pumps supplied by Grund-
fos will be different grades of stainless steel and titanium.
Stainless steel: The term stainless steel covers a wide range of
iron-based alloys with a variable content of chromium,
nickel and molybdenum primarily, but also nitrogen and
copper etc. This yields materials very diverse in mechanical
properties and in corrosion resistance.
One common feature of stainless steel, however, is that the cor-
rosion resistance depends on the formation of an invisible oxide
film (passive film) on the surface. To achieve this the chromium
content must be at least 12%.
If this passive film breaks down locally and is not re-formed im-
mediately, localised corrosion (pitting) may occur. See Fig. 4a.
Similarly localised corrosion (crevice corrosion) may occur in
crevices and under deposits where there is insufficient oxygen
to maintain the passive film. See Fig. 4b.
The propagation of localised corrosion is fairly unpredictable,
and it cannot be calculated using a corrosion allowance in the
same way as uniform corrosion.
Table 4 shows a range of the stainless steel grades that Grundfos
uses for manufacturing pumps. The table shows the content of
1. Introduction
14
Fig. 4a: Picture showing pitting on a stainless steel component](https://image.slidesharecdn.com/water-treatment-150521102613-lva1-app6891/85/Water-treatment-15-320.jpg)
![1.3 Corrosion
1
CHAPTER
principal alloying elements (chromium [Cr.], nickel [Ni] and
molybdenum [Mo]) and the nitrogen [N] content.
The right-hand column gives the PRE value (Pitting Resistance
Equivalent), which is used to rank the resistance of various stain-
less steels to “pitting”(localised corrosion).
The PRE value is calculated according to the formula: Weight %
Cr + 3.3 x weight % Mo +16 x weight % N.
Stainless steel with a PRE value above 40 is considered to be re-
sistant to sea water up to 30°C.
However, Grundfos produces pumps from AISI 904 L for use in
sea water despite the fact that the PRE value - which also ap-
pears in the table above - is below 40. This is due to the fact that
operating conditions have a great influence on the corrosion re-
sistance of stainless steel in sea water. If certain procedures are
observed, including avoiding long shutdown periods and per-
forming regular flushing with fresh water, AISI 904 L can also be
used in salt water at moderate temperatures.
Grundfos uses diagrams like Fig. 5 as an aid for material
selection. The diagrams are based on experience with the
various stainless steels in ground water, brackish water and sea
water respectively.
The following are rules of thumb:
• 500 mg/l chloride is designated the maximum limit for
ground water
• 500 – 5000 mg/l chloride is designated brackish water, and
• over 5000 mg/l chloride is designated sea water.
However, sea water typically has a content of around 20,000 –
30,000 mg/l chloride (approx. 3.3 – 5% NaCl).
The relation between chloride content and % sodium chloride
[NaCl] is as follows:
NaCl % x 6100 = mg/l chloride [Cl-]
The diagram Fig. 5 shows maximum application temperatures
for various types of stainless steel and titanium in relation to
specific chloride content.
Titanium: Unlike stainless steel, titanium is very corrosion
resistant in chloride-containing environments.
The oxide film (passive film) on titanium is not attacked by chlo-
rides in the same way as the oxide film on stainless steel, and ti-
tanium can be used in sea water up to 80°C with no risk of pit-
ting and crevice corrosion.
1. Introduction
15
AISI W.-Nr. Cr. Ni Mo N PRE
431 1.4057 17 2 - - 17
304 1.4301 18 9 - - 18
316 1.4401 17 12 2.3 - 24.6
316 L 1.4435 17 14 2.8 - 26.2
329 1.4460 26 5 1.4 - 30.6
*)SAF2205 1.4462 22 5.5 3.0 0.1 34.2
904 L 1.4539 20 25 4.5 - 34.9
*)254 SMO 1.4547 20 18 6.1 0.2 43.3
0
10
20
30
40
50
60
70
80
90
100
2000 4000 6000 8000 12000 16000 20000
Chloride (mg/l)
AISI 904L
AISI 316
AISI 304
Titanium
C
Table 4: Stainless steel grades with alloy elements [w%] and PRE values
Fig. 4b: Picture showing crevice corrosion on a stainless steel flange used
in fish farming in Norway. Pumped liquid: sea water.
Fig. 5: Corrosion diagrams for AISI 304, AISI 316, AISI 904 L and titanium
*) Has no AISI specification, but is known by the stated designation.](https://image.slidesharecdn.com/water-treatment-150521102613-lva1-app6891/85/Water-treatment-16-320.jpg)

![2.1 Introduction
This section primarily deals with drinking-water purification, as
aeration and sand filtration are the most common methods for
purification of drinking water.
Drinking water comes from two sources:
• ground water, and
• surface water.
Table 5 below shows the proportion of ground water in the
drinking-water supply of various countries in Europe. Ground
water is clearly the primary drinking-water source.
A major explanation for this is the very widespread pollution of
many of the earth’s lakes and watercourses, that if of surface
water. At a ground water well, however, you bring up ground
water, which over many years has been filtered and purified in a
natural way by passage down through the soil layers. As ground
water is “prepurified” in this way the treatment is much less
complicated than treatment of surface water.
In certain desert regions, where for good reasons no new ground
water is formed, you can nevertheless fetch up water from un-
derground. Submersible pumps bring up 1000-year-old water
(fossil water).
2.2 Ground water
2.2.1 Introduction
To obtain ground water a borehole is drilled through the soil
layers until the layer is reached from which the ground water
can be extracted. A casing is inserted into the borehole to
ensure that it does not collapse. A well screen, consisting of a
slotted plastic tube surrounded by coarse sand and gravel (grav-
elling/packing), is positioned in the water-bearing zone. The wa-
ter is normally pumped using a submersible pump. Piston
pumps have also been used in the past. The water is conveyed
from the borehole to the waterworks. Most waterworks have
several boreholes. A collection of boreholes is called a well site.
Very large waterworks have several well sites.
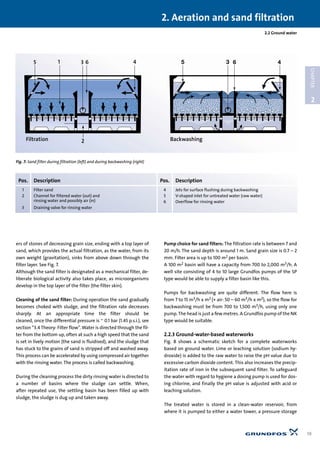
2.2.2 Treatment of ground water
In normal water treatment, first of all the iron, manganese and
any gases such as methane, hydrogen sulphide and aggressive
carbon dioxide are removed. In addition, oxygen is added to the
water. The process is called aeration.
2.2.2.1 Aeration
Once the water reaches the waterworks, aeration is the first
stage of the water treatment.
Ground water normally has a low oxygen content, or may be
oxygen-free. To achieve a good taste it must have a minimum of
5 mg oxygen/l. Aeration may proceed by allowing the water to
run freely from a sprinkler or down a cascade aerator. In this way
it absorbs oxygen from the air. Another option is injection of air
(by compressor) into the water. At newer waterworks pure oxy-
gen is sometimes injected.
During aeration (degasification) it is possible to remove any hy-
drogen sulphide [H2S], methane [CH4], ammonium [NH4
+] and
aggressive carbon dioxide [CO2], if the concentrations are not
too high. High concentrations require special methods. For in-
stance, the water would be treated with lime for high content of
aggressive carbon dioxide.
Aeration also assists in removal of iron and manganese. Dis-
solved iron and manganese compounds in the water react with
the oxygen to produce slightly soluble compounds that form
“flakes”in the reaction vessel positioned under the aeration sys-
tem. The iron compound is red (ferric oxide) and the manganese
compound is black (manganese dioxide). Both compounds are
subsequently “trapped”in the sand filter. With a high content of
iron and/or manganese two sand filters are used, one after the
other: A primary filter and a secondary filter.
2.2.2.2 Sand filtration
Sand filters, by far the simplest filter, are often constructed as
open concrete tanks or open basins, with the filter layer set up in
the bottom. A bar screen of reinforced concrete is covered by lay-
2.1 Introduction
2. Aeration and sand filtration
18
2
CHAPTER
2. Aeration and sand filtration
Country Proportion of groundwater
Belgium 67%
West Germany 64%
France 64%
Holland 59%
Sweden 25%
Switzerland 32%
Denmark 99%
Table 5: The proportion of ground water in the drinking-water supply](https://image.slidesharecdn.com/water-treatment-150521102613-lva1-app6891/85/Water-treatment-19-320.jpg)
![tank or direct out to the consumer using special pumping facili-
ties, such as a booster system.
Disinfection of waterworks’ water: Not all countries permit the
use of chlorine in drinking water. It often gives a noticeable taste
and smell. Chlorine is used in cities in particular, as the drinking
water is often extracted from surface water and/or comes from
far away. An alternative to disinfection of the water with chlo-
rine that is in use today is ozone treatment and irradiating the
water with UV light. See chapter “7. UV and Ozone”.
Pump choice for treated water: CR or NK type pumps, often sev-
eral in parallel with cascade operation. With water towers the
pumps are level-controlled, and with hydrophores they are pres-
sure-operated. In both cases one or more of the pumps may be
frequency-controlled.
Corrosion in ground-water-based waterworks: The content of
aggressive carbon dioxide in raw water means that it has a low
calcium [Ca++], magnesium [Mg++] and bicarbonate [HCO3
-]
content. In other words, the water is also soft. This type of
water can result in corrosion and the consequences are…
• solution of heavy metals in the drinking water.
• deterioration of the grid network and fittings.
At small waterworks the water is generally directed through ba-
sic filters that are closed tanks filled with granulated lime (e.g.
calcined dolomite). The aggressive water reacts with the lime
and forms bicarbonate in solution, and the pH value increases
slightly. The lime gets used up and the tank must be replenished
occasionally.
At large waterworks the lime is dosed as calcium hydroxide
[Ca(OH)2], either in dry form (powder) or in suspension (lime
milk), directly into the raw water.
2.2.4 Sand filter in closed tank
Private and small public waterworks use sand filters in closed
tanks instead of large, open concrete filters. Sand filters like this
are also called rapid filters or pressure filters. The principle is the
same: The tank has a sieve bottom covered with layers of gravel
and sand, following the same concept as for the open filters. See
Fig. 9. The raw water is directed in at the top and the filtered wa-
ter is taken out at the bottom of the tank. During backwashing
purified water (and possibly air) is directed in at the bottom of
the tank, and the dirty rinsing water conveyed out at the top. As
with the open filters, the first water after completion of the pu-
rification process is directed to the sewer. After a few minutes’
operation the water is ready for delivery to the clean-water
reservoir.
As the tank is closed it is possible to carry out the filtration un-
der normal mains pressure, and it is also possible to utilise filter
capacity better by continuing filtration up to a greater pressure
drop across the sand.
2.2 Ground water
2. Aeration and sand filtration
20
2
CHAPTER
7
8
1
4
5
6
9
11
10
13 14
32
12 15
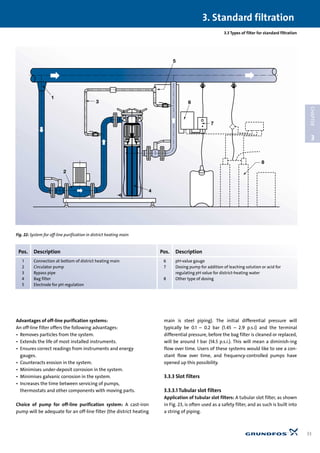
Fig. 8: Ground-water-based waterworks
Pos. Description Pos. Description
1 Borehole 9 Backwashing
2 Dosing pump 10 Compressor
3 Lime tank 11 Dosing pump
4 Cascade aerator 12 Chlorine tank
5 Reaction vessel 13 Clean-water reservoir
6 Settling basin 14 Clean-water pump
7 Sand filter, primary filtration 15 Water tower
8 Sand filter, secondary filtration](https://image.slidesharecdn.com/water-treatment-150521102613-lva1-app6891/85/Water-treatment-21-320.jpg)
![4) Addition of flocculation chemicals (coagulants) for coagula-
tion of colloidal particles in the raw water. The most
widely-used flocculation chemicals are aluminium sulphate
[Al2(SO4)], ferric chloride [FeCl3] and various polymers of or-
ganic origin. Without the addition of flocculation chemicals,
sedimentation of the colloidal particles would be practically
impossible. The table below shows the settling time in wa-
ter for some of the materials that are found in water.
The addition of the flocculating agents results in an increase
in the electrical cohesive attraction between the colloids, af-
ter which they form flocks, which in turn by means of mass
cohesive attraction agglomerate in even larger particles. An
explanation for the behaviour of the flocculating agents is
that, like the colloids, they are charged ions, but with oppo-
site charge, and therefore form a kind of cement between
the colloids (e.g. + – +), see section “8.5 Theory: Chemical
treatment”. The particles enlarged in this way subsequently
have an acceptable settling time (3 – 4 hours). This can also
be seen in Stoke’s Law. A modified version of this is shown
below:
The formula shows that the particle’s settling rate is propor-
tional to the square of the particle’s radius, which of course
is a great advantage seen in the light of the aforementioned
formation of flocs and lumps during flocculation.The floccu-
lation takes place during pH adjustment with the accompa-
nying dosing equipment.
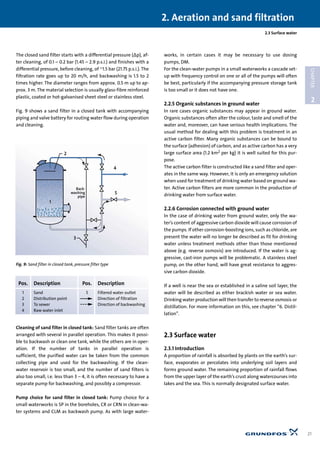
5) After vigorous stirring the water is directed to a settling
basin, possibly equipped with sludge scraper. Retention time
is 4 – 5 hours. These settling basins are also used within oth-
er variants of surface-water purification that combine chem-
ical mixing, flocculation and sedimentation in one assembly.
See Fig. 12.
6) Following precipitation further pH adjustment is performed
before the water is clarified in a sand filter system like the
type used for ground water treatment. See section “2.2
Ground water”.
7) Unlike ground water treatment, surface water always has a
disinfection process added in the final phase before the fin-
ished drinking water is pumped to the hydrophore or water
tower. It is also fairly common for the treatment to conclude
with flavour enhancement. This may involve dosing with
potassium permanganate [KMnO4], ozone [O3] or chlorine
dioxide [ClO2].
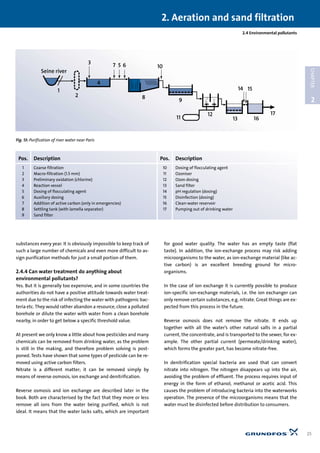
An overall schematic sketch of a system for purification of sur-
face water is shown in Fig. 13 The plant has a capacity of 3,800
m3/h and is located near Paris, obtaining its raw water from the
Seine. This is only one example. There are a large number of vari-
ants for purification systems for surface water.
Pump choice is as follows:
Raw water inlet: SP in the river or NK on land (possibly with
vacuum system for self-priming). Only
small lift to overcome any friction loss,
geometric difference of level and pressure
loss in the filter before the first basin.
Dosing: Unlike ground water systems, these have
several dosing points, and several of these
offer the option of dosing in liquid form
(using dosing pumps).
Clean-water system: Small plants - CR or CRN; large plants - NK.
Pumps in cascade layout, possibly with
frequency control on one or more of the
pumps. Pressure or level control.
2.4 Environmental pollutants
Over the last half century pollution of many of the world’s drink-
ing-water resources has increased so much that in numerous
places we have gradually become uneasy about drinking from
them.
In adition to pollution of the surface water by the chemical industry
in many places in the industrialised world, the intensive cultivation
of the land is also causing growing pollution of the ground water.
This is a question of pesticides and nitrate.
2.4 Environmental pollutants
2. Aeration and sand filtration
23
2
CHAPTER
Material Size in mm Settling time per m
Gravel 10 1 sec.
Coarse sand 1 10 sec.
Fine sand 0.1 125 sec.
Clay 0.01 108 min.
Bacteria 0.001 189 hours
Colloids 0.0001 755 days
Table 6: Settling time in water for selected materials](https://image.slidesharecdn.com/water-treatment-150521102613-lva1-app6891/85/Water-treatment-24-320.jpg)
![2.4.1 Pesticides and nitrate
Pesticides are crop sprays that are particularly used to combat
weeds, fungus and insects. There is a huge number of
these preparations, which are all chemical substances of widely
different types.
Nitrate [NO3
-] comes from fertiliser and is spread over the
fields in the form of various nitrogenous artificial fertilisers,
livestock manure and liquid manure.
A common feature of pesticides and nitrate is that they seep
with the rainwater down to the ground water. Some of the sub-
stances are broken down completely or partially on the journey
through the soil layers. Measurements have shown that rain-
water seeps down through the earth at approx. 1 m/year in clay
soil and approx. 3 m/year in sandy soil. Very deep wells are
therefore barely affected yet. Slightly shallower wells in agricul-
tural areas on light soils and small private wells in particular
are affected. Some private wells have been abandoned for sev-
eral years, and in recent years some medium-depth wells have
suffered the same fate.
2.4.2 Phosphate
When talking about nitrate, phosphate [PO4
---] should also be
mentioned, as it often occurs together with nitrate, in artificial
fertilisers, for instance. In addition, domestic detergents also
have a high phosphate content. However, phosphate is trans-
formed more quickly/easily than nitrate on the journey down
through the soil layers, and is therefore hardly ever present in
ground water. This is not the case with surface water. Here you
will find phosphate, which together with all the other sub-
stances finds its way via small watercourses and rivers out to the
sea, where they cause other kinds of pollution problems.
2.4.3 Localised pollution
Another source of water pollution is rubbish dumps, industrial
properties and petrol stations. This is called localised pollution
and can cause major problems in the delimited areas they
occur in. Here the range of “toxic substances” is even greater
than is the case with pesticides. On a worldwide scale it is
estimated that around 80,000 different chemicals are in
common use, and that the figure increases by 500 - 1000 new
2.4 Environmental pollutants
2. Aeration and sand filtration
24
2
CHAPTER
5
10
6
8
4
7
3
1
2
9
Fig. 12: Accelerator in which chemical mixing, flocculation and sedimentation take place.
Pos. Description Pos. Description Pos. Description
1 Sludge drainage 5 Addition of chemicals 9 Inlet
2 Outlet 6 Secondary zone 10 Stirrer
3 Drainage 7 Primary mixing and reaction zone
4 Concentrator 8 Clear water](https://image.slidesharecdn.com/water-treatment-150521102613-lva1-app6891/85/Water-treatment-25-320.jpg)

![3.1 Introduction
Standard filtration is a process in which solid particles are
separated from either a gas or a liquid. As the topic of this book
is water treatment, it only deals with particle separation in liq-
uids.
Standard filtration is dead end filtration. See section “5.2 Mem-
brane filtration is “cross-flow” filtration”.
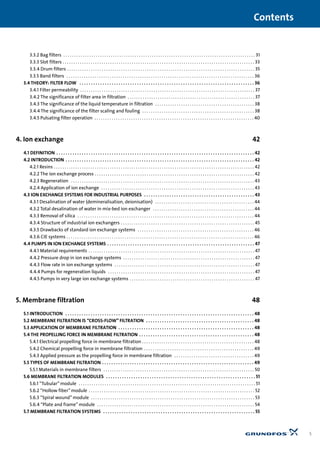
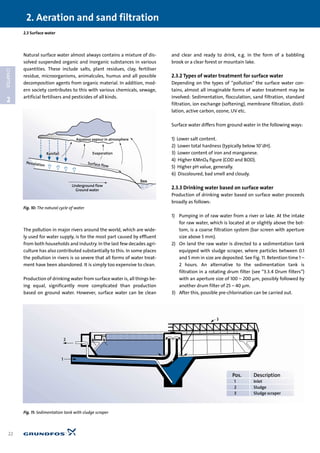
3.1.1 Filtration elements
Separation in filtration is of a mechanical nature, as solid parti-
cles are retained by a porous filtering medium that the liquid is
forced through. Driving pressure is required to “force” the liquid
through the filtering medium, i.e. the system needs a pump of a
certain size. In a few cases, where there is natural pressure in the
system, e.g. from gravitational force, a pump will not be needed.
For instance, if the supply is from a higher reservoir.
There are other methods for separating solid particles from
a liquid, e.g. sedimentation or distillation of the liquid. See chap-
ter “2. Aeration and sand filtration” and “6. Distillation”.
Washing off the filter cake and cleaning the filter: The advan-
tage of standard filtration is that the solid material (on the filter)
can be washed. After completion of filtration, flushing out of the
solid material is often required to either remove the original liq-
uid and/or flush out any “impurities”, using another liquid.
Many mechanical filters can be reused after having filled up
with solid material: The filter can be removed and washed, or
backwashing can be carried out with the filtering medium still
in place. The latter is called “Cleaning In Place” (CIP). Smaller
types of filter, cartridge filters, are often disposable, i.e. they are
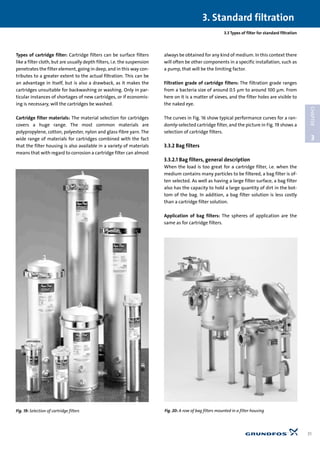
replaced with a new one once blocked.
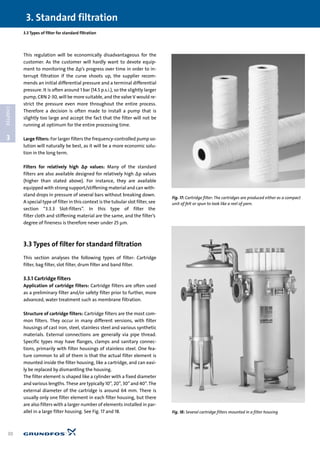
3.1.2 Types of filter
Filters can be divided into pressure filters (enclosed filters),
where the liquid is forced through the filtering medium by
means of pump pressure, and open filters, where the liquid
passes down through the filter mass using gravity or a vacuum.
In open filters the pump requirement will typically be reduced to
simple transport of the liquid. The table below includes exam-
ples of both types of filter.
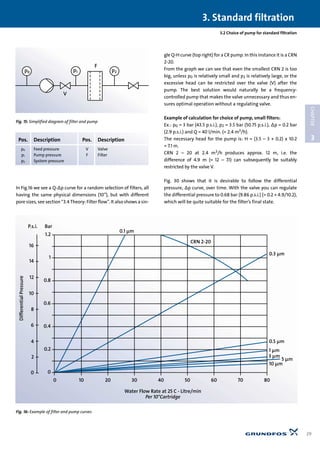
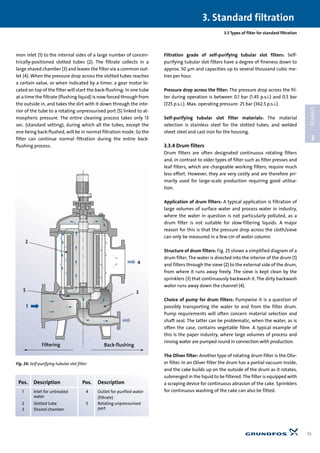
3.2 Choice of pump for standard
filtration
When choosing a pump for a filtration system, start with the fil-
ter supplier’s requirements regarding initial differential pressure
and terminal differential pressure, i.e. pressure before and after
the filter (∆p) with new and used filters respectively.
Filter suppliers emphasise that the user should not burden the
filter too heavily right from the start (See section “3.4 Theory:
Filter flow”), and consequently often give a max. initial value for
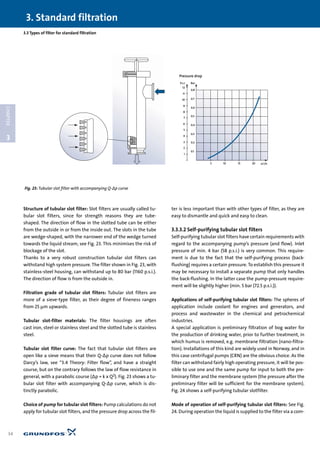
∆p. This value is typically 0.1 to 0.3 bar (1.45 – 4.35 p.s.i.).
Fig. 15 shows a simplified diagram of a specific filter and a pump.
The pump in the example will produce a head that can be ex-
pressed by the formula: H = (p2 – p0 + ∆p) x 10.2 [m].
3.1 Introduction
3. Standard filtration
28
3
CHAPTER
3. Standard filtration
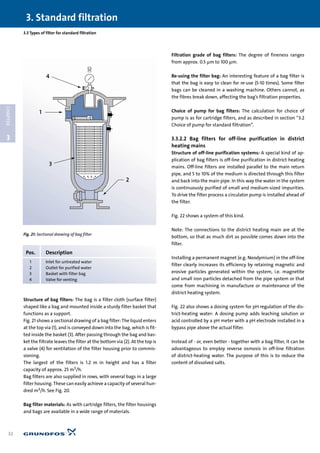
1 2 3 4
Fig. 14: Filtration elements
Pos. Description
1 Liquid with suspension
2 Filter deposits (filter cake)
3 Filter (filtering medium)
4 Purified liquid (filtrate)
Pressure filters Open filters
Bag filters Band filters
Cartidge filters Drum filters
Centrifugal filters Nutsche filters
Filter presses Sand filters
Leaf filters
Sand filters
Slot filters
Table 7: Examples of pressure filters and open filters](https://image.slidesharecdn.com/water-treatment-150521102613-lva1-app6891/85/Water-treatment-29-320.jpg)
![3.3.5 Band filters
Band filters of the nutsche type are often used as pre-filtration
for other types of water treatment, e.g. reverse osmosis and
nano-filtration. Band filters only filter by gravitation, as the liq-
uid level above the filter cloth is sufficient to maintain the nec-
essary pressure drop across the cloth. When the liquid level
above the cloth gets too high the filter cloth rolls forward
slightly, new cloth comes into operation and the liquid level
falls. This automatic forward movement of the cloth is con-
trolled by a simple float function via a microswitch for the pro-
pelling motor.
The filter cloth is made from synthetic fibres in many variants
and is suitable for almost all possible forms of liquid. It is shaped
like a roll of paper and is positioned in one end of the filter de-
vice. During operation it rolls across a strainer to the other end
of the device, where the dirt is scraped off, and finally the cloth
is rolled up like used “paper”on another roll.
The material selection in band filters is AISI 304.
Capacities range from ~0 to 500 l/min per unit. The filtration
grade goes down to 10 µm.
In addition to the aforementioned application in membrane fil-
tration, band filters are also used for treatment of cleaning wa-
ter in the food processing industry, chemical industry, car wash-
ing plants, spray booths, tanning industry, plastics industry and
filtration/recycling of cutting coolant at plants carrying out ma-
chining/cutting.
Choice of pump for band filters: The pumps are usually immers-
ible pumps of the SPK or CRK type designed to operate in appli-
cations with abrasive particles.
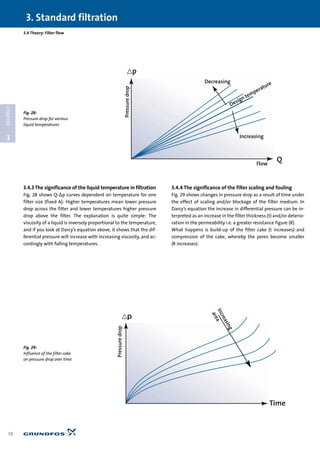
3.4 Theory: Filter flow
This section explains the following:
• filter permeability
• the significance of the filter area in filtration
• the significance of the liquid temperature in filtration
• the significance of the filter scaling and fouling
• pulsating filter operation.
During a filtration process the liquid will flow through the filter
cake and filter cloth, through more or less fine pores, and you can
therefore assume that the liquid flow is laminar and follows the
general equation (Poiseuille’s) for laminar flow. The formula is a
general one and can be used for many other types of filtration.
Where:
∆p = pressure drop across the filter [N/m2]
L = the porous channel lengths through the filter [m]
k = a proportionality factor
V = the liquid’s linear speed in the channels [m/s]
= the liquid’s dynamic viscosity [kg/ms]
D = pore diameter (hydraulic diameter) [m]
3.4 Theory: Filter flow
3. Standard filtration
36
3
CHAPTER
Fig. 26: Central system with two bands, holding tank, cooling system
and pumps
3
2 4
1
Pos. Description Pos. Description
1 Inside of drum 4 Channel for dirty
2 Sieve backwash water
3 Sprinklers
Fig. 25: Schematic sketch of drum filter](https://image.slidesharecdn.com/water-treatment-150521102613-lva1-app6891/85/Water-treatment-37-320.jpg)
![3.4.1 Filter permeability
Some of these parameters are obviously difficult to measure.
Therefore a more practical and common way of describing the
phenomenon is by using the term “filter permeability”, which
expresses the filter’s ability to transport the liquid through it.
High permeability means easy passage for the liquid and low
permeability means difficult passage for the liquid (great resist-
ance).
According to Darcy’s law this interrelationship can be expressed
as follows:
Where:
∆p = pressure drop across the filter [N/m2]
␣ = the permeability coefficient
(1/␣ is the filter’s resistance figure, often designated R)
Q = flow through the filter [m3/s]
= the liquid’s dynamic viscosity [kg/ms]
t = the filter thickness [m]
A = the filter area [m2].
If you look through brochure material for standard filters, you
will find this formula in an even more simplified version or
merely depicted as simple curves corresponding to installation
characteristics in Q-H curves. The curves are related to individual
types of filter with curve variants as a result of:
1. Filter size (area).
2. Liquid temperature.
3. Time for or degree of contamination.
Note: Contamination depends on the composition of the feed
(suspension) to the filter and the resulting build-up of the fil-
ter cake and/or blockage of the actual filtering medium.
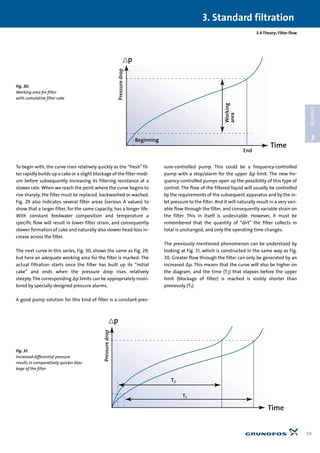
3.4.2 The significance of the filter area in filtration
Fig. 27 shows a typical course for a filter curve. One curve for
each area size (A). Note that the curves consist of straight lines,
unlike pipe characteristics, for example, which are arc-shaped
curves (parabola). The reason for this is that the transport of liq-
uid, as mentioned, is through fairly narrow channels, resulting
in laminar flow. The Poiseuille equation, and therefore also Dar-
cy’s law, indicate precisely the equation for a straight line when
␣, A, and t remain constant. R (1/␣) will thus be the line’s slope.
The straight lines in Fig. 27 actually only indicate the filter’s ini-
tial state, i.e. the filter’s Q-∆p curve when starting with a “fresh”
filter. In other words, before deposits begin to build up. The
curves will be true over time, if, for example, the water to the fil-
ter is pure and at a constant temperature the entire time.
3.4 Theory: Filter flow
3. Standard filtration
37
3
CHAPTER
Pressuredrop
Flow
Q
< p
Increasing
area
Fig. 27:
Pressure drop for various
filter areas
Note: The pore diameter
is constant](https://image.slidesharecdn.com/water-treatment-150521102613-lva1-app6891/85/Water-treatment-38-320.jpg)

![4. Ion exchange
42
4
CHAPTER
4.1 Definition
4.1 Definition
Ion exchange is a reversible process in which ions are released
from an insoluble permanent material (resin) in exchange for
other ions in a surrounding solution; the direction of the ex-
change depends upon the affinities of the ion exchanger for the
ions present, and the concentrations of the ions in the solution.
4.2 Introduction
Even though the principles of ion exchange were discovered and
investigated more than 125 years ago and were first used com-
mercially for conditioning of water around 95 years ago (1905),
proper application only really got going within the last half of
the century. Many natural materials display the ability to ex-
change ions. These include green sand, clay, sulphonated carbon
and peat.
Natural soils contain solids with charged sites that exchange
ions, and certain minerals called zeolites are quite good
exchangers.
Ion exchange also takes place in living materials because cell
walls, cell membranes, and other structures have charges. In nat-
ural water and in wastewater, there are often undesirable ions
and some of them may be worth recovering. For example, cadmi-
um ion is dangerous to health but is not usually present in con-
centrations that would justify recovery. On the other hand, silver
ions in photographic waste are not a serious hazard, but their val-
ue is quite high. In either case, it makes sense to substitute an ion
such as sodium for the ion in the wastewater.
However, it was only in 1944, when D’Alelio developed the first
synthetic ion exchange materials (resins), that modern use of
ion exchange really picked up.
4.2.1 Resins
Resin beads are formed by suspension polymerisation of
styrene and divinyl benzene as a cross-linking reagent with an
organic peroxide catalyst. Beads 0.5 to 2 mm diameter are
formed in this manner. The ion exchange sites are introduced
into the beads by a further chemical reaction stage.
The resin is contained in a tank or vessel, see Fig. 34, equipped
with valves, piping and other components necessary for proper
operation. These vessels are commonly referred to as columns.
Depending on the type, the raw water is directed through the
vessel either from above and down, from the bottom and up or
from the middle up and down. Once the resin’s capacity has
been exhausted (saturated), the activity of the resin has to
be restored (regenerated) before reuse. See section “4.2.3 Regen-
eration”.
4.2.2 The ion exchange process
In water treatment this process adds and removes ions from wa-
ter. In general the resin is used as the exchange site. The resin
is permanently charged and attracts ions of the opposite
charge. Each ion in the water has a different affinity for the
resin. Those with greater affinity will replace those with less
affinity.
Resins are basically classified as either cationic or anionic. See
Fig. 33. The choice of resin for a particular application will
depend on the ion or ions to be removed and recovered, and the
chemistry of the process.
The anion resin exchanges anions in solution for other anions
from the resin in the ion exchanger. In demineralisation, for
example, bicarbonate [HCO3
-], chloride [Cl-] and sulphate [SO4
--
] anions are removed from the solution in exchange for a chem-
ically equivalent number of hydroxide anions [OH-] from the an-
ion exchange resin. See Fig. 33.
Further in demineralisation, for example, calcium [Ca++], mag-
nesium [Mg++], sodium [Na+] and potassium [K+] anions are
removed and exchanged for a chemically equivalent number of
hydrogen cations [H+] from the cation exchange resin.
4. Ion exchange
Simple Ion-Exchange Reaction
Cation Resin Anion Resin
Na+
Ca2+
H+
NO3
-
SO4
2-
Cl-
CH-
H2O
Ion Exchange Bed
cation + anion resin
Mg2+
Fig. 33: The principle for demineralization in a double ion-exchange system](https://image.slidesharecdn.com/water-treatment-150521102613-lva1-app6891/85/Water-treatment-43-320.jpg)
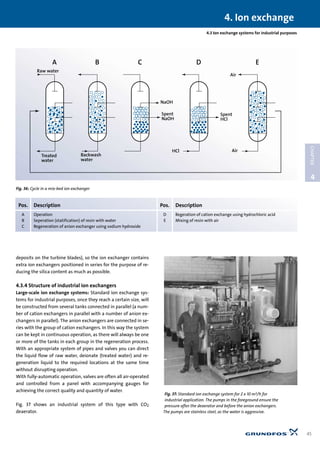
![4.3 Ion exchange systems for industrial purposes
The cation resin exchanges cations in solution for other cations
from the resin. See Fig. 33.
In softening, calcium [Ca++] and magnesium [Mg++] are re-
moved from a solution in exchange for a chemically equivalent
number of sodium anions [Na+] from the anion exchange resin.
4.2.3 Regeneration
Before reuse the resin must be regenerated using a solution con-
taining the ion initially present in the resin. The basic
operating cycle consists of:
• Service cycle: The solution to be treated is passed through the
column until the resin is saturated.
• Backwash cycle: Water is flushed through the column in
reverse direction to the service cycle to redistribute the
resin.
• Regeneration cycle: A solution rich in hydrogen ions [H+] (or
[Na+] in case of softening) such as 10% hydrochloric acid [HCl]
or 4% sulphuric acid [H2SO4] is passed through the cation
resin. The concentration of hydrogen ions in the acid solution
is high enough to force any other cations off the
resin in preference for the hydrogen ions. The anion resin is
treated with 5% sodium hydroxide [NaOH] so that its ex-
change sites are loaded with hydroxyl ions [OH-]. The direction
of flow is generally in reverse of the service cycle.
• Rinse cycle: Water is passed through the exchanger to remove
excess regenerant.
4.2.4 Application of ion exchange
Ion exchange is widely used today…
• for softening of water (calcium and magnesium are replaced
with sodium)
• for the production of demineralised (deionised) water (such as
feedwater for high-pressure boilers)
• for production of pharmaceutical products
• for purification of chemicals
• in analytical chemistry
• for process water in general.
In rare cases ion exchange is used for treatment (softening) of
drinking water.
For softening only cation exchange is used, whereas for dem-
ineralisation both cation and anion exchange is used.
Using a suitable combination of softening, cation and anion ex-
changer and degasification of carbon dioxide an extremely high
degree of purity can be achieved for the purified water. Mea-
sured by the water’s conductivity, it can be as low as 0.1 µS/cm.
As the ion exchange resin, as mentioned, becomes saturated
and must be regenerated now and again, ion exchange is not
suitable for desalination of water with a high content of salts, as
is the case with brackish water and sea water. In such
cases reverse osmosis and distillation will be used.
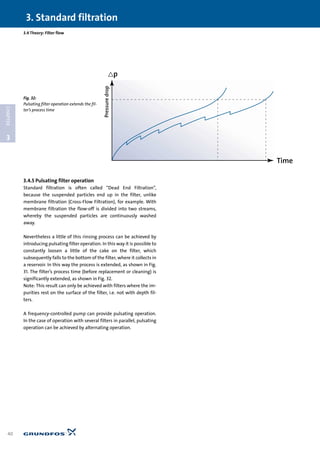
4.3 ion exchange systems for industrial
purposes
Two-bed systems consist of two separate pressure vessels; one
holding the cation resin, and the other holding the anion resin.
This design results in longer service between regenerations, and
simpler operation. Installed in multiple units, two-bed systems
can provide continuous service without down-time for regener-
ation. When one system is regenerating, the others can provide
100% of the required flow.
4. Ion exchange
43
4
CHAPTER
4
7
1
6
8
5
2
3
Fig. 34: Standard ion exchange vessel
Pos. Description
1 Vessel
2 Inlet for raw water
3 Outlet for treated water
4 Raw water distribution unit
5 Collection conduit for treated water
6 Inlet for regeneration liquid
7 ion exchange resin
8 Base (gravel)](https://image.slidesharecdn.com/water-treatment-150521102613-lva1-app6891/85/Water-treatment-44-320.jpg)
![The installation of mixed-bed ion exchange units after two-bed
systems also increases system capacity and further raises
water purity. See section “4.3.2 Total desalination of water in
mix-bed ion exchanger”.
Standard packaged deionizers are supplied with either
manual or automatic regeneration controls. Standard packaged
deionizers are skid-mounted, fully assembled and include the
necessary piping and valves to begin immediate operation.
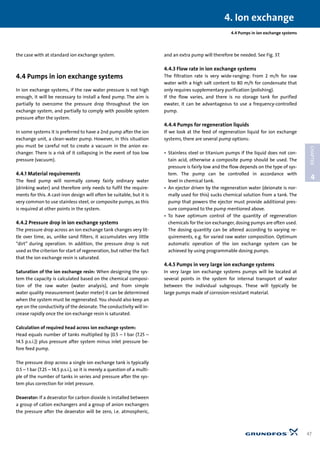
4.3.1 Total desalination of water (demineralisation,
deionisation)
The most common purpose of the application of ion exchange is
desalination of water containing not too large a quantity of
salts, e.g. production of boiler feed water from drinking water.
The schematic sketch in Fig. 35 shows this type of system with a
deaerator for carbon dioxide positioned between the cation and
anion exchanger. The carbon dioxide is released in
the acidic environment in the cation exchanger and is subse-
quently degassed so that the anion exchanger is not unduly over-
loaded. From the boxes on the sketch you can see the chemical
sequences involved in the process. The result is pure, desalinat-
ed water [H2O]. It can produce demineralised water with a con-
ductivity of less than 0.1 µS/cm.
For comparison with this, drinking water typically has a conduc-
tivity of 100 – 800 µS/cm and sea water a conductivity of 50,000
µS/cm.
4.3.2 Total desalination of water in mix-bed ion
exchanger
Total desalination can also take place in mix-bed ion exchang-
ers. Here both a cation exchanger and an anion exchanger are
incorporated into the same tank. During operation the two
ion exchange resins are mixed, but before regeneration
takes place they are separated, and each regenerated with their
own chemical reagent. Separation is performed by
directing water in at the bottom of the tank at such a rate that
the ion exchange resin floats (fluidises). As the small ion
exchange beads differ in buoyancy, depending on whether they
are cation or anion exchangers, they will stratify into two
layers, and regeneration can now proceed by means of a
manifold (“split flow system”) centrally located in the tank. Be-
fore the tank begins normal operation again the cation and an-
ion exchangers are mixed by adding air at the bottom of the
tank. See Fig. 36.
4.3.3 Removal of silica
Silica [SiO2] has historically created problems for water treat-
ment because of its stability as an un-ionized compound, mak-
ing it difficult to remove using ion exchange processes. It can
even cause a certain level of resin fouling. As a result, silica can
only be effectively removed if the ion exchange resins are com-
pletely and properly regenerated.
For heavy-duty steam boilers for turbine operation the content
of silica [SiO2] is particularly critical (silica can form undesirable
4. Ion exchange
44
4
CHAPTER
4.3 Ion exchange systems for industrial purposes
Raw water
H-ex-
changer
Deaerator OH-ex-
changer
Ca(HCO3)2
Mg(HCO3)2
CaSO4
MgSO4
CaCl2
MgCl2
NaCl
SiO2
CaCl2
MgCl2
NaCl
H2CO3
H2SO4
HCl
SiO2
H2SO4
HCl
SiO2
H2O
Na2SO4
NaCl
Na2S4O3
HCl CO2 NaOH
Desalinated water
Fig. 35: Schematic sketch of a cation and anion exchanger with CO2 deaerator](https://image.slidesharecdn.com/water-treatment-150521102613-lva1-app6891/85/Water-treatment-45-320.jpg)
![Fig. 37: The system’s air-operated adjustment valves are partial-
ly hidden between the two rows of tanks. There are 12 fibre-glass
tanks in total with 4 valves each.
Very large ion exchangers: The very large ion exchange systems
can be equipped with a large number of parallel and series-con-
nected strong and weak cation exchangers, strong and weak an-
ion exchangers, deaerators and mix-bed ion exchangers, plus
traditional treatment of the raw water consisting of a variety of
mechanical filtration, flocculation and sedimentation.
This can result in demineralised water of a high quality:
• conductivity of 0.05 – 0.1 µS/cm
• a silica [SiO2] content of 5 – 55 µg/l, and
• a pH value of 7.
The capacity of large systems can be up to several hundred cubic
metres per hour.
4.3.5 Drawbacks of standard ion exchange systems
The aforementioned ion exchange processes have all involved
fixed resin and been intended for batch operation, i.e. the resin
remains in its tank during both operation and regeneration and
the tank is out of operation during the regeneration. The tank is
always designed as an upright cylindrical vessel. An ion ex-
changer of this type typically undergoes a cycle characterised as
follows: Service cycle, backwash cycle, regeneration and rinsing,
after which it returns to its starting point and is ready for a new
cycle.
An ion exchange system like this has several drawbacks:
• The need for large quantities of resin, particularly with
increasing content of salts in the raw water.
• Interruption of water production during regeneration.
• Complex regeneration process.
• High consumption of water for backwash and rinsing of ion
exchange resin.
Nevertheless these standard systems are the most common,
probably due to the price.
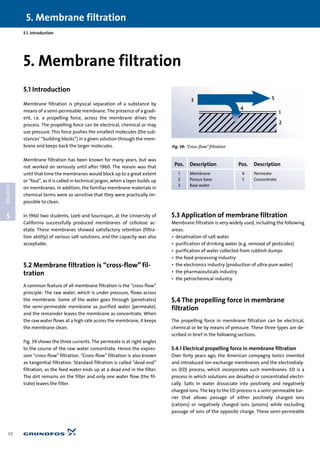
4.3.6 CIE systems
There are other types of ion exchange system that are capable of
performing the ion exchange process continuously, i.e. without
the aforementioned cycle. These systems are called CIE systems
(Continuous Ion Exchanger), and there are several variants avail-
able. The most simple are used for ion exchangers that only con-
tain one type of ion exchange resin. More complicated CIE sys-
tems are also produced, for example mix-bed ion exchangers.
Fig. 38 shows a CIE system with only one type of ion exchange
resin, also known as a “single exchanger”. The ion exchange
resin is regenerated in the tank on the right (8), where, during
fluidisation in countercurrent, it receives the regeneration liquid
from above via a pipe (5).
The regenerated resin is conveyed via a valve (4) into the
flushing tank (7), where an upward water flow rinses the ion
exchange resin clean of residue of regeneration liquid and
impurities. The contaminated rinsing water leaves the system
out above the large pipe (above 7). The ion exchange resin
subsequently “sinks” down past the ball (below 7) and ends up,
still fluidising, in the tank (6) where the actual ion exchange
takes place. In the tank (6) the resin settles in countercurrent
with the raw water, which is added to the system via a pipe (1).
Finally the resin is conveyed via a valve (3) back to its starting
point in the regeneration tank (8). The purified water (deionate)
is drawn off via a pipe (2).
To ensure that the CIE system’s extra sub-processes (fluidisa-
tion, liquid flow and separation) proceed satisfactorily, setting
up the system must be carried out with greater precision than is
4. Ion exchange
46
4
CHAPTER
4.3 Ion exchange systems for industrial purposes
1 3
2
5
4
8
7
6
Fig. 38: CIE system
Pos. Description
1 Inlet for raw water
2 Outlet for purified water
3 Valve for used ion exchange resin
4 Valve for regenerated resin
5 Inlet for regeneration liquid
6 Tank for ion exchange
7 Flushing tank
8 Tank for regeneration of ion exchange resin](https://image.slidesharecdn.com/water-treatment-150521102613-lva1-app6891/85/Water-treatment-47-320.jpg)
![The viscosity dependence is gone, and instead ∆π, which is the
difference in osmotic pressure on the feed water and the perme-
ate, appears. A is a constant.
The viscosity will naturally also have an effect on nano and re-
verse osmosis filtration, but this will only be reflected in the
pressure drop across the membrane, i.e. in the feed water – con-
centrate direction.
Retention of dissolved substances: Jw is the flux of the pure wa-
ter (water flux), which goes through the membrane, but a little
of the dissolved substance also goes through the membrane
with the water. In nano-filtration quite a lot of the dissolved
substance may go through with the water, while in reverse os-
mosis, which is a much denser membrane, only a little goes
through. Common salt [NaCl] is at around 50% with nano-
filtration and around 2% with reverse osmosis. This property is
called retention of dissolved substances or ions. Retention
(filtering ability) for various other substances is shown in Fig. 42
and 43.
It is by and large true that the membrane capacity (flux) for
nano and reverse osmosis filtration depends on the feed pres-
sure and the osmotic pressure in the solution and the retention
depends on physical conditions in the membrane (its density).
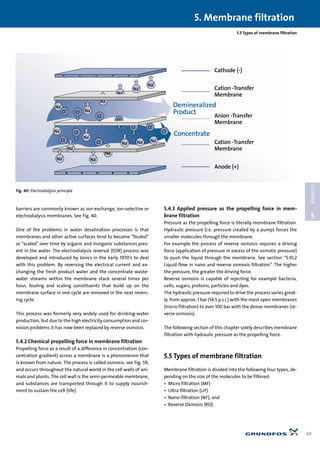
5.10.3 Technical specifications for filters
Technical specifications for a spiral module, see Fig. 60, (also
known as an element) for reverse osmosis will include the
following:
• Capacity in m3/24 hours
• Diameter and length
• Max. feed-water flow [m3/h]
• Max. operating pressure [bar]
• Max. operating temperature [°C]
• Max. tolerance to chlorine [mg/l]
• Max. turbidity in feed water [NTU]
• Max. undissolved substance in feed water [SDI]
• Membrane type
• Minimum salt retention in % measured in chloride [Cl-]
• pH value limits
• Type designation
• Typical salt retention in % measured in chloride [Cl-].
The technical specifications for a nano-filter’s membrane are of-
ten supplemented by information on retention of larger mole-
cules, such as sodium nitrate, calcium bicarbonate, magnesium
sulphate and glucose.
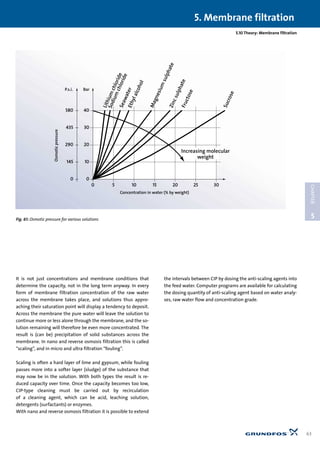
5.10.4 Membrane capacity
Fig. 61 shows curves for osmotic pressure for various solutions as
a function of the solution’s concentration. The “sea water”curve
is used for brackish and sea water.
Note that the osmotic pressure for salt water with 4% salt is ap-
prox. 25 bar (362.5 p.s.i.), i.e. the reverse osmosis system for sea
water only begins to produce water once the high-pressure
feed-water pump achieves a pressure of more than 25 bar (362.5
p.s.i.) (see above: Jw = A x (∆p – ∆π)).
Another factor that affects a membrane’s capacity is the tem-
perature dependence. The capacity increases with the tempera-
ture: 2 – 3% per degree (C). This is because the membrane opens
up with the temperature. It also results in poorer retention, and
therefore more salt in the treated water.
5. Membrane filtration
62
5
CHAPTER
5.10 Theory: Membrane filtration
Feed Brine (concentrate)
Permeate
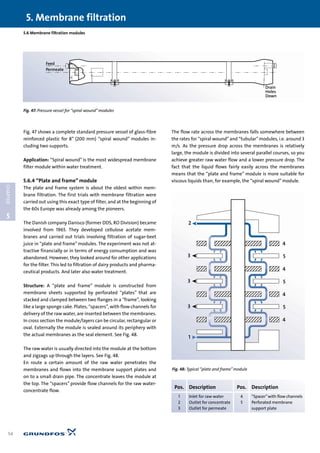
Fig. 60: Typical spiral module (element)](https://image.slidesharecdn.com/water-treatment-150521102613-lva1-app6891/85/Water-treatment-63-320.jpg)
![Where
Q is the quantity of heat [kWh (Kcal)]
is the time unit [hours]
U is the thermal transmittance
[KWh (Kcal) /m2 x h x °C]
A is the area of the heating surface [m2]
∆t is the temperature difference across
the heating surface [°C]
6.5.1 Schematic sketch of single-stage distillation system
6.5.2 Multi-effect distillation system, type MED
The number of stages for a specific distillation is determined on
the basis of the total temperature drop involved, i.e. the temper-
ature difference between the heating medium and the available
cooling medium divided by 7 – 10°C. Another aspect is the costs
connected to the number of stages. The initial costs increase al-
most in proportion to the number of stages, while the heat sav-
ing for each new stage becomes less and less.
See Fig. 66.
A MED plant produces 1 m3 drinking water using between
approx. 400 kWh (two stage model) and approx. 60 kWh (ten
stage model).
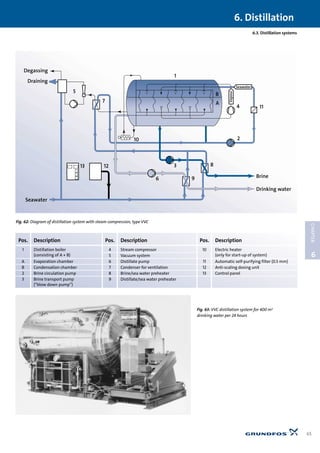
6.5.3 Distillation system with steam compression,
type VVC
It is different with distillation systems where mechanical
steam compression is used, see Fig. 67. A single-stage system
produces 1 m3 drinking water for approx. 11 kWh, and a three-
stage system produces 1 m3 for approx. 8 kWh. Distillation sys-
tems can achieve high levels of efficiency, equivalent to
reverse osmosis systems.
Mode of operation: See Fig. 67. The steam from the steam zone
(4) is compressed in the compressor (5), increasing the tempera-
ture of the steam. In the heat exchanger (6) the steam condens-
es at the same time as the brine is heated for boiling in the boil-
ing zone (3). The recirculation pump (2) recirculates a mixture of
brine and salt water (1). Drinking water is removed via a pipe (7),
and excess brine is removed via a pipe (8). The ratio between
drinking water and brine is typically one to one, i.e. the water
utilisation ratio is 50%.
The schematic sketch does not show all necessary pumps and
external heat exchangers. See these in Fig. 62.
6. Distillation
68
6
CHAPTER
6.5 Theory: Distillation
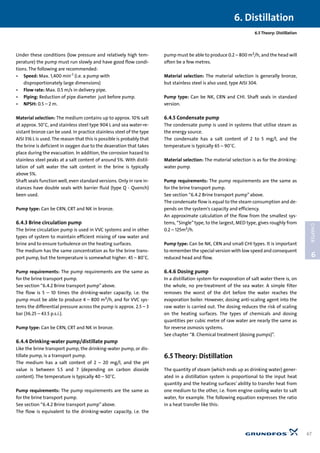
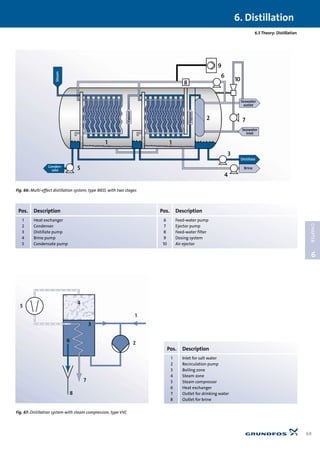
5
2
1
3
7
6
4
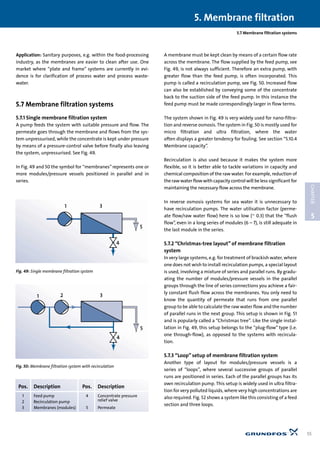
Fig. 65: Schematic sketch of single-stage distillation system.
Energy consumption: Approx. 750 kWh/m3 distillate
Pos. Description
1 Inlet for salt water
2 Salt water for evaporation
3 Excess of salt water
4 Drain for concentrated salt water (brine)
5 Drain for distillate (drinking water)
6 Input of heating medium
7 Outlet for non-condensable gases](https://image.slidesharecdn.com/water-treatment-150521102613-lva1-app6891/85/Water-treatment-69-320.jpg)
![7. UV and ozone
70
7
CHAPTER
7.1 Introduction
7.1 Introduction
UV refers to water treatment by means of irradiation with ultra-
violet light, and ozone refers to water treatment by dosing of O3
(ozone).
UV and ozone can be used for disinfection of water, i.e. to kill the
microorganisms that are present in almost all types of surface
water, and, in rarer cases, also in ground water.
The presence of microorganisms will generally impair the quali-
ty of the water. Drinking water may become undrinkable, even
directly toxic. UV is often used in combination with reverse os-
mosis and ion exchange for production of “ultra-pure water”for
use in the pharmaceutical industry, for example.
There are a number of different alternatives for disinfection of
water, such as ...
1. removal of microorganisms by filtration, e.g. micro filtration
and slow sand filtration.
2. inactivation of microorganisms by chemical means, e.g.
treatment with chlorine, chlorine dioxide and ozone.
3. inactivation of microorganisms by physical means, e.g. boil-
ing and UV irradiation.
Filtration through micro filters and sand filtration, pt. 1, and
dosing of chlorine and chlorine dioxide, pt. 2, are dealt with un-
der chapters 2, 3 ,5 and 8.
7.2 Water treatment with UV
The disinfecting effect of ultraviolet rays has been known since
1878, when sunlight’s bactericidal effect was discovered. 1910
saw the first attempt to use UV irradiation for disinfection of
water. It is currently being used in many places as time goes on,
but has never been able to outstrip the use of chlorine. One of
the reasons is that UV irradiation is short-acting, as an infection
of the water (e.g. due to unclean pipes) after irradiation with UV
renders the irradiation no longer effective. Chlorine, on the oth-
er hand, will remain in the water and be effective for a long time
after the dosing has taken place.
A major advantage of UV systems is low investment costs and a
single, inexpensive operation without the addition of chemicals.
Maintenance consists of cleaning fittings occasionally, and re-
placing the lamp roughly once a year.
7.3 Water treatment with ozone
Dosing of ozone [O3] in water was used for the first time in 1906.
The ozone is created in ozonisers, from where it is dosed and
mixed in the water. Ozone is very fast-acting. Compared with
chlorine it is roughly twice as effective in relation to the dosing
quantity. In addition to having an immediate bactericidal effect,
ozone also has a positive effect on the taste and smell of the wa-
ter, and a strong oxidising effect that increases the reaction rate
of many chemical processes in the water, e.g. in connection with
the presence of iron, manganese, humus and organic sub-
stances. The process must generally be followed up by filtration
due to deposited substances that cause the water to be cloudy.
Mode of operation for ozone system: From the ozoniser the
ozone is directed to a dosing system for mixing with the water
to be disinfected. As the ozone is in a gaseous state the most ef-
ficient way of adding it is as small bubbles (approx. 3 mm in di-
ameter) through a system of nozzles and then ensuring a long
residence time and/or good agitation in the water. Many tradi-
tional systems act in this way, but the most efficient method
has proved to be the use of the “U-tube”reactor.
7.4 Water treatment with both UV and
ozone
Finally, there is also a combination of UV and ozone. It has been
found that UV light from a mercury lamp with a light-wave
length of around 172 nm is capable of creating ozone (“FOTO-
ZON”). The UV light converts the water’s content of free
oxygen into ozone by photochemical means. The discovery of
this process is relatively recent (approx.1980) and it is not yet
very widely used. It is used, for example, to inhibit organic
growth in water tanks for animals (fish, seals and sea lions). It
may be possible to develop the process sufficiently to enable it
to compete with traditional ozonisers, which in relation to the
UV/ozone method are very expensive in initial cost.
7.5 UV systems
Fig. 68 shows a sectional drawing of a U-shaped UV irradiation
chamber with a UV lamp in each branch of the U-pipe. The actu-
al lamp is either like an ordinary fluorescent tube (low-pressure
mercury lamp), but without the fluorescent coating on the in-
ternal side of the tube, so the UV light escapes directly, or a
7. UV and ozone](https://image.slidesharecdn.com/water-treatment-150521102613-lva1-app6891/85/Water-treatment-71-320.jpg)
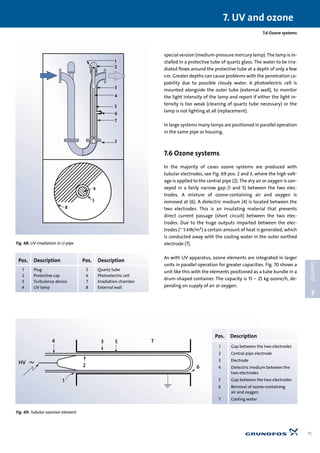
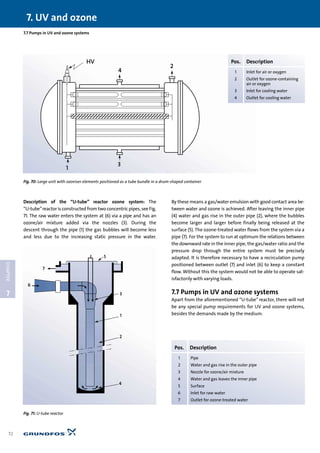
![7.8 Theory: UV and ozone
The pumps are usually transport pumps, as the drops in pressure
through the systems are slight.
If ozone residue is present in the water around rubber compo-
nents in the pump (including shaft seals) elastomers resistant to
ozone should be selected.
7.8 Theory: UV and ozone
7.8.1 Ultraviolet light
Ultraviolet light from an electric fluorescent tube with a wave-
length of 200 to 300 nm has a powerful destructive effect on
microorganisms. This effect peaks at approx. 260 nm, where the
organisms’ DNA molecules display the greatest absorption of
the ultraviolet light, see Fig. 72, UV-C.
The effect results from the fact that UV light (photons) destroys
the organisms’ DNA molecules, as it attacks the building blocks
(nucleic acid) in the molecule, deactivating the tissue cells and
halting the capacity for cell division.
7.8.2 Ozone
Ozone is an unstable gas created by the effect of oxygen in a
powerful electric field. By supplying a high voltage (up to 20 kV)
from a generator, an electric field (corona) is formed between
two electrodes, by which means dry oxygen [O2], which is
passed between the electrodes (plates), undergoes a partial sep-
aration into atoms [O] and almost immediately after combines
in threes to form ozone [O3].
The disinfecting influence is due to the fact that ozone (like
chlorine) has powerful oxidising properties that cause all organ-
ic material to decompose, including infectious bacteria.
The normal ozone dosage in drinking water is up to 0.4 g/m3,
and for river water up to 2 g/m3. With it the energy consumption
is significantly greater than with application of UV irradiation
(approx. 0.02 kWh/m3 water against approx. 0.001 for UV). How-
ever, ozone’s disinfecting properties are also much greater than
those of UV irradiation.
7. UV and ozone
73
7
CHAPTER
ionizing
radiation
cosmic
rays
optical
radiation
radio-
radiation
gamma
rays
x-rays
ultra
rays
light
infra-
red
radio
waves
wavelengthkmmmmµmnm
vacuum
UV
UV - C UV - B UV - A
visible light
100 200 280 315 400 800 nm
Fig. 72: The ultraviolet spectrum compared with other electromagnetic waves](https://image.slidesharecdn.com/water-treatment-150521102613-lva1-app6891/85/Water-treatment-74-320.jpg)
![8.1 Introduction
Most types of water treatment require some form of chemical
treatment in order to achieve the best possible quality of
water in the shortest possible treatment time. Therefore the
construction of chemical dosing systems, including handling,
storage and mixing of the chemicals, is extremely important. A
correctly-designed dosing system will be able to improve the ef-
fectiveness of a specific water treatment and thus assist in re-
duction of operation and maintenance expenses.
In principle three basic forms of chemicals are used: solid mat-
ter, liquid and gas. Dosing of chemicals in liquid state (dissolved
substance) is best, as it is more compact, more precise in the
dosing and easier to handle. In general dosing systems must be
able to handle a wide variation in capacity to enable it to live up
to the corresponding variation in the water treatment system’s
capacity and requirements for dosing of chemicals.
As this section only deals with the application of dosing pumps
in water treatment, focus will be on dosing of chemicals in a liq-
uid state (i.e. in solution).
Chemicals for water treatment systems, and especially when
the end product will be drinking water, must be pure and of a
quality that has been approved by the local health authorities.
In the case of dosing in wastewater the needs of the recipient
(watercourses and sea) are paramount, i.e. consideration for
plants and animals (protection of the environment).
Metering pump: In English-speaking countries the term “Meter-
ing pump”is often used for a dosing pump.
8.2 List of the most important chemicals
The list below shows some of the most important chemicals,
classified according to typical fields of application. The typical
concentration in aqueous solution for delivery is shown (max.
concentration).
8. Chemical treatment (dosing pumps)
74
8
CHAPTER
8.1 Introduction
8. Chemical treatment
(dosing pumps)
Coagulation and flocculation (precipitation):
Disinfectants:
Chemicals Typical concentration in water on delivery
Aluminium sulphate (alum), [Al2(SO4)3] 49%
Polyaluminiumchloride (PAC) 5 – 10%
Ferric chloride, [FeCl3] 35 – 45%
Iron sulphate, [Fe2(SO4)3] 59%
Cationic polymer (e.g. polydimethyl-diallyl-ammonium chloride) Up to 100%
Anionic polymer (e.g. polycarboxylates) Up to 100% (normally supplied as solid matter)
Noionic polymer (e.g. polyacrylamides) Up to 100% (normally supplied as solid matter)
Chemicals Typical concentration in water on delivery
Sodium hypochlorite, [NaClO] 15% (~7% active chlorine)
Sodium chlorite, [NaClO2] Approx. 30%
Ammonium sulphate, [(NH4)2SO4] 4% (normally supplied as solid matter)
Calcium hypochlorite, [Ca(ClO)2] Not suitable, as lime will deposit on valves in dosing pumps
Sodium hydrogensulphite, [NaHSO3] (preservation) 50% (removes oxygen and chlorine)
Quaternary ammonium compounds – (not relevant)
Diverse biocides (e.g. bromine compounds) – (not relevant)](https://image.slidesharecdn.com/water-treatment-150521102613-lva1-app6891/85/Water-treatment-75-320.jpg)
![8
CHAPTER
8. Chemical treatment (dosing pumps)
75
8.2 List of most important chemicals
pH control:
Taste and smell control:
Corrosion control:
Drinking-water improvement (health):
Algae control:
“Scaling” control:
Particularly for ion exchange:
Chemicals Typical concentration in water on delivery
Hydrated lime (calcium hydroxide), [Ca(OH)2] 20% (supplied as solid matter of 82 – 95%)
Soda lye (sodium hydroxide), [NaOH] 50% (or as solid matter of 100%)
Sodium carbonate, [Na2CO3] 10% (supplied as solid matter of 99%)
Sulphuric acid, [H2SO4] 62 – 93%
Hydrochloric acid, [HCl] 30% (often available with corrosion inhibitor)
Chemicals Typical concentration in water on delivery
Potassium permanganate, [KMnO4] approx. 5% (supplied as solid matter of 97 – 99%)
Chemicals Typical concentration in water on delivery
Zinc orthophosphate 8% as zinc
Soda lye (sodum hydroxide) [NaOH] 50% (or as solid matter of 100%)
Chemicals Typical concentration in water on delivery
Fluosilicic acid, [H2SiF6] 20 – 30%
Sodium fluoride, [NaF] approx. 4%
Sodium fluorosilicate, [Na2SiF6] 0.5 – 1%
Solution of sodium, potassium and iodate salts – (not relevant)
Chemicals Typical concentration in water on delivery
Copper sulphate, [CuSO4] 20%
Chemicals Typical concentration in water on delivery
Sodium hexametaphosphate, [NaPO3]6 67% as [P2O5] (particularly for RO and evaporation)
Trisodium phosphate, [Na3PO4] 25%
Chemicals Typical concentration in water on delivery
Sodium hydroxide 50% (or as solid matter of 100%)
Hydrochloric acid 30% (often available with corrosion inhibitor )
Salt (saturated NaCl-solution, brine) Approx. 30%](https://image.slidesharecdn.com/water-treatment-150521102613-lva1-app6891/85/Water-treatment-76-320.jpg)
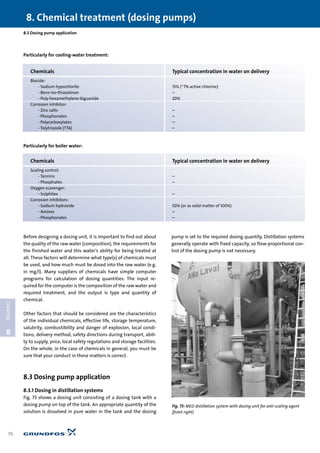
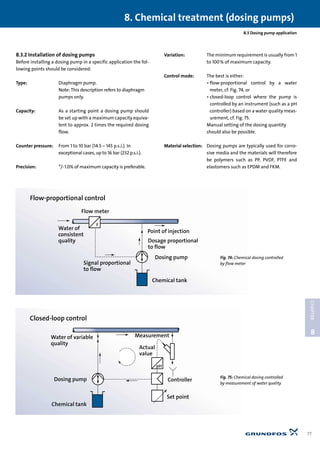
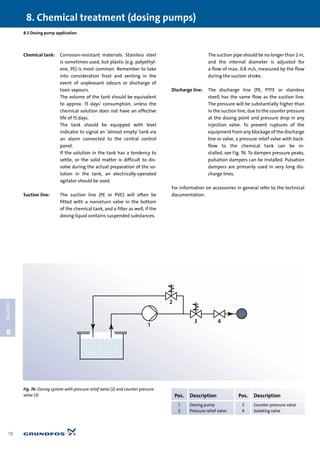
![8.4 Sample calculation
8.4 Sample calculation
A customer has a water treatment system in which he wishes to
dose 10 mg soda lye/l in a pipeline with a flow of 6 m3/h and sys-
tem pressure of 4 bar (58 p.s.i.). His dosing solution of soda lye
[NaOH] must be a 25% solution.
Which dosing pump should we offer him?
In a 25% [NaOH] solution there is approx. 25 g [NaOH]/100 ml =
250 mg [NaOH]/ml. In 6 m3 water with 10 mg [NaOH]/l there is
in total: 6000 x 10 = 60,000 mg [NaOH].
In one minute the quantity dosed must be: 60,000 / 60 = 1,000
mg [NaOH] equivalent to 1,000 / 250 = 4.0 ml [NaOH] solution,
i.e. the dosing pump must supply 4.0 ml/min (0.24 l/h).
An appropriate choice of dosing pump could be a Grundfos type
DME 2 – 18, which has a setting range between 0.0025 and 2.5
l/h. To avoid uncontrolled overdosing the pump’s maximum out-
put can be restricted electronically, to 0.5 l/h, for example,
whereby the pump will be customised for this precise applica-
tion.
If the water treatment system is fitted with a flow meter, with
either a pulse or an analog signal (4 – 20 mA), in the pipeline
where the dosing is to be performed, the dosing pump can be set
so that the dosing quantity is always flow-proportional. The
same applies if a similar signal from an instrument controlling
the quality of the treated water (e.g. pH) is used. In both cases
the dosing pump must nevertheless be dimensioned as shown
above.
The materials PP and EPDM are suitable for a 25% sodium hy-
droxide solution.
Discharge and suction tubing of PE and PVC are also suitable. At
temperatures above 40°C PTFE or stainless steel should be used.
The question of material resistance in a dosing pump should be
dealt with by means of a material resistance list.
The correct choice of material is crucial to avoid pump failure.
8. Chemical treatment (dosing pumps)
79
8
CHAPTER
Fig. 77: Dosing of base for pH control of the water in district heating system and boiler](https://image.slidesharecdn.com/water-treatment-150521102613-lva1-app6891/85/Water-treatment-80-320.jpg)
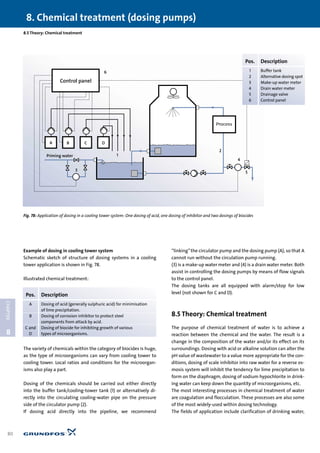
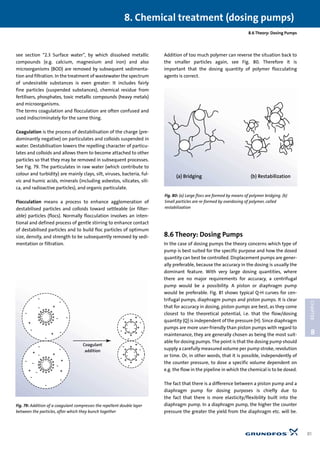
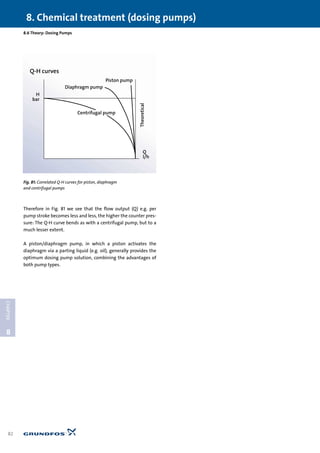

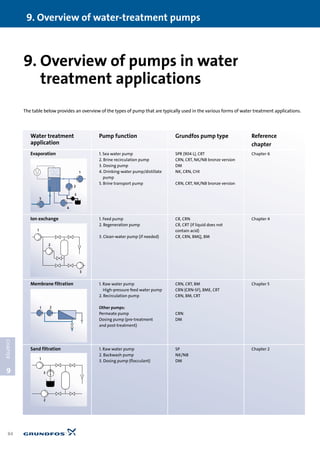
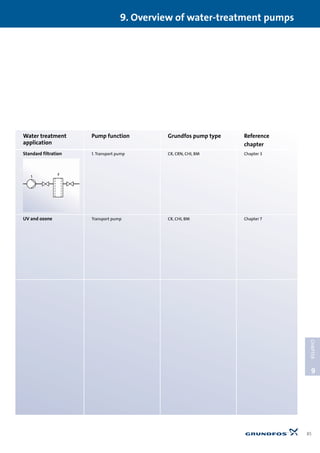

![91
List of tables
Table 1: Recommended and maximum permissible values for some of the most important substances in drinking water . . . . . . . 9
Table 2: Chemical symbols for various soluble substances . . . . . . . . . . . . . . . . . . . . . . . . . . . . . . . . . . . . . . . . . . . . . . . . . . . . . . . . . . . . . . . . . . 10
Table 3: Hardness of various types of water specified in three different units . . . . . . . . . . . . . . . . . . . . . . . . . . . . . . . . . . . . . . . . . . . . . . . . . 11
Table 4: Stainless steel grades with alloy elements [w%] and PRE values . . . . . . . . . . . . . . . . . . . . . . . . . . . . . . . . . . . . . . . . . . . . . . . . . . . . . 15
Table 5: The proportion of ground water in the drinking-water supply . . . . . . . . . . . . . . . . . . . . . . . . . . . . . . . . . . . . . . . . . . . . . . . . . . . . . . . 18
Table 6: Settling time in water for selected materials . . . . . . . . . . . . . . . . . . . . . . . . . . . . . . . . . . . . . . . . . . . . . . . . . . . . . . . . . . . . . . . . . . . . . . . 23
Table 7: Examples of pressure filters and open filters . . . . . . . . . . . . . . . . . . . . . . . . . . . . . . . . . . . . . . . . . . . . . . . . . . . . . . . . . . . . . . . . . . . . . . . 28
Table 8: Energy concumption of pump/system types . . . . . . . . . . . . . . . . . . . . . . . . . . . . . . . . . . . . . . . . . . . . . . . . . . . . . . . . . . . . . . . . . . . . . . . 60
List of tables](https://image.slidesharecdn.com/water-treatment-150521102613-lva1-app6891/85/Water-treatment-92-320.jpg)
![92
Glossary
BOD Biological Oxygen Demand. - Method of measuring the content of (some) oxidable organic substances in the water.
CIE Continuous Ion Exchanger.
CIP Cleaning in Place. Washing carried out with the filtering medium still in place.
Coagulation The process of destabilisation of the charge (predominantly negative) on particulates and colloids suspended in water.
COD Chemical Oxygen Demand. - Method of measuring the content of all oxidable substances in the water.
Corrosion The deterioration of a metal or its properties caused by a reaction with its environment.
Cross-flow filtration Filtration by which the flow-off is divided into two streams, whereby the suspended particles are continuously washed
away.
Dead end filtration Filtration by which the suspended particles end up in the filter.
Distillation Distillation refers to a process where concentration intensification takes place in a solution, as the solvent is removed by
boiling off. The boiled-off solvent is subsequently condensed on a cold surface and is collected. With water treatment the
solvent will be water and the solution will normally be salt water.
ED process Electrodialysis process.
EDR process Electrodialysis reversal process.
ERT Energy Recovery Turbine. Reverse osmosis system principle according to which a turbine is driven by the concentrate.
Flocculation The process of enhancing agglomeration of destabilised particles and colloids toward settleable (or filterable) particles
(flocs).
Flux The capacity of purified water, “permeate”, measured in l/m2 membrane per hour.
Fouling Precipitation of solid substances on the membrane in micro and ultra filtration.
FTU Formazin Turbidity Units. – Unit of measurement for the content of inorganic substances in the water. Similar to NTU.
Inorganic substance A substance that does not contain carbon chemically bound to hydrogen. Carbonates, bicarbonates, carbides and carbon ox-
ides are considered inorganic substances, even though they contain carbon.
Ion exchange A reversible process in which ions are released from an insoluble permanent material (resin) in exchange for other ions in a
surrounding solution; the direction of the exchange depends upon the affinities of the ion exchanger for the ions present,
and the concentrations of the ions in the solution.
MED Multiple-Effect Distillation system.
Membrane filtration Membrane filtration is physical separation of a substance by means of a semi-permeable membrane. The presence of a
gradient, i.e. a propelling force, above the membrane drives the process. Membrane filtration is cross-flow filtration.
MF Micro filtration. Type of membrane filtration.
MSF Multi-stage Flash. Multi-effect distillation system.
NF Nano-filtration. Type of membrane filtration.
NTU Nephelometric Turbidity Units. – Unit of measurement for the content of inorganic substances in the water. Similar to FTU.
Organic substance* A substance that contains carbon chemically bound to hydrogen. It often contains other elements (particularly O, N,
halogens or S).
Ozone Ozone refers to water treatment by dosing of O3 (ozone). Ozone can be used for disinfection of water, i.e. to kill the micro-
organisms that are present in almost all types of surface water, and, in rarer cases, also in ground water.
Permanent hardness The difference between total and temporary hardness of water, explained as the quantity of calcium and magnesium
of water that corresponds to sulphate [SO4
2-] and chloride [Cl-]. Permanent hardness is characterised by the fact that it cannot be
removed by boiling etc.
PRE Pitting Resistance Equivalent.
RO Reverse Osmosis filtration. Type of membrane filtration.
SCC Stress Corrosion Cracking. Corrosion characterised by cracking caused by the simultaneous effects of mechanical tensile
stresses and corrosion.
Scaling Precipitation of solid substances on the membrane in nano and reverse osmosis filtration.
SDI Silt Density Index. – Index expressing the cloudiness of the water caused by suspended, undissolved substances, such as
clay.
SS Suspended Solids. Small undissolved particles.
Standard filtration Standard filtration is a process in which solid particles are separated from either a gas or a liquid.
Glossary](https://image.slidesharecdn.com/water-treatment-150521102613-lva1-app6891/85/Water-treatment-93-320.jpg)


This document discusses the responsibilities and innovative thinking required at Grundfos. It states that: 1) Being responsible is the foundation at Grundfos, which includes responsibility towards employees, maintaining the innovative spirit, and considering the external world. 2) Thinking ahead enables innovations by encouraging foresight and new ideas from employees to create the best solutions. 3) Innovation is the essence and soul of Grundfos, which allows the company to constantly develop new solutions and meet changing demands through initiative and renewal.


![Chapter 1. introduction[1]](https://cdn.slidesharecdn.com/ss_thumbnails/chapter1-171220222030-thumbnail.jpg?width=640&height=640&fit=bounds)


