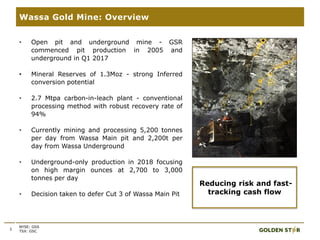
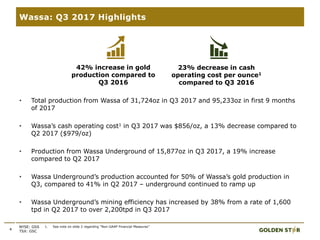
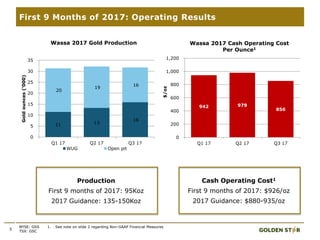
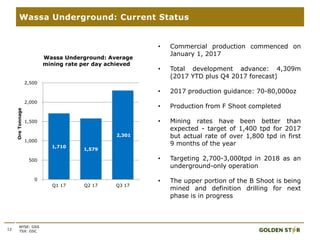
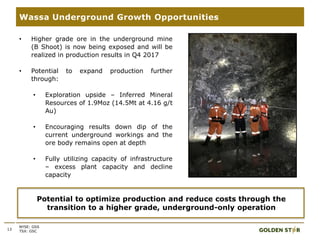
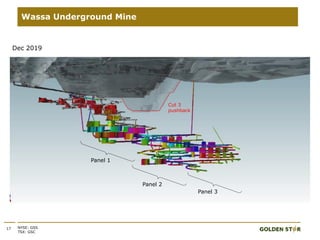
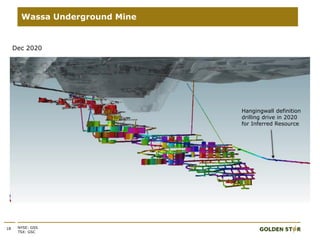
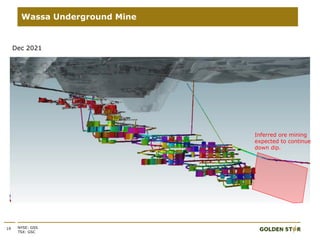
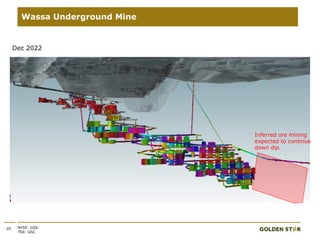
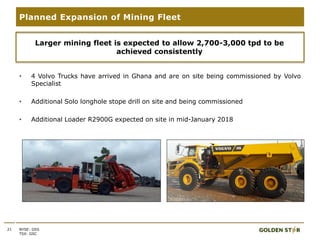
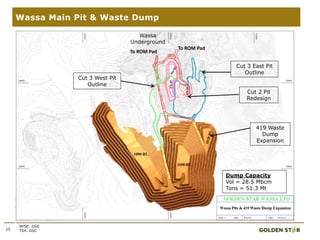
WASSA
OPERATIONS
SITE VISIT
NOVEMBER 2017
Focused on Cash Flow Generation
2
Disclaimer
NYSE: GSS
TSX: GSC
SAFE HARBOUR: Some statements contained in this presentation are forward-looking statements or forward-looking information (collectively, “forward-looking
statements”) within the meaning of the United States Private Securities Litigation Reform Act of 1995 and applicable Canadian securities laws. Investors are cautioned
that forward-looking statements are inherently uncertain and involve risks and uncertainties that could cause actual results to differ materially. Such statements include
comments regarding: production, cash operating cost, all-in sustaining cost and capital expenditure guidance for 2017; the potential expansion of production at Wassa
Underground; the timing for the release of further drilling results from Wassa Underground; the targeted 2017 mining rate at Wassa Underground;; the ability to conduct
additional drilling at Wassa Underground and the timing for completion thereof; the impact on grade as mining operations move further into B Shoot; the potential drilling
targets in 2017; the impact of Wassa Underground and Prestea Underground on the Company’s production profile, cost profile, cash operating cost per ounce and AISC
per ounce; the ability to mine via longitudinal stoping and transverse stoping at B Shoot at Wassa Underground and the timing and impact thereof; the achievement of
2017 production; the ability to expand Mineral Reserves and Mineral Resources and extend the life of mine at Prestea Underground and Wassa Underground through
exploration; and the timing for incurring 2017 capital expenditures. Factors that could cause actual results to differ materially include timing of and unexpected events at
the Prestea and/or the Wassa processing plants; variations in ore grade, tonnes mined, crushed or milled; delay or failure to receive board or government approvals and
permits; construction delays; the availability and cost of electrical power; timing and availability of external financing on acceptable terms or at all; technical, permitting,
mining or processing issues, including difficulties in establishing the infrastructure for Wassa Underground or Prestea Underground, inconsistent power supplies, plant
and/or equipment failures and an inability to obtain supplies and materials on reasonable terms (including pricing) or at all; changes in U.S. and Canadian securities
markets; heavy rainfall and flooding of underground mines; and fluctuations in gold price and input costs and general economic conditions. There can be no assurance that
future developments affecting the Company will be those anticipated by management. Please refer to the discussion of these and other factors in our Annual Information
Form for the year ended December 31, 2016 filed on SEDAR at www.sedar.com. The forecasts contained in this presentation constitute management's current estimates,
as of the date of this presentation, with respect to the matters covered thereby. We expect that these estimates will change as new information is received and that actual
results will vary from these estimates, possibly by material amounts. While we may elect to update these estimates at any time, we do not undertake to update any
estimate at any particular time or in response to any particular event. Investors and others should not assume that any forecasts in this presentation represent
management's estimate as of any date other than the date of this presentation.
NON-GAAP FINANCIAL MEASURES: In this presentation, we use the terms “cash operating cost per ounce”, “All-In Sustaining Cost per ounce”, “AISC per ounce”,
“Adjusted Net Income”, “Adjusted Net Income/Share”, “Cash operating margin per ounce” and “Cash Flow from operations before working capital changes”. These terms
should be considered as Non-GAAP Financial Measures as defined in applicable Canadian and United States securities laws and should not be considered in isolation or as a
substitute for measures of performance prepared in accordance with International Financial Reporting Standards (“IFRS”). “Cash operating cost per ounce” for a period is
equal to the cost of sales excluding depreciation and amortization for the period less royalties, the cash component of metals inventory net realizable value adjustments
and severance charges divided by the number of ounces of gold sold (excluding pre-commercial production ounces) during the period. “All-In Sustaining Costs per ounce”
commences with cash operating costs and then adds sustaining capital expenditures, corporate general and administrative costs, mine site exploratory drilling and
greenfield evaluation costs and environmental rehabilitation costs, divided by the number of ounces of gold sold (excluding pre-commercial production ounces) during the
period. This measure seeks to represent the total costs of producing gold from operations. These measures are not representative of all cash expenditures as they do not
include income tax payments or interest costs. In order to indicate to stakeholders the Company's earnings excluding the non-cash (gain)/loss on the fair value of
debentures, non-cash impairment charges and severance charges, the Company calculates “Adjusted Net Income” and “Adjusted Net Income per share” to supplement the
condensed interim consolidated financial statements. “Cash operating margin per ounce” is calculated as gold price minus cash operating cost per ounce. “Cash flow from
operations before working capital changes” is calculated by subtracting the "Changes in working capital" from "Net cash provided by operating activities" as found in the
statements of cash flows. These measures are not necessarily indicative of operating profit or cash flow from operations as would be determined under IFRS. Changes in
numerous factors including, but not limited to, mining rates, milling rates, gold grade, gold recovery, and the costs of labor, consumables and mine site general and
administrative activities can cause these measures to increase or decrease. We believe that these measures are the same or similar to the measures of other gold mining
companies, but may not be comparable to similarly titled measures in every instance. Please see our “Management’s Discussion and Analysis of Financial Condition and
Results of Operations for the three and six months ended June 30, 2017” for a reconciliation of these Non-GAAP measures to the nearest IFRS measure.
INFORMATION: The information contained in this presentation has been obtained by Golden Star from its own records and from other sources deemed reliable, however
no representation or warranty is made as to its accuracy or completeness. The technical information relating to Golden Star's material properties disclosed herein is based
upon technical reports prepared and filed pursuant to National Instrument 43-101 - Standards of Disclosure for Mineral Projects ("NI 43-101") and other publicly available
information regarding the Company, including the following: (i) “NI 43-101 Technical Report on a Feasibility Study of the Wassa Open Pit Mine and Underground Project in
Ghana” effective December 31, 2014; (ii) “NI 43-101 Technical Report on Resources and Reserves, Golden Star Resources Ltd., Bogoso Prestea Gold Mine, Ghana”
effective December 31, 2013, and (iii) “NI 43-101 Technical Report on a Feasibility Study of the Prestea Underground gold project in Ghana” effective November 3, 2015.
Additional information is included in Golden Star's Annual Information Form for the year ended December 31, 2016 which is filed on SEDAR. Mineral Reserves were
prepared under the supervision of Dr. Martin Raffield, Senior Vice President Technical Services for the Company. Dr. Raffield is a "Qualified Person" as defined by NI 43-
101. The Qualified Person reviewing and validating the estimation of the Mineral Resources is S. Mitchel Wasel, Golden Star Resources Vice President of Exploration.
CURRENCY: All monetary amounts refer to United States dollars unless otherwise indicated.
3
Wassa Gold Mine: Overview
NYSE: GSS
TSX: GSC
Reducing risk and fast-
tracking cash flow
• Open pit and underground mine - GSR
commenced pit production in 2005 and
underground in Q1 2017
• Mineral Reserves of 1.3Moz - strong Inferred
conversion potential
• 2.7 Mtpa carbon-in-leach plant - conventional
processing method with robust recovery rate of
94%
• Currently mining and processing 5,200 tonnes
per day from Wassa Main pit and 2,200t per
day from Wassa Underground
• Underground-only production in 2018 focusing
on high margin ounces at 2,700 to 3,000
tonnes per day
• Decision taken to defer Cut 3 of Wassa Main Pit
4
Wassa: Q3 2017 Highlights
NYSE: GSS
TSX: GSC
• Total production from Wassa of 31,724oz in Q3 2017 and 95,233oz in first 9 months
of 2017
• Wassa’s cash operating cost1 in Q3 2017 was $856/oz, a 13% decrease compared to
Q2 2017 ($979/oz)
• Production from Wassa Underground of 15,877oz in Q3 2017, a 19% increase
compared to Q2 2017
• Wassa Underground’s production accounted for 50% of Wassa’s gold production in
Q3, compared to 41% in Q2 2017 – underground continued to ramp up
• Wassa Underground’s mining efficiency has increased by 38% from a rate of 1,600
tpd in Q2 2017 to over 2,200tpd in Q3 2017
1. See note on slide 2 regarding “Non-GAAP Financial Measures”
42% increase in gold
production compared to
Q3 2016
23% decrease in cash
operating cost per ounce1
compared to Q3 2016
5
First 9 Months of 2017: Operating Results
NYSE: GSS
TSX: GSC
Production
First 9 months of 2017: 95Koz
2017 Guidance: 135-150Koz
5
NYSE: GSS
TSX: GSC
Cash Operating Cost1
First 9 months of 2017: $926/oz
2017 Guidance: $880-935/oz
1. See note on slide 2 regarding Non-GAAP Financial Measures
942 979
856
0
200
400
600
800
1,000
1,200
Q1 17 Q2 17 Q3 17
$/oz
Wassa 2017 Cash Operating Cost
Per Ounce1
11 13
16
20
19
16
0
5
10
15
20
25
30
35
Q1 17 Q2 17 Q3 17
Goldounces(‘000)
Wassa 2017 Gold Production
WUG Open pit
MINERAL
RESERVES
Dec 31, 2016 Proven and Probable Mineral
Reserve
Tonnes Grade Ounces
Wassa Main Pit 11,264,000 1.56 565,000
Wassa
Underground
5,477,000 4.21 742,000
Stockpiles 695,000 0.96 21,000
WASSA TOTAL 17,436,000 2.37 1,328,000
6
Wassa: Mineral Reserves and Resources
NYSE: GSS
TSX: GSC
MINERAL
RESOURCES
Dec 31, 2016 Measured and Indicated Resources
Tonnes Grade Ounces
Wassa Main Pit 27,500,000 1.43 1,265,000
Wassa
Underground
13,499,000 3.82 1,656,000
Wassa Other 3,348,000 3.78 407,000
WASSA TOTAL 44,347,000 2.33 3,328,000
7
Operational Successes
NYSE: GSS
TSX: GSC
• Production from Wassa Underground is stabilizing and will improve as the new fleet
becomes available early in 2018
• The “Continuous Improvement Programme” has been implemented encompassing
the entire mine staff
• Decision has been taken to defer Cut 3 of Wassa Main Pit and to focus on higher
margin, underground production from early 2018 onwards
• LTI Free Days: 150 days
• LTI Free man-hours: 2.8 million
• Won the following awards at 2017 Safety and
First Aid competition:
• Best Mine team at the Zone 1 Safety
& First Aid Competition
• Best community team at the Zone 1
Safety & First Aid Competition
• Weekly “Walk the Talk” intervention by
management; out of 740 issues identified
during the year-to-date, 520 have been
addressed with proposed actions completed
• Mine rescue training gallery, with design
considerations based on Wassa and Prestea
Underground settings, is complete and will
serve both mine rescue teams
8
A Strong Safety Culture
NYSE: GSS
TSX: GSC
Wassa’s award winning safety and first aid
team
9
GEOLOGY
10
Wassa Geology
NYSE: GSS
TSX: GSC
• The Wassa Gold deposit is hosted in Birimian meta sedimentary and volcanic rocks
• Dating has shown it is the oldest deposit in the Ashanti Belt
• Initial gold mineralization has been affected by two major folding events which controls
current geometry of ore bodies
• Gold has been remobilized during the first tight folding event and it is these higher
grade fold closures which are being mined underground
WASSA
UNDERGROUND
11
• Commercial production commenced on
January 1, 2017
• Total development advance: 4,309m
(2017 YTD plus Q4 2017 forecast)
• 2017 production guidance: 70-80,000oz
• Production from F Shoot completed
• Mining rates have been better than
expected - target of 1,400 tpd for 2017
but actual rate of over 1,800 tpd in first
9 months of the year
• Targeting 2,700-3,000tpd in 2018 as an
underground-only operation
• The upper portion of the B Shoot is being
mined and definition drilling for next
phase is in progress
12
Wassa Underground: Current Status
NYSE: GSS
TSX: GSC
1,710
1,579
2,301
0
500
1,000
1,500
2,000
2,500
Q1 17 Q2 17 Q3 17
OreTonnage
Wassa Underground: Average
mining rate per day achieved
13
Wassa Underground Growth Opportunities
NYSE: GSS
TSX: GSC
Potential to optimize production and reduce costs through the
transition to a higher grade, underground-only operation
• Higher grade ore in the underground mine
(B Shoot) is now being exposed and will be
realized in production results in Q4 2017
• Potential to expand production further
through:
• Exploration upside – Inferred Mineral
Resources of 1.9Moz (14.5Mt at 4.16 g/t
Au)
• Encouraging results down dip of the
current underground workings and the
ore body remains open at depth
• Fully utilizing capacity of infrastructure
– excess plant capacity and decline
capacity
14 NYSE: GSS
TSX: GSC
Wassa Underground Mine
Current development and stoping
As-built F Shoot
stoping
As-built pit
As-built B Shoot
stoping
15 NYSE: GSS
TSX: GSC
Wassa Underground Mine
Dec 2017
16 NYSE: GSS
TSX: GSC
Wassa Underground Mine
Dec 2018
Hangingwall definition drilling drive
in 2018 for Panel 2 and 3
Panel 1
17 NYSE: GSS
TSX: GSC
Wassa Underground Mine
Dec 2019
Cut 3
pushback
Panel 1
Panel 2
Panel 3
18 NYSE: GSS
TSX: GSC
Wassa Underground Mine
Dec 2020
Hangingwall definition
drilling drive in 2020
for Inferred Resource
19 NYSE: GSS
TSX: GSC
Wassa Underground Mine
Dec 2021
Inferred ore mining
expected to continue
down dip.
20 NYSE: GSS
TSX: GSC
Wassa Underground Mine
Dec 2022
Inferred ore mining
expected to continue
down dip.
• 4 Volvo Trucks have arrived in Ghana and are on site being commissioned by Volvo
Specialist
• Additional Solo longhole stope drill on site and being commissioned
• Additional Loader R2900G expected on site in mid-January 2018
21
Planned Expansion of Mining Fleet
NYSE: GSS
TSX: GSC
Larger mining fleet is expected to allow 2,700-3,000 tpd to be
achieved consistently
• Raise bore ventilation holing in B
Shoot pit is expected to be
implemented in Q1 2018
• Raise bore waste passes to supply
waste for stope support are expected
to be put in place in Q1 2018
• Second portal expected to be
completed by Q2 2018
• Paste fill being evaluated as the
preferred stope support for Panel 2
and below - this will enable 4,000 tpd
to be mined from underground
22
Planned Infrastructure Upgrades
NYSE: GSS
TSX: GSC
Upgrades being implemented to allow for a future mining rate of
4,000 tpd from existing decline
23
WASSA MAIN PIT
• Conventional bench mining
• Production of 55Koz from Wassa Main Pit in
first 9 months of 2017
• Cut 2 will finish in December 2017 and Cut has
been deferred
Open Pit Fleet
• 3 Liebherr 984 Backhoe excavators
• 10 CAT 777 Trucks
• 3 CAT D9 dozers
• 4 Production rigs, 2 Sandvik and 2 Atlas Copco
• Fleet capacity ~650,000 tonnes per month
24
Wassa Main Pit
NYSE: GSS
TSX: GSC
Cut 2 Pit
Redesign
Cut 3 East Pit
Outline
Cut 3 West Pit
Outline
419 Waste
Dump
Expansion
Dump Capacity
Vol = 28.5 Mbcm
Tons = 51.3 Mt
Wassa
Underground
To ROM Pad
To ROM Pad
Wassa Main Pit & Waste Dump
25
NYSE: GSS
TSX: GSC
Wassa Main Pit: Deferred Cut 3 Pushback
Cut 3 Phase 1
Cut 3 Phase 2
Decision taken to defer the Cut 3 pushback until a time when the gold price is
higher
26
NYSE: GSS
TSX: GSC
27
PROCESSING PLANT
28
WASSA PROCESSING PLANT
DUMP TRUCK
ROM
FE WHEEL LOADER
ROM Bin
Vibrating
Grizzly
Apron
feeder
CV01
CV02
weightometer
weightometer
weightometer
Single
toggle Jaw
Crusher
Secondary
Screen
Secondary
cone Crusher
CV10
CV04
CV03 CV05
CV11
Belt feeders X4
COS
Ball mill 2
Ball mill 1 scats
scats
Sump2
Sump1
Splitter
box
Primary Cyclone
cluster2
Primary Cyclone
cluster1
Knelsonconc 2
Knelsonconc 1
Scalping screen1
Scalping screen2
Concentrate tk 2
Concentrate tk 1
Shaking table
Trashscreen
Sump3
Sump4
Sump5 with
cyanide addition
Pre-leachHighrate Thickener
Secondary Cyclone
cluster1
Secondary Cyclone
cluster2
Thickener overflow tank
Electrowinning cell (3x)Stripsolution
tank
Elution
column
Calcine oven (2x)
Induction furnace
Bullion bars
Acid wash
cone
Recovery
screen
Storage facility
Carbon Safety Screen
CIL tanks
Carbon basket
Sump6
RegenerationKiln Barrencarbon hopper
Quench carbon screen
U/F
O/F
O/F
O/F
U/F
O/F
U/F
U/F
O/F
U/S
U/S
U/S
O/S
O/S
O/S
Trash
material
CV12
CV13
Quaternary
cone
Crushers X4
Tertiary
Screens X2
Tertiary
bin
Quaternary
bin
CV08 &09
CV07
CV06
CV16
CV17
Tertiary
cone
Crushers
X2
weightometer
Lime Silo
O/F
U/F
U/F
U/F
Head
Autosampler
Tails
Autosampler
Recovery: 94%
Throughput: 7,600t/day
Mill availability: 95%
Wassa Processing Plant
NYSE: GSS
TSX: GSC
29
2017 EXPLORATION
30
Wassa Underground Extended Through Step Out Drilling
NYSE: GSS
TSX: GSC
HOLE ID
From
(m)
To
(m)
Drilled
Width
(m)
Grade
Au
(g/t)
B Shoot North
BS17DD002 294.0 309.0 15.0 18.9
BS17DD002 300.0 302.0 2.0 91.8
BS17DD003 289.9 314.0 24.1 7.3
B Shoot South
BS17DD385M 1001.0 1024.8 23.8 6.1
BS17DD385M 1018.0 1020.0 2.0 20.2
BS17DD385M 1049.3 1071.0 21.7 5.3
WASSA UNDERGROUND
Latest drilling results confirm high grade B Shoot extends to the north and
south and remains open in both directions
 Results confirm B Shoot extends
approximately 50m to the north of
current planned stoping area and 200m
to the south of Wassa’s Inferred Mineral
Resources
 Indicates that Wassa is a larger deposit
than previously estimated - potential to
expand production in the short term
and longer term
 B Shoot South drilling will comprise
7,000m in total and B Shoot North
comprised 4,164m
 Further drilling results expected from
Wassa Underground during Q4 2017
 First exploration program at Wassa
Underground since 2014
31
B Shoot South: Ore Body Remains Open Down Plunge
NYSE: GSS
TSX: GSC
SN
BS17DD385m1
23.8m @ 6.1 g/t
21.7m @ 5.3 g/t
18900N19100N19300N
New 200m
step out
fence –
results from
1st mother
hole
released in
Sept 2017
B Shoot planned
stopes
B
Shoot
Wassa Main
Pit
Previous
step out
drilling
holes
Inferred
Mineral
Resource
400 m
F Shoot
 Encouraging results from first mother hole of B Shoot South step out hole; however
further results needed to gain comprehensive understanding of the ore body’s
extension
1. All widths in this diagram are drilled widths.
32
NYSE: GSS
TSX: GSC
• 2017 surface drilling has identified further near term, potential stopes directly to the
north of the 720 and 695 Levels - possibility to extend stopes 20-30 metres in this
direction
B Shoot North: Potential To Increase Near-Term Production
BS17DD0021
15.0 m @ 18.9 g/t
BS17DD0031
24.1m @ 7.3 g/t
BS17DD0011
13.0 m @ 6.3g/t
1. All widths in this diagram are drilled widths.
B Shoot mined
stopes
F Shoot mined
stopes
Wassa Main Pit
745
720
770
795
695
Conclusion
33
34
Wassa Gold Mine: Summary
NYSE: GSS
TSX: GSC
• Focusing on optimizing the mine to
maximize margin and cash flow generation
• Continuing to improve the understanding of
the ore body with increasing depth
• Cut 3 delayed to focus on higher grade,
higher margin underground ounces
• Driving continuous improvement
• Ensuring that the upgraded underground
fleet is fully utilized to achieve a mining rate
of 2,700-3,000 tpd in 2018
• Higher grade underground production
ensures mine remains robust to sensitivities
of gold price, grade and tonnage

Wassa Presentation

  • 1.
  • 2.
    2 Disclaimer NYSE: GSS TSX: GSC SAFEHARBOUR: Some statements contained in this presentation are forward-looking statements or forward-looking information (collectively, “forward-looking statements”) within the meaning of the United States Private Securities Litigation Reform Act of 1995 and applicable Canadian securities laws. Investors are cautioned that forward-looking statements are inherently uncertain and involve risks and uncertainties that could cause actual results to differ materially. Such statements include comments regarding: production, cash operating cost, all-in sustaining cost and capital expenditure guidance for 2017; the potential expansion of production at Wassa Underground; the timing for the release of further drilling results from Wassa Underground; the targeted 2017 mining rate at Wassa Underground;; the ability to conduct additional drilling at Wassa Underground and the timing for completion thereof; the impact on grade as mining operations move further into B Shoot; the potential drilling targets in 2017; the impact of Wassa Underground and Prestea Underground on the Company’s production profile, cost profile, cash operating cost per ounce and AISC per ounce; the ability to mine via longitudinal stoping and transverse stoping at B Shoot at Wassa Underground and the timing and impact thereof; the achievement of 2017 production; the ability to expand Mineral Reserves and Mineral Resources and extend the life of mine at Prestea Underground and Wassa Underground through exploration; and the timing for incurring 2017 capital expenditures. Factors that could cause actual results to differ materially include timing of and unexpected events at the Prestea and/or the Wassa processing plants; variations in ore grade, tonnes mined, crushed or milled; delay or failure to receive board or government approvals and permits; construction delays; the availability and cost of electrical power; timing and availability of external financing on acceptable terms or at all; technical, permitting, mining or processing issues, including difficulties in establishing the infrastructure for Wassa Underground or Prestea Underground, inconsistent power supplies, plant and/or equipment failures and an inability to obtain supplies and materials on reasonable terms (including pricing) or at all; changes in U.S. and Canadian securities markets; heavy rainfall and flooding of underground mines; and fluctuations in gold price and input costs and general economic conditions. There can be no assurance that future developments affecting the Company will be those anticipated by management. Please refer to the discussion of these and other factors in our Annual Information Form for the year ended December 31, 2016 filed on SEDAR at www.sedar.com. The forecasts contained in this presentation constitute management's current estimates, as of the date of this presentation, with respect to the matters covered thereby. We expect that these estimates will change as new information is received and that actual results will vary from these estimates, possibly by material amounts. While we may elect to update these estimates at any time, we do not undertake to update any estimate at any particular time or in response to any particular event. Investors and others should not assume that any forecasts in this presentation represent management's estimate as of any date other than the date of this presentation. NON-GAAP FINANCIAL MEASURES: In this presentation, we use the terms “cash operating cost per ounce”, “All-In Sustaining Cost per ounce”, “AISC per ounce”, “Adjusted Net Income”, “Adjusted Net Income/Share”, “Cash operating margin per ounce” and “Cash Flow from operations before working capital changes”. These terms should be considered as Non-GAAP Financial Measures as defined in applicable Canadian and United States securities laws and should not be considered in isolation or as a substitute for measures of performance prepared in accordance with International Financial Reporting Standards (“IFRS”). “Cash operating cost per ounce” for a period is equal to the cost of sales excluding depreciation and amortization for the period less royalties, the cash component of metals inventory net realizable value adjustments and severance charges divided by the number of ounces of gold sold (excluding pre-commercial production ounces) during the period. “All-In Sustaining Costs per ounce” commences with cash operating costs and then adds sustaining capital expenditures, corporate general and administrative costs, mine site exploratory drilling and greenfield evaluation costs and environmental rehabilitation costs, divided by the number of ounces of gold sold (excluding pre-commercial production ounces) during the period. This measure seeks to represent the total costs of producing gold from operations. These measures are not representative of all cash expenditures as they do not include income tax payments or interest costs. In order to indicate to stakeholders the Company's earnings excluding the non-cash (gain)/loss on the fair value of debentures, non-cash impairment charges and severance charges, the Company calculates “Adjusted Net Income” and “Adjusted Net Income per share” to supplement the condensed interim consolidated financial statements. “Cash operating margin per ounce” is calculated as gold price minus cash operating cost per ounce. “Cash flow from operations before working capital changes” is calculated by subtracting the "Changes in working capital" from "Net cash provided by operating activities" as found in the statements of cash flows. These measures are not necessarily indicative of operating profit or cash flow from operations as would be determined under IFRS. Changes in numerous factors including, but not limited to, mining rates, milling rates, gold grade, gold recovery, and the costs of labor, consumables and mine site general and administrative activities can cause these measures to increase or decrease. We believe that these measures are the same or similar to the measures of other gold mining companies, but may not be comparable to similarly titled measures in every instance. Please see our “Management’s Discussion and Analysis of Financial Condition and Results of Operations for the three and six months ended June 30, 2017” for a reconciliation of these Non-GAAP measures to the nearest IFRS measure. INFORMATION: The information contained in this presentation has been obtained by Golden Star from its own records and from other sources deemed reliable, however no representation or warranty is made as to its accuracy or completeness. The technical information relating to Golden Star's material properties disclosed herein is based upon technical reports prepared and filed pursuant to National Instrument 43-101 - Standards of Disclosure for Mineral Projects ("NI 43-101") and other publicly available information regarding the Company, including the following: (i) “NI 43-101 Technical Report on a Feasibility Study of the Wassa Open Pit Mine and Underground Project in Ghana” effective December 31, 2014; (ii) “NI 43-101 Technical Report on Resources and Reserves, Golden Star Resources Ltd., Bogoso Prestea Gold Mine, Ghana” effective December 31, 2013, and (iii) “NI 43-101 Technical Report on a Feasibility Study of the Prestea Underground gold project in Ghana” effective November 3, 2015. Additional information is included in Golden Star's Annual Information Form for the year ended December 31, 2016 which is filed on SEDAR. Mineral Reserves were prepared under the supervision of Dr. Martin Raffield, Senior Vice President Technical Services for the Company. Dr. Raffield is a "Qualified Person" as defined by NI 43- 101. The Qualified Person reviewing and validating the estimation of the Mineral Resources is S. Mitchel Wasel, Golden Star Resources Vice President of Exploration. CURRENCY: All monetary amounts refer to United States dollars unless otherwise indicated.
  • 3.
    3 Wassa Gold Mine:Overview NYSE: GSS TSX: GSC Reducing risk and fast- tracking cash flow • Open pit and underground mine - GSR commenced pit production in 2005 and underground in Q1 2017 • Mineral Reserves of 1.3Moz - strong Inferred conversion potential • 2.7 Mtpa carbon-in-leach plant - conventional processing method with robust recovery rate of 94% • Currently mining and processing 5,200 tonnes per day from Wassa Main pit and 2,200t per day from Wassa Underground • Underground-only production in 2018 focusing on high margin ounces at 2,700 to 3,000 tonnes per day • Decision taken to defer Cut 3 of Wassa Main Pit
  • 4.
    4 Wassa: Q3 2017Highlights NYSE: GSS TSX: GSC • Total production from Wassa of 31,724oz in Q3 2017 and 95,233oz in first 9 months of 2017 • Wassa’s cash operating cost1 in Q3 2017 was $856/oz, a 13% decrease compared to Q2 2017 ($979/oz) • Production from Wassa Underground of 15,877oz in Q3 2017, a 19% increase compared to Q2 2017 • Wassa Underground’s production accounted for 50% of Wassa’s gold production in Q3, compared to 41% in Q2 2017 – underground continued to ramp up • Wassa Underground’s mining efficiency has increased by 38% from a rate of 1,600 tpd in Q2 2017 to over 2,200tpd in Q3 2017 1. See note on slide 2 regarding “Non-GAAP Financial Measures” 42% increase in gold production compared to Q3 2016 23% decrease in cash operating cost per ounce1 compared to Q3 2016
  • 5.
    5 First 9 Monthsof 2017: Operating Results NYSE: GSS TSX: GSC Production First 9 months of 2017: 95Koz 2017 Guidance: 135-150Koz 5 NYSE: GSS TSX: GSC Cash Operating Cost1 First 9 months of 2017: $926/oz 2017 Guidance: $880-935/oz 1. See note on slide 2 regarding Non-GAAP Financial Measures 942 979 856 0 200 400 600 800 1,000 1,200 Q1 17 Q2 17 Q3 17 $/oz Wassa 2017 Cash Operating Cost Per Ounce1 11 13 16 20 19 16 0 5 10 15 20 25 30 35 Q1 17 Q2 17 Q3 17 Goldounces(‘000) Wassa 2017 Gold Production WUG Open pit
  • 6.
    MINERAL RESERVES Dec 31, 2016Proven and Probable Mineral Reserve Tonnes Grade Ounces Wassa Main Pit 11,264,000 1.56 565,000 Wassa Underground 5,477,000 4.21 742,000 Stockpiles 695,000 0.96 21,000 WASSA TOTAL 17,436,000 2.37 1,328,000 6 Wassa: Mineral Reserves and Resources NYSE: GSS TSX: GSC MINERAL RESOURCES Dec 31, 2016 Measured and Indicated Resources Tonnes Grade Ounces Wassa Main Pit 27,500,000 1.43 1,265,000 Wassa Underground 13,499,000 3.82 1,656,000 Wassa Other 3,348,000 3.78 407,000 WASSA TOTAL 44,347,000 2.33 3,328,000
  • 7.
    7 Operational Successes NYSE: GSS TSX:GSC • Production from Wassa Underground is stabilizing and will improve as the new fleet becomes available early in 2018 • The “Continuous Improvement Programme” has been implemented encompassing the entire mine staff • Decision has been taken to defer Cut 3 of Wassa Main Pit and to focus on higher margin, underground production from early 2018 onwards
  • 8.
    • LTI FreeDays: 150 days • LTI Free man-hours: 2.8 million • Won the following awards at 2017 Safety and First Aid competition: • Best Mine team at the Zone 1 Safety & First Aid Competition • Best community team at the Zone 1 Safety & First Aid Competition • Weekly “Walk the Talk” intervention by management; out of 740 issues identified during the year-to-date, 520 have been addressed with proposed actions completed • Mine rescue training gallery, with design considerations based on Wassa and Prestea Underground settings, is complete and will serve both mine rescue teams 8 A Strong Safety Culture NYSE: GSS TSX: GSC Wassa’s award winning safety and first aid team
  • 9.
  • 10.
    10 Wassa Geology NYSE: GSS TSX:GSC • The Wassa Gold deposit is hosted in Birimian meta sedimentary and volcanic rocks • Dating has shown it is the oldest deposit in the Ashanti Belt • Initial gold mineralization has been affected by two major folding events which controls current geometry of ore bodies • Gold has been remobilized during the first tight folding event and it is these higher grade fold closures which are being mined underground
  • 11.
  • 12.
    • Commercial productioncommenced on January 1, 2017 • Total development advance: 4,309m (2017 YTD plus Q4 2017 forecast) • 2017 production guidance: 70-80,000oz • Production from F Shoot completed • Mining rates have been better than expected - target of 1,400 tpd for 2017 but actual rate of over 1,800 tpd in first 9 months of the year • Targeting 2,700-3,000tpd in 2018 as an underground-only operation • The upper portion of the B Shoot is being mined and definition drilling for next phase is in progress 12 Wassa Underground: Current Status NYSE: GSS TSX: GSC 1,710 1,579 2,301 0 500 1,000 1,500 2,000 2,500 Q1 17 Q2 17 Q3 17 OreTonnage Wassa Underground: Average mining rate per day achieved
  • 13.
    13 Wassa Underground GrowthOpportunities NYSE: GSS TSX: GSC Potential to optimize production and reduce costs through the transition to a higher grade, underground-only operation • Higher grade ore in the underground mine (B Shoot) is now being exposed and will be realized in production results in Q4 2017 • Potential to expand production further through: • Exploration upside – Inferred Mineral Resources of 1.9Moz (14.5Mt at 4.16 g/t Au) • Encouraging results down dip of the current underground workings and the ore body remains open at depth • Fully utilizing capacity of infrastructure – excess plant capacity and decline capacity
  • 14.
    14 NYSE: GSS TSX:GSC Wassa Underground Mine Current development and stoping As-built F Shoot stoping As-built pit As-built B Shoot stoping
  • 15.
    15 NYSE: GSS TSX:GSC Wassa Underground Mine Dec 2017
  • 16.
    16 NYSE: GSS TSX:GSC Wassa Underground Mine Dec 2018 Hangingwall definition drilling drive in 2018 for Panel 2 and 3 Panel 1
  • 17.
    17 NYSE: GSS TSX:GSC Wassa Underground Mine Dec 2019 Cut 3 pushback Panel 1 Panel 2 Panel 3
  • 18.
    18 NYSE: GSS TSX:GSC Wassa Underground Mine Dec 2020 Hangingwall definition drilling drive in 2020 for Inferred Resource
  • 19.
    19 NYSE: GSS TSX:GSC Wassa Underground Mine Dec 2021 Inferred ore mining expected to continue down dip.
  • 20.
    20 NYSE: GSS TSX:GSC Wassa Underground Mine Dec 2022 Inferred ore mining expected to continue down dip.
  • 21.
    • 4 VolvoTrucks have arrived in Ghana and are on site being commissioned by Volvo Specialist • Additional Solo longhole stope drill on site and being commissioned • Additional Loader R2900G expected on site in mid-January 2018 21 Planned Expansion of Mining Fleet NYSE: GSS TSX: GSC Larger mining fleet is expected to allow 2,700-3,000 tpd to be achieved consistently
  • 22.
    • Raise boreventilation holing in B Shoot pit is expected to be implemented in Q1 2018 • Raise bore waste passes to supply waste for stope support are expected to be put in place in Q1 2018 • Second portal expected to be completed by Q2 2018 • Paste fill being evaluated as the preferred stope support for Panel 2 and below - this will enable 4,000 tpd to be mined from underground 22 Planned Infrastructure Upgrades NYSE: GSS TSX: GSC Upgrades being implemented to allow for a future mining rate of 4,000 tpd from existing decline
  • 23.
  • 24.
    • Conventional benchmining • Production of 55Koz from Wassa Main Pit in first 9 months of 2017 • Cut 2 will finish in December 2017 and Cut has been deferred Open Pit Fleet • 3 Liebherr 984 Backhoe excavators • 10 CAT 777 Trucks • 3 CAT D9 dozers • 4 Production rigs, 2 Sandvik and 2 Atlas Copco • Fleet capacity ~650,000 tonnes per month 24 Wassa Main Pit NYSE: GSS TSX: GSC
  • 25.
    Cut 2 Pit Redesign Cut3 East Pit Outline Cut 3 West Pit Outline 419 Waste Dump Expansion Dump Capacity Vol = 28.5 Mbcm Tons = 51.3 Mt Wassa Underground To ROM Pad To ROM Pad Wassa Main Pit & Waste Dump 25 NYSE: GSS TSX: GSC
  • 26.
    Wassa Main Pit:Deferred Cut 3 Pushback Cut 3 Phase 1 Cut 3 Phase 2 Decision taken to defer the Cut 3 pushback until a time when the gold price is higher 26 NYSE: GSS TSX: GSC
  • 27.
  • 28.
    28 WASSA PROCESSING PLANT DUMPTRUCK ROM FE WHEEL LOADER ROM Bin Vibrating Grizzly Apron feeder CV01 CV02 weightometer weightometer weightometer Single toggle Jaw Crusher Secondary Screen Secondary cone Crusher CV10 CV04 CV03 CV05 CV11 Belt feeders X4 COS Ball mill 2 Ball mill 1 scats scats Sump2 Sump1 Splitter box Primary Cyclone cluster2 Primary Cyclone cluster1 Knelsonconc 2 Knelsonconc 1 Scalping screen1 Scalping screen2 Concentrate tk 2 Concentrate tk 1 Shaking table Trashscreen Sump3 Sump4 Sump5 with cyanide addition Pre-leachHighrate Thickener Secondary Cyclone cluster1 Secondary Cyclone cluster2 Thickener overflow tank Electrowinning cell (3x)Stripsolution tank Elution column Calcine oven (2x) Induction furnace Bullion bars Acid wash cone Recovery screen Storage facility Carbon Safety Screen CIL tanks Carbon basket Sump6 RegenerationKiln Barrencarbon hopper Quench carbon screen U/F O/F O/F O/F U/F O/F U/F U/F O/F U/S U/S U/S O/S O/S O/S Trash material CV12 CV13 Quaternary cone Crushers X4 Tertiary Screens X2 Tertiary bin Quaternary bin CV08 &09 CV07 CV06 CV16 CV17 Tertiary cone Crushers X2 weightometer Lime Silo O/F U/F U/F U/F Head Autosampler Tails Autosampler Recovery: 94% Throughput: 7,600t/day Mill availability: 95% Wassa Processing Plant NYSE: GSS TSX: GSC
  • 29.
  • 30.
    30 Wassa Underground ExtendedThrough Step Out Drilling NYSE: GSS TSX: GSC HOLE ID From (m) To (m) Drilled Width (m) Grade Au (g/t) B Shoot North BS17DD002 294.0 309.0 15.0 18.9 BS17DD002 300.0 302.0 2.0 91.8 BS17DD003 289.9 314.0 24.1 7.3 B Shoot South BS17DD385M 1001.0 1024.8 23.8 6.1 BS17DD385M 1018.0 1020.0 2.0 20.2 BS17DD385M 1049.3 1071.0 21.7 5.3 WASSA UNDERGROUND Latest drilling results confirm high grade B Shoot extends to the north and south and remains open in both directions  Results confirm B Shoot extends approximately 50m to the north of current planned stoping area and 200m to the south of Wassa’s Inferred Mineral Resources  Indicates that Wassa is a larger deposit than previously estimated - potential to expand production in the short term and longer term  B Shoot South drilling will comprise 7,000m in total and B Shoot North comprised 4,164m  Further drilling results expected from Wassa Underground during Q4 2017  First exploration program at Wassa Underground since 2014
  • 31.
    31 B Shoot South:Ore Body Remains Open Down Plunge NYSE: GSS TSX: GSC SN BS17DD385m1 23.8m @ 6.1 g/t 21.7m @ 5.3 g/t 18900N19100N19300N New 200m step out fence – results from 1st mother hole released in Sept 2017 B Shoot planned stopes B Shoot Wassa Main Pit Previous step out drilling holes Inferred Mineral Resource 400 m F Shoot  Encouraging results from first mother hole of B Shoot South step out hole; however further results needed to gain comprehensive understanding of the ore body’s extension 1. All widths in this diagram are drilled widths.
  • 32.
    32 NYSE: GSS TSX: GSC •2017 surface drilling has identified further near term, potential stopes directly to the north of the 720 and 695 Levels - possibility to extend stopes 20-30 metres in this direction B Shoot North: Potential To Increase Near-Term Production BS17DD0021 15.0 m @ 18.9 g/t BS17DD0031 24.1m @ 7.3 g/t BS17DD0011 13.0 m @ 6.3g/t 1. All widths in this diagram are drilled widths. B Shoot mined stopes F Shoot mined stopes Wassa Main Pit 745 720 770 795 695
  • 33.
  • 34.
    34 Wassa Gold Mine:Summary NYSE: GSS TSX: GSC • Focusing on optimizing the mine to maximize margin and cash flow generation • Continuing to improve the understanding of the ore body with increasing depth • Cut 3 delayed to focus on higher grade, higher margin underground ounces • Driving continuous improvement • Ensuring that the upgraded underground fleet is fully utilized to achieve a mining rate of 2,700-3,000 tpd in 2018 • Higher grade underground production ensures mine remains robust to sensitivities of gold price, grade and tonnage