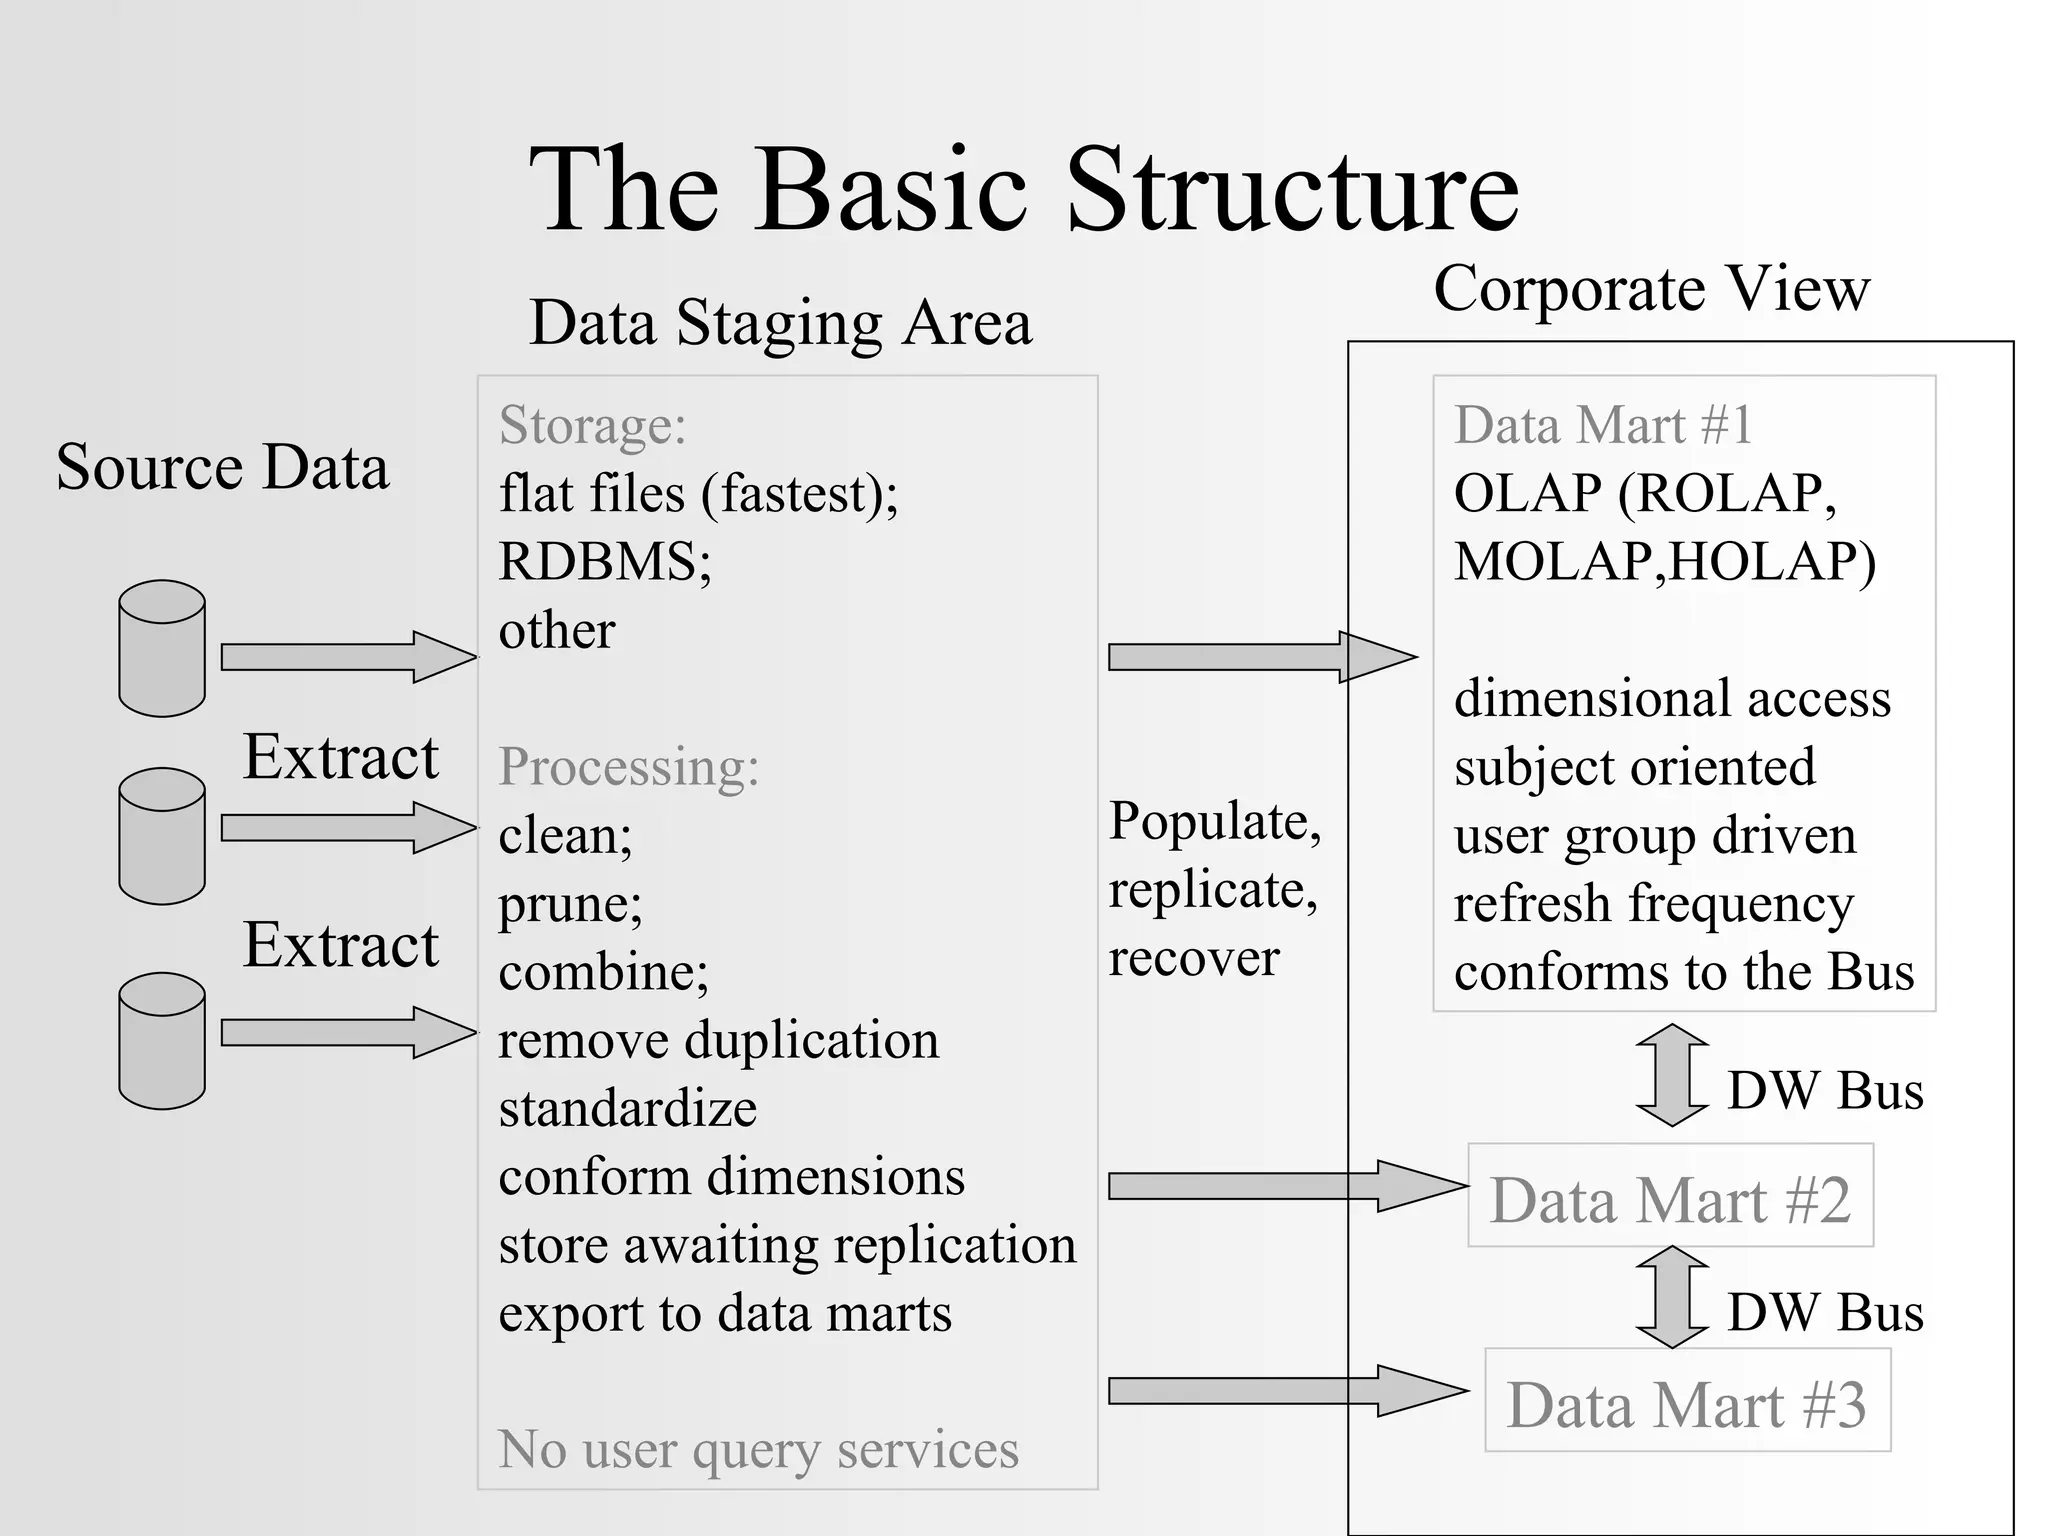
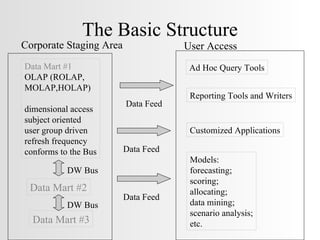
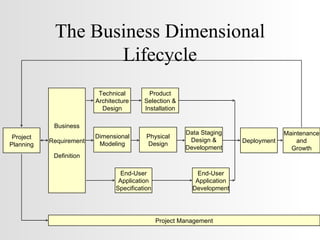
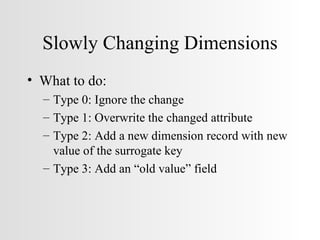
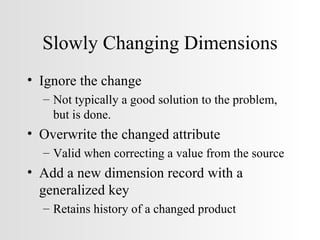
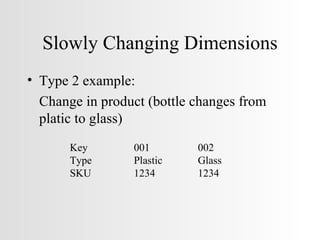
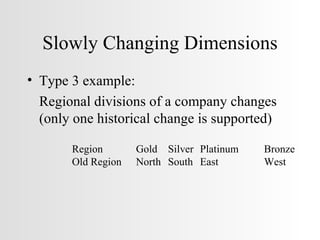
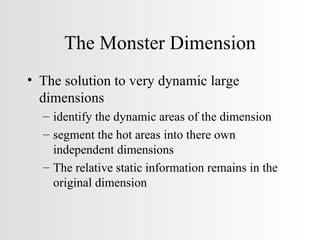
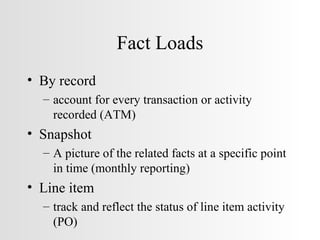
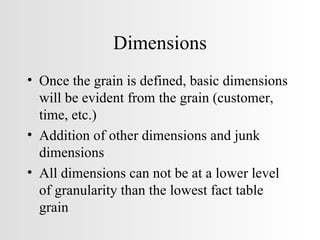
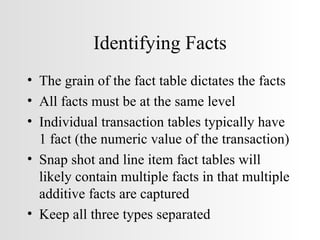
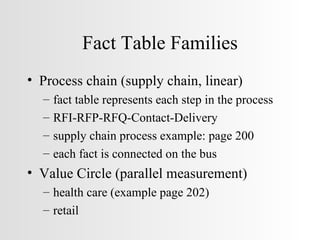
The Basic Structure Extract Source Data Extract Storage:   flat files (fastest); RDBMS; other Processing: clean; prune; combine; remove duplication standardize conform dimensions store awaiting replication export to data marts No user query services Data Staging Area Data Mart #1 OLAP (ROLAP, MOLAP,HOLAP) dimensional access subject oriented user group driven refresh frequency conforms to the Bus Data Mart #2 Data Mart #3 Populate, replicate, recover DW Bus DW Bus Corporate View
The Basic Structure Data Mart #1 OLAP (ROLAP, MOLAP,HOLAP) dimensional access subject oriented user group driven refresh frequency conforms to the Bus Data Mart #2 Data Mart #3 DW Bus DW Bus Corporate Staging Area User Access Ad Hoc Query Tools Reporting Tools and Writers Customized Applications Models: forecasting; scoring; allocating; data mining; scenario analysis; etc. Data Feed Data Feed Data Feed
The Business Dimensional Lifecycle Project Planning Early Critical Tasks definition scope readiness assessment business justification Remaining Tasks Resource requirements and identification Schedule construction and integrations
The Business Dimensional Lifecycle Business Requirements Definition Critical to success Designers must understand the business needs A plan to extract users needs and to understand them must be developed.
The Business Dimensional Lifecycle Three project tracks follow the  business requirements definition  process: Data track Technology track Application track
The Business Dimensional Lifecycle Data Track Dimensional modeling Physical design Data staging design and development
The Business Dimensional Lifecycle Technology Track Technical architecture design Things to consider: business requirements current technical environment planned strategic technical directions
The Business Dimensional Lifecycle Application Track Product identification, selection, and installation End user application development Configuring the metadata repository access Building specialized applications
The Business Dimensional Lifecycle Deployment The integration of all the pieces of the puzzle. The best warehouse will fail if deployment is not properly planned Plan required prior to deployment are: education user support feedback enhancement/maintenance
The Business Dimensional Lifecycle Maintenance and Growth Work never stops!!! Critical to support and stay connected to the users to ensure the warehouse meets their needs. Watch performance and plan ahead (the backroom) Collect and analyze metrics regarding use and operation
The Business Dimensional Lifecycle Maintenance and Growth (cont) If you are successful, change is inevitable. Plan and prioritize future initiatives with user buy-in. Always plan for expansion and growth with each new increment or change.
The Business Dimensional Lifecycle Project Management Monitor project status Track issues Control change Project communication Project marketing Project politician Project visionary
The Business Dimensional Lifecycle Project Planning Business Requirement Definition Deployment Maintenance and Growth Project Management Dimensional Modeling Physical Design Data Staging Design & Development Technical Architecture Design Product Selection & Installation End-User Application Specification End-User Application Development
Project Planning & Management Who Wants the Warehouse? A single visionary user desirable because the focus remains manageable requires political leverage to make it work the need must have broad and definable impacts to show worth Multiple demands Many organizations want a data mart or warehouse Focus is spread, therefore politics and planning play a vital role
Project Planning & Management Who Wants the Warehouse? (cont) No identified need Organization wanting to get in the “warehouse” game More effort on the warehouse team to identify the need It is highly likely there will be one.
Project Planning & Management Determine Warehouse Readiness Do you have a strong business sponsor? Vision Politically savvy Connected Influential History of success Respected Realistic Understands the need and the process and can communicate it
Project Planning & Management Determine Warehouse Readiness (cont) Without this person you will fail Try to recruit multiple sponsors. Is there a real and identifiable business need? Does a strong partnership exist between IT and the business groups? What is the current analytical environment? How are things done now? What culture shock will be created?
Project Planning & Management Determine Warehouse Readiness (cont) What is the feasibility? Is the data “dirty” beyond recovery? Is the target sources to dispersed and dynamic to achieve early and significant results?
Project Planning & Management Take the Readiness “Litmus Test” The test looks at: Sponsor Business Needs IT/Business Partnership Current Analytical Environment Feasibility A strong sponsor is the most important to get a high rating from the test Business needs and IT/Business Partnerships are secondary in importance
Project Planning & Management Addressing Readiness Issues High-level business requirements analysis Identify the strategic initiatives Identify the business metrics Identify the high impact and ROI areas Business Requirements Prioritization Look for high impact, ROI, and feasibility Proof of Concept
Project Planning & Management Develop the Initial Scope Keep the scope narrow and short to retain clarity The bigger the scope the more difficult it becomes to retain focus Always define the scope based on business requirements. Try to avoid deadlines or budget cycles from driving the scope.
Project Planning & Management Develop the Initial Scope (cont) Scope definition involves both IT and business representatives Make the scope have significance but ensure it is achievable and timely Start with a single or few data sources and a single business process Limit your initial user base (typically 25 - 35 people). Determine what management expects so success can be identified
Project Planning & Management Develop the Initial Scope (cont) Document the scope definition and success indicators Acknowledge that the scope will likely change Develop a plan to manage the change
Project Planning & Management Build the Business Justification Determine the costs Identify hardware and software costs (start-up and ongoing) Identify maintenance costs Internal staff needs  External resources (consultants, etc.) Operational support Support of growth pains
Project Planning & Management Build the Business Justification (cont) Determine the benefits (financial and other) Increased revenue Increased profit Increased customer satisfaction Expansion of a market or capability Increased employee productivity Reduction of capital investments (storage requirements, etc.) Protection against fraud and attack
Project Planning & Management Build the Business Justification (cont) It is important to monitor and track the business to identify and market impacts the warehouse has made Look for the tangibles and intangibles
Project Planning & Management Plan the Project Establish project identity Create a name Create documentation describing your project Make T-shirts, mugs, etc Market, market, market!!!
Project Planning & Management Plan the Project (cont) Staff up Project Manager Business Lead Business Analyst Data Modeler DW DBA Data Staging System Designer End User Application Developer DW Educator Technical/Security Architect Technical Support Specialists Data Staging Programmers Data Steward DW QA Analyst
Project Planning & Management Develop the Project Plan Key (frequently update your plan) The nature of a DW project in cyclic and resembles a spiral approach Identify key milestones Develop a high-level and detailed plan
Project Planning & Management Manage the Project Matrix management is often used because of the numerous interlaced roles Data issues may lay waste to the best devised plans (plan for the unexpected) The project will likely increase in visibility (manage expectations) Iterative/sliding window development requires multiple teams work in sync (communication)
Project Planning & Management Manage the Project (cont) Conduct a project kickoff meeting Identify the team, roles, and responsibilities Identify the scope Identify goals Identify the schedule Review the preliminary PMP Conduct preliminary education
Project Planning & Management Monitor the Project Status Frequent communication Project status meetings Team meetings Project status reports Customer reporting
Collecting the Requirements The old theory was not to include the users in the early stages. Build it and they will come. This proved to be the demise of many early warehouse initiatives. A formal requirement (but flexible) is needed to document the users needs of the warehouse.
Collecting the Requirements This is a difficult process for many reasons. Key people may feel threatened and are not willing to cooperate. The informal decision process is typically not well documented and is dispersed. People have a difficult time thinking “out of the box” Terminology associated to warehousing often creates confusion and/or misinformation
Collecting the Requirements Talk with the business users first  Strive to understand how they do business Identify how decisions are made today Determine how they would like to make decisions today and tomorrow Do not just ask “what data do you need?”
Collecting the Requirements Talk with the IT community second Wait until some common sources and themes are identified by the business users before approaching IT Look for feasibility issues Start identifying technical issues such as platforms, formats, access, and politics Talk DBAs, DAs, application developers, an designers
Collecting the Requirements Getting the requirements (Interview VS Facilitation) Interviews tend to stay focused and work well with small groups Facilitated sessions work with larger groups and encourage “brainstorming” and cross pollination of ideas.
Collecting the Requirements Roles of the requirements team Lead interviewer Secondary interviewers Scribe Observers Facilitator
Collecting the Requirements Preparation for the interview Look at strategic plans that relate to the company or group you will talk with Look at the annual report. Important goals and initiatives will be identified and taken seriously by the company. Review marketing material Search the Internet for information Identify past attempts at similar projects
Collecting the Requirements Identify who will be interviewed Business Look horizontally across the organization to see the big picture Get as much detail as possible in the current area of focus (vertical) Request that your sponsor identify who should be interviewed.
Collecting the Requirements Identify who will be interviewed Technology The data gurus (these people have been around a long time and know the details) Application programmers Pseudo technical people within a business area DBAs Data modelers System administrators IT management to identify the future
Collecting the Requirements Develop an interview questionnaire Build an agenda for the interview sessions Prepare the interviewees Hold a single meeting with all interviewees to discuss the project, intentions, etc Set the tone for all interviews Encourage questions Enables you to identify good and bad candidates early (now you can plan for each person)
Collecting the Requirements Conduct the interview Remain within the roles established for the interview team Validate what you have collected with the user as soon as possible  Define terms with the users (profit, revenue, sales) Try to talk on their level and avoid using confusing technology terms (use their business lingo when possible)
Collecting the Requirements Conduct the interview Try to remain flexible during the interview process Meet with unexpected people Run past the allotted time Discuss topics somewhat out of the focus of the interview. Schedule breaks and limit the number of interview session per day to about five Continue to manage expectations
Collecting the Requirements Potential interview questions for an executive: What are the objectives of your organization? What are you trying to accomplish? How do you measure success? How do you know you are doing well? How often do you measure yourself? What are the key business issues you face today? What could prevent you from meeting these objectives? What would be the impact?
Collecting the Requirements Potential interview questions for an analyst: What are your groups objectives? How do you accomplish them? How do you achieve it? What are your success metrics? How do you know you are doing well? How often do you measure? What issues do you currently face? Describe your products, vendors, etc? Is there a natural hierarchy?
Collecting the Requirements Potential interview questions for an analyst: What type of analysis do you perform? What data is used? How do you get it? What do you do with it? What analysis would you like to perform?  What dynamic analysis needs do you have? Who drives these needs? How long does it take to perform? Are you able to conduct deeper levels of analysis? What analytical capabilities would you like?
Collecting the Requirements Potential interview questions for an analyst: Where are the bottlenecks in obtaining information? How much historical information is needed? How will improved information access impact you and your organization? What is the financial impact? What reports do you currently use? Which data elements on the reports are important? How is this information used? Is it combined with anything else?
Collecting the Requirements What to discuss with IT: Request an overview of the operational systems What are the current tools and technologies used to share information? What types of analyses are performed? How are detailed analyses supported and conducted? What are the data quality issues? Where do bottlenecks exist?
Collecting the Requirements What to discuss with IT: What concerns do you have about data warehousing in the organization? What roadblocks do you see? What expectations do you have of the warehouse? How do you expect the warehouse to impact you?
Collecting the Requirements Types of users you will interview Abused User  Involved in earlier attempts Unwilling to cooperate Overbooked User (To busy to meet) Comatose User Overzealous User Nonexistent User (Use technology to drive the needs)
Collecting the Requirements Wrap Up Review the interview results with the team Prepare and publish the results Establish what will be done next
Dimensional Modeling Jeffrey T. Edgell
The Dimensional Model More intuitive structure for presentation and reporting Likely predates the E/R approach General Mills & Dartmouth University developed a fact and dimension structure Nielsen Marketing Research used this on grocery and drug store auditing and scanner data in the 70s and 80s.
The Dimensional Model Dimensions are descriptive Facts are likely numeric and are measurement based Additive facts are vital to allow aggregation of many records during a retrieval Page 145 (A typical dimensional model)
The Argument for the Dimensional Model Tools can utilize a standardized framework Query tools can leverage against this for performance optimization High performance entry browsing is possible All queries can be initially constrained thus significantly increasing performance
The Argument for the Dimensional Model Easily adapts to unpredictable queries Extends to allow the addition of new tables or data elements will not require rebuilding the database from scratch data does not need to be reloaded existing reports and query tools do not need to be redesigned or implemented
The Argument for the Dimensional Model The model can be altered as follows without interruption: The addition of new facts (consistent with the defined grain) The addition of new dimensions The widening of a dimension table Changing the detail of a dimension to a lower level
The Argument for the Dimensional Model The dimensional model exhibits a predefined set of approaches used to deal with common issues. Slowly changing dimensions Heterogeneous products (track different lines of business i.e. checking & savings) Pay-in-advance data bases (look at individual components as well as the total) Event handling (no facts)
The Argument for the Dimensional Model Aggregation in a warehouse allows for query performance normally delegated to hardware to solve (greatly increasing $) A standard set of schemas for different business types and applications exist
The Bus Supports the incremental approach The data mart approach has often lead to development of warehouse absent of a corporate framework Stovepipe decision structures result Produces a uniform global structure eliminating the pocket or stovepipe data marts
The Bus Look at the entire enterprise as you design and build the data marts A high level architecture must be defined that explains the entire structure A detailed architecture must be developed to support each data mart as they are confronted
Conformed Dimensions Dimensions used to represent concepts across the enterprise must be standardized and agreed upon customer product time potentially not region (sales & management)
Conformed Dimensions Conformed dimensions must be carefully managed, maintained, and published to ensure consistency The conformed dimension represents the central source description of which everyone agrees If the conformed dimension approach is not observed, the bus will not properly function
Conformed Dimensions With conformed dimensions One dimension table relates to multiple facts Browsers are consistent with the dimension providing a unified view Rollups and meanings remain consistent across facts
Conformed Dimensions Design Lowest level of granularity possible (based on the lowest level defined) Use the sequential numeric key (surrogate key)
Conformed Facts Occurs during the definition of conformed dimensions Relates common measurements accurately Cost  Profit Unit price If facts are different use different names (marketing profit & sales profit) As much political as technical
When the Bus is not Required The business you are dealing with is intentionally segmented Components operated autonomously with no unified corporate view required Products or business areas are disjoint For example a company sells music and repairs train engines (no business or product synergy except at the very top)
The Components of the Dimensional Model Facts Dimensions Attributes The Bus (optional but highly suggested)
Operations Drill down and rollup  Example on page 168
Snowflakes What is it? The removal of low cardinality fields from a dimension placed in a new table and linked back with keys Complicates design detail Decreases performance Saves some space but normally not a significant amount Bit map indexes can not be effectively utilized
When a Snowflake is OK When used as a subdimesnion The data in the subd is related to the dimension are at different levels of granularity The data load times for the data are different Examples: County and state District and region Ship and battle group
Good Descriptive Dimensions Large dimension tables Highly descriptive Without good descriptive dimensions, the warehouse is not useful Use: full words, no missing values (null), QA, metadata
Common Dimension Techniques Time example figure 5.7 page 176 Address example page 178 Commercial address example page 179
Slowly Changing Dimensions What to do: Type 0: Ignore the change Type 1: Overwrite the changed attribute Type 2: Add a new dimension record with new value of the surrogate key Type 3: Add an “old value” field
Slowly Changing Dimensions Ignore the change Not typically a good solution to the problem, but is done. Overwrite the changed attribute Valid when correcting a value from the source Add a new dimension record with a generalized key Retains history of a changed product
Slowly Changing Dimensions Add an “old value” field Valid when on the previous change is needed for decision making
Slowly Changing Dimensions Type 2 example: Change in product (bottle changes from platic to glass) Key 001 002 Type Plastic Glass SKU 1234 1234
Slowly Changing Dimensions Type 3 example: Regional divisions of a company changes (only one historical change is supported) Region  Gold Silver Platinum Bronze Old Region North South East West
The Monster Dimension It is a compromise Avoids creating copies of dimension records in a significantly large dimension Done to manage space and changes efficiently
The Monster Dimension Customer_Key name address city, state birth_date date_first_purchase income number_children education total_purchases credit_score Customer_Key name address city,state birth_date date_first_purchase Demographics_Key income_band number_children education_level total_purchases_band credit_group Basically constant May   change  with each  purchase Bands used to minimize  possibilities Example 1
The Monster Dimension Case 1 (Rapid change) Large dimensions can be dynamic because of the amount of information contained Certain aspects must be maintained in the dimension, over time, to understand impacts demographics customer data product lines (for companies in acquisition)
The Monster Dimension The solution to very dynamic large dimensions identify the dynamic areas of the dimension segment the hot areas into there own independent dimensions The relative static information remains in the original dimension
The Monster Dimension The trade off (plus) the warehouse can accurately retain significant changes in a dimension over time to slow the rate of change down extremely dynamic attributes should be banded to slow the rate of change All possible combinations in the dimension become finite (discrete) and are thus manageable
The Monster Dimension The trade off (minus) Loss of detail in the bands (no longer exact) Once bands are defined they must be enforced from that point on Slower browse performance required when combining the segmented table with the original table Impossible to combine the data without a single instance of a fact (nothing to relate the dimensions)
The Monster Dimension Employee Table name  address date_of_birth social_security_num … title years_with_company income division purchase_level Example 2 Employee Table name  address date_of_birth social_security_num Corporate Demographics position_grade income_band division service_years_band
Degenerate Dimensions/Key Definition - Critical data provided in the legacy environment that normally remains independent. Typically the old key from the current fact information you are using with no supporting data
Degenerate Dimensions/Key Likely found in the header of a file The other items have been absorbed in other dimensions customer, date, vendor, item The remaining item has no supporting attributes but is important CLIN, Requisition #, Order # Useful information and should be absorbed in the fact table
Degenerate Dimensions/Key Useful information and should be absorbed in the fact table If there is other supporting attributes, it becomes a typical dimension
Junk Dimensions Resident flags, status codes, and miscellaneous information persists after the dimensional design is near complete Alternatives: Place the flags in the fact tables Make each attribute a dimension Remove the attributes completely
Junk Dimensions Leave the flags in the fact tables likely sparse data no real browse entry capability can significantly increase the size of the fact table Remove the attributes from the design potentially critical information will be lost if they provide no relevance, remove them
Junk Dimensions Make a flag into it’s own dimension may greatly increase the number of  dimensions, increasing the size of the fact table can clutter and confuse the design Combine all relevant flags, etc. into a single dimension the number of possibilities remain finite information is retained
Keys, Keys, Keys Surrogate keys (always use)  4 byte integer (2 32  or two billion + integers) Date keys should use surrogates as well dates are typically 8 bytes -- saves 4 bytes per fact Do not use smart keys with embedded meanings Do not use legacy or production keys
Just the Facts Attempt to make all facts additive simplifies calculations across dimensions all numbers are not additive facts Semi-additive facts can be used but understand they are there averages, max, min Non-additive facts often are avoided but may have value weather conditions (non-discrete), non-discrete discriptions
Steps to Designing a Fact Table Time to choose: data mart (functional business area) grain of the fact table (what level of detail) dimensions associated to the data mart the facts relative to the data mart
Data Mart Single operational source data marts provide the least amount of risk Multiple operational source data marts typical provide more cross functional value Examples: (remember, processes you measure) Marketing Sales Inventory Productivity
Fact Table Grain Without this, dimensions can not be accurately defined Select as low of a grain as possible handles unexpected queries adapts readily to additional facts and dimensions delivers the most comprehensive solution Consumes more space Performance can be an issue
Fact Loads By record account for every transaction or activity recorded (ATM) Snapshot A picture of the related facts at a specific point in time (monthly reporting) Line item track and reflect the status of line item activity (PO)
Dimensions Once the grain is defined, basic dimensions will be evident from the grain (customer, time, etc.) Addition of other dimensions and junk dimensions All dimensions can not be at a lower level of granularity than the lowest fact table grain
Identifying Facts The grain of the fact table dictates the facts All facts must be at the same level Individual transaction tables typically have 1 fact (the numeric value of the transaction) Snap shot and line item fact tables will likely contain multiple facts in that multiple additive facts are captured Keep all three types separated
Fact Table Families Process chain (supply chain, linear) fact table represents each step in the process RFI-RFP-RFQ-Contact-Delivery supply chain process example: page 200 each fact is connected on the bus Value Circle (parallel measurement) health care (example page 202) retail
Fact Table Families Heterogeneous Product Schemas Service offered by the business are distinct and separate banking (checking, savings, loans, etc.) Insurance (life, home, auto, etc.) Transaction an Snapshot Schemas Snapshot (periodic picture) example page 210 Transaction (activity detail) example page 207
Aggregate Families Used to improve query performance Typically roll ups of facts along a dimension for anticipated reporting and querying Aggregate tables can also be used to combine details from two fact tables of varying granularity
Factless Fact Tables Used for two reasons: record an activity (student attendance page 213) answers what the most popular classes were what days are frequently missed Coverage (account for activity that may not have happened) (example page 215) An entry is placed in the fact table for all item of interest answers questions regarding what did and did not have activity

Warehouse components

  • 1.
    The Basic StructureExtract Source Data Extract Storage: flat files (fastest); RDBMS; other Processing: clean; prune; combine; remove duplication standardize conform dimensions store awaiting replication export to data marts No user query services Data Staging Area Data Mart #1 OLAP (ROLAP, MOLAP,HOLAP) dimensional access subject oriented user group driven refresh frequency conforms to the Bus Data Mart #2 Data Mart #3 Populate, replicate, recover DW Bus DW Bus Corporate View
  • 2.
    The Basic StructureData Mart #1 OLAP (ROLAP, MOLAP,HOLAP) dimensional access subject oriented user group driven refresh frequency conforms to the Bus Data Mart #2 Data Mart #3 DW Bus DW Bus Corporate Staging Area User Access Ad Hoc Query Tools Reporting Tools and Writers Customized Applications Models: forecasting; scoring; allocating; data mining; scenario analysis; etc. Data Feed Data Feed Data Feed
  • 3.
    The Business DimensionalLifecycle Project Planning Early Critical Tasks definition scope readiness assessment business justification Remaining Tasks Resource requirements and identification Schedule construction and integrations
  • 4.
    The Business DimensionalLifecycle Business Requirements Definition Critical to success Designers must understand the business needs A plan to extract users needs and to understand them must be developed.
  • 5.
    The Business DimensionalLifecycle Three project tracks follow the business requirements definition process: Data track Technology track Application track
  • 6.
    The Business DimensionalLifecycle Data Track Dimensional modeling Physical design Data staging design and development
  • 7.
    The Business DimensionalLifecycle Technology Track Technical architecture design Things to consider: business requirements current technical environment planned strategic technical directions
  • 8.
    The Business DimensionalLifecycle Application Track Product identification, selection, and installation End user application development Configuring the metadata repository access Building specialized applications
  • 9.
    The Business DimensionalLifecycle Deployment The integration of all the pieces of the puzzle. The best warehouse will fail if deployment is not properly planned Plan required prior to deployment are: education user support feedback enhancement/maintenance
  • 10.
    The Business DimensionalLifecycle Maintenance and Growth Work never stops!!! Critical to support and stay connected to the users to ensure the warehouse meets their needs. Watch performance and plan ahead (the backroom) Collect and analyze metrics regarding use and operation
  • 11.
    The Business DimensionalLifecycle Maintenance and Growth (cont) If you are successful, change is inevitable. Plan and prioritize future initiatives with user buy-in. Always plan for expansion and growth with each new increment or change.
  • 12.
    The Business DimensionalLifecycle Project Management Monitor project status Track issues Control change Project communication Project marketing Project politician Project visionary
  • 13.
    The Business DimensionalLifecycle Project Planning Business Requirement Definition Deployment Maintenance and Growth Project Management Dimensional Modeling Physical Design Data Staging Design & Development Technical Architecture Design Product Selection & Installation End-User Application Specification End-User Application Development
  • 14.
    Project Planning &Management Who Wants the Warehouse? A single visionary user desirable because the focus remains manageable requires political leverage to make it work the need must have broad and definable impacts to show worth Multiple demands Many organizations want a data mart or warehouse Focus is spread, therefore politics and planning play a vital role
  • 15.
    Project Planning &Management Who Wants the Warehouse? (cont) No identified need Organization wanting to get in the “warehouse” game More effort on the warehouse team to identify the need It is highly likely there will be one.
  • 16.
    Project Planning &Management Determine Warehouse Readiness Do you have a strong business sponsor? Vision Politically savvy Connected Influential History of success Respected Realistic Understands the need and the process and can communicate it
  • 17.
    Project Planning &Management Determine Warehouse Readiness (cont) Without this person you will fail Try to recruit multiple sponsors. Is there a real and identifiable business need? Does a strong partnership exist between IT and the business groups? What is the current analytical environment? How are things done now? What culture shock will be created?
  • 18.
    Project Planning &Management Determine Warehouse Readiness (cont) What is the feasibility? Is the data “dirty” beyond recovery? Is the target sources to dispersed and dynamic to achieve early and significant results?
  • 19.
    Project Planning &Management Take the Readiness “Litmus Test” The test looks at: Sponsor Business Needs IT/Business Partnership Current Analytical Environment Feasibility A strong sponsor is the most important to get a high rating from the test Business needs and IT/Business Partnerships are secondary in importance
  • 20.
    Project Planning &Management Addressing Readiness Issues High-level business requirements analysis Identify the strategic initiatives Identify the business metrics Identify the high impact and ROI areas Business Requirements Prioritization Look for high impact, ROI, and feasibility Proof of Concept
  • 21.
    Project Planning &Management Develop the Initial Scope Keep the scope narrow and short to retain clarity The bigger the scope the more difficult it becomes to retain focus Always define the scope based on business requirements. Try to avoid deadlines or budget cycles from driving the scope.
  • 22.
    Project Planning &Management Develop the Initial Scope (cont) Scope definition involves both IT and business representatives Make the scope have significance but ensure it is achievable and timely Start with a single or few data sources and a single business process Limit your initial user base (typically 25 - 35 people). Determine what management expects so success can be identified
  • 23.
    Project Planning &Management Develop the Initial Scope (cont) Document the scope definition and success indicators Acknowledge that the scope will likely change Develop a plan to manage the change
  • 24.
    Project Planning &Management Build the Business Justification Determine the costs Identify hardware and software costs (start-up and ongoing) Identify maintenance costs Internal staff needs External resources (consultants, etc.) Operational support Support of growth pains
  • 25.
    Project Planning &Management Build the Business Justification (cont) Determine the benefits (financial and other) Increased revenue Increased profit Increased customer satisfaction Expansion of a market or capability Increased employee productivity Reduction of capital investments (storage requirements, etc.) Protection against fraud and attack
  • 26.
    Project Planning &Management Build the Business Justification (cont) It is important to monitor and track the business to identify and market impacts the warehouse has made Look for the tangibles and intangibles
  • 27.
    Project Planning &Management Plan the Project Establish project identity Create a name Create documentation describing your project Make T-shirts, mugs, etc Market, market, market!!!
  • 28.
    Project Planning &Management Plan the Project (cont) Staff up Project Manager Business Lead Business Analyst Data Modeler DW DBA Data Staging System Designer End User Application Developer DW Educator Technical/Security Architect Technical Support Specialists Data Staging Programmers Data Steward DW QA Analyst
  • 29.
    Project Planning &Management Develop the Project Plan Key (frequently update your plan) The nature of a DW project in cyclic and resembles a spiral approach Identify key milestones Develop a high-level and detailed plan
  • 30.
    Project Planning &Management Manage the Project Matrix management is often used because of the numerous interlaced roles Data issues may lay waste to the best devised plans (plan for the unexpected) The project will likely increase in visibility (manage expectations) Iterative/sliding window development requires multiple teams work in sync (communication)
  • 31.
    Project Planning &Management Manage the Project (cont) Conduct a project kickoff meeting Identify the team, roles, and responsibilities Identify the scope Identify goals Identify the schedule Review the preliminary PMP Conduct preliminary education
  • 32.
    Project Planning &Management Monitor the Project Status Frequent communication Project status meetings Team meetings Project status reports Customer reporting
  • 33.
    Collecting the RequirementsThe old theory was not to include the users in the early stages. Build it and they will come. This proved to be the demise of many early warehouse initiatives. A formal requirement (but flexible) is needed to document the users needs of the warehouse.
  • 34.
    Collecting the RequirementsThis is a difficult process for many reasons. Key people may feel threatened and are not willing to cooperate. The informal decision process is typically not well documented and is dispersed. People have a difficult time thinking “out of the box” Terminology associated to warehousing often creates confusion and/or misinformation
  • 35.
    Collecting the RequirementsTalk with the business users first Strive to understand how they do business Identify how decisions are made today Determine how they would like to make decisions today and tomorrow Do not just ask “what data do you need?”
  • 36.
    Collecting the RequirementsTalk with the IT community second Wait until some common sources and themes are identified by the business users before approaching IT Look for feasibility issues Start identifying technical issues such as platforms, formats, access, and politics Talk DBAs, DAs, application developers, an designers
  • 37.
    Collecting the RequirementsGetting the requirements (Interview VS Facilitation) Interviews tend to stay focused and work well with small groups Facilitated sessions work with larger groups and encourage “brainstorming” and cross pollination of ideas.
  • 38.
    Collecting the RequirementsRoles of the requirements team Lead interviewer Secondary interviewers Scribe Observers Facilitator
  • 39.
    Collecting the RequirementsPreparation for the interview Look at strategic plans that relate to the company or group you will talk with Look at the annual report. Important goals and initiatives will be identified and taken seriously by the company. Review marketing material Search the Internet for information Identify past attempts at similar projects
  • 40.
    Collecting the RequirementsIdentify who will be interviewed Business Look horizontally across the organization to see the big picture Get as much detail as possible in the current area of focus (vertical) Request that your sponsor identify who should be interviewed.
  • 41.
    Collecting the RequirementsIdentify who will be interviewed Technology The data gurus (these people have been around a long time and know the details) Application programmers Pseudo technical people within a business area DBAs Data modelers System administrators IT management to identify the future
  • 42.
    Collecting the RequirementsDevelop an interview questionnaire Build an agenda for the interview sessions Prepare the interviewees Hold a single meeting with all interviewees to discuss the project, intentions, etc Set the tone for all interviews Encourage questions Enables you to identify good and bad candidates early (now you can plan for each person)
  • 43.
    Collecting the RequirementsConduct the interview Remain within the roles established for the interview team Validate what you have collected with the user as soon as possible Define terms with the users (profit, revenue, sales) Try to talk on their level and avoid using confusing technology terms (use their business lingo when possible)
  • 44.
    Collecting the RequirementsConduct the interview Try to remain flexible during the interview process Meet with unexpected people Run past the allotted time Discuss topics somewhat out of the focus of the interview. Schedule breaks and limit the number of interview session per day to about five Continue to manage expectations
  • 45.
    Collecting the RequirementsPotential interview questions for an executive: What are the objectives of your organization? What are you trying to accomplish? How do you measure success? How do you know you are doing well? How often do you measure yourself? What are the key business issues you face today? What could prevent you from meeting these objectives? What would be the impact?
  • 46.
    Collecting the RequirementsPotential interview questions for an analyst: What are your groups objectives? How do you accomplish them? How do you achieve it? What are your success metrics? How do you know you are doing well? How often do you measure? What issues do you currently face? Describe your products, vendors, etc? Is there a natural hierarchy?
  • 47.
    Collecting the RequirementsPotential interview questions for an analyst: What type of analysis do you perform? What data is used? How do you get it? What do you do with it? What analysis would you like to perform? What dynamic analysis needs do you have? Who drives these needs? How long does it take to perform? Are you able to conduct deeper levels of analysis? What analytical capabilities would you like?
  • 48.
    Collecting the RequirementsPotential interview questions for an analyst: Where are the bottlenecks in obtaining information? How much historical information is needed? How will improved information access impact you and your organization? What is the financial impact? What reports do you currently use? Which data elements on the reports are important? How is this information used? Is it combined with anything else?
  • 49.
    Collecting the RequirementsWhat to discuss with IT: Request an overview of the operational systems What are the current tools and technologies used to share information? What types of analyses are performed? How are detailed analyses supported and conducted? What are the data quality issues? Where do bottlenecks exist?
  • 50.
    Collecting the RequirementsWhat to discuss with IT: What concerns do you have about data warehousing in the organization? What roadblocks do you see? What expectations do you have of the warehouse? How do you expect the warehouse to impact you?
  • 51.
    Collecting the RequirementsTypes of users you will interview Abused User Involved in earlier attempts Unwilling to cooperate Overbooked User (To busy to meet) Comatose User Overzealous User Nonexistent User (Use technology to drive the needs)
  • 52.
    Collecting the RequirementsWrap Up Review the interview results with the team Prepare and publish the results Establish what will be done next
  • 53.
  • 54.
    The Dimensional ModelMore intuitive structure for presentation and reporting Likely predates the E/R approach General Mills & Dartmouth University developed a fact and dimension structure Nielsen Marketing Research used this on grocery and drug store auditing and scanner data in the 70s and 80s.
  • 55.
    The Dimensional ModelDimensions are descriptive Facts are likely numeric and are measurement based Additive facts are vital to allow aggregation of many records during a retrieval Page 145 (A typical dimensional model)
  • 56.
    The Argument forthe Dimensional Model Tools can utilize a standardized framework Query tools can leverage against this for performance optimization High performance entry browsing is possible All queries can be initially constrained thus significantly increasing performance
  • 57.
    The Argument forthe Dimensional Model Easily adapts to unpredictable queries Extends to allow the addition of new tables or data elements will not require rebuilding the database from scratch data does not need to be reloaded existing reports and query tools do not need to be redesigned or implemented
  • 58.
    The Argument forthe Dimensional Model The model can be altered as follows without interruption: The addition of new facts (consistent with the defined grain) The addition of new dimensions The widening of a dimension table Changing the detail of a dimension to a lower level
  • 59.
    The Argument forthe Dimensional Model The dimensional model exhibits a predefined set of approaches used to deal with common issues. Slowly changing dimensions Heterogeneous products (track different lines of business i.e. checking & savings) Pay-in-advance data bases (look at individual components as well as the total) Event handling (no facts)
  • 60.
    The Argument forthe Dimensional Model Aggregation in a warehouse allows for query performance normally delegated to hardware to solve (greatly increasing $) A standard set of schemas for different business types and applications exist
  • 61.
    The Bus Supportsthe incremental approach The data mart approach has often lead to development of warehouse absent of a corporate framework Stovepipe decision structures result Produces a uniform global structure eliminating the pocket or stovepipe data marts
  • 62.
    The Bus Lookat the entire enterprise as you design and build the data marts A high level architecture must be defined that explains the entire structure A detailed architecture must be developed to support each data mart as they are confronted
  • 63.
    Conformed Dimensions Dimensionsused to represent concepts across the enterprise must be standardized and agreed upon customer product time potentially not region (sales & management)
  • 64.
    Conformed Dimensions Conformeddimensions must be carefully managed, maintained, and published to ensure consistency The conformed dimension represents the central source description of which everyone agrees If the conformed dimension approach is not observed, the bus will not properly function
  • 65.
    Conformed Dimensions Withconformed dimensions One dimension table relates to multiple facts Browsers are consistent with the dimension providing a unified view Rollups and meanings remain consistent across facts
  • 66.
    Conformed Dimensions DesignLowest level of granularity possible (based on the lowest level defined) Use the sequential numeric key (surrogate key)
  • 67.
    Conformed Facts Occursduring the definition of conformed dimensions Relates common measurements accurately Cost Profit Unit price If facts are different use different names (marketing profit & sales profit) As much political as technical
  • 68.
    When the Busis not Required The business you are dealing with is intentionally segmented Components operated autonomously with no unified corporate view required Products or business areas are disjoint For example a company sells music and repairs train engines (no business or product synergy except at the very top)
  • 69.
    The Components ofthe Dimensional Model Facts Dimensions Attributes The Bus (optional but highly suggested)
  • 70.
    Operations Drill downand rollup Example on page 168
  • 71.
    Snowflakes What isit? The removal of low cardinality fields from a dimension placed in a new table and linked back with keys Complicates design detail Decreases performance Saves some space but normally not a significant amount Bit map indexes can not be effectively utilized
  • 72.
    When a Snowflakeis OK When used as a subdimesnion The data in the subd is related to the dimension are at different levels of granularity The data load times for the data are different Examples: County and state District and region Ship and battle group
  • 73.
    Good Descriptive DimensionsLarge dimension tables Highly descriptive Without good descriptive dimensions, the warehouse is not useful Use: full words, no missing values (null), QA, metadata
  • 74.
    Common Dimension TechniquesTime example figure 5.7 page 176 Address example page 178 Commercial address example page 179
  • 75.
    Slowly Changing DimensionsWhat to do: Type 0: Ignore the change Type 1: Overwrite the changed attribute Type 2: Add a new dimension record with new value of the surrogate key Type 3: Add an “old value” field
  • 76.
    Slowly Changing DimensionsIgnore the change Not typically a good solution to the problem, but is done. Overwrite the changed attribute Valid when correcting a value from the source Add a new dimension record with a generalized key Retains history of a changed product
  • 77.
    Slowly Changing DimensionsAdd an “old value” field Valid when on the previous change is needed for decision making
  • 78.
    Slowly Changing DimensionsType 2 example: Change in product (bottle changes from platic to glass) Key 001 002 Type Plastic Glass SKU 1234 1234
  • 79.
    Slowly Changing DimensionsType 3 example: Regional divisions of a company changes (only one historical change is supported) Region Gold Silver Platinum Bronze Old Region North South East West
  • 80.
    The Monster DimensionIt is a compromise Avoids creating copies of dimension records in a significantly large dimension Done to manage space and changes efficiently
  • 81.
    The Monster DimensionCustomer_Key name address city, state birth_date date_first_purchase income number_children education total_purchases credit_score Customer_Key name address city,state birth_date date_first_purchase Demographics_Key income_band number_children education_level total_purchases_band credit_group Basically constant May change with each purchase Bands used to minimize possibilities Example 1
  • 82.
    The Monster DimensionCase 1 (Rapid change) Large dimensions can be dynamic because of the amount of information contained Certain aspects must be maintained in the dimension, over time, to understand impacts demographics customer data product lines (for companies in acquisition)
  • 83.
    The Monster DimensionThe solution to very dynamic large dimensions identify the dynamic areas of the dimension segment the hot areas into there own independent dimensions The relative static information remains in the original dimension
  • 84.
    The Monster DimensionThe trade off (plus) the warehouse can accurately retain significant changes in a dimension over time to slow the rate of change down extremely dynamic attributes should be banded to slow the rate of change All possible combinations in the dimension become finite (discrete) and are thus manageable
  • 85.
    The Monster DimensionThe trade off (minus) Loss of detail in the bands (no longer exact) Once bands are defined they must be enforced from that point on Slower browse performance required when combining the segmented table with the original table Impossible to combine the data without a single instance of a fact (nothing to relate the dimensions)
  • 86.
    The Monster DimensionEmployee Table name address date_of_birth social_security_num … title years_with_company income division purchase_level Example 2 Employee Table name address date_of_birth social_security_num Corporate Demographics position_grade income_band division service_years_band
  • 87.
    Degenerate Dimensions/Key Definition- Critical data provided in the legacy environment that normally remains independent. Typically the old key from the current fact information you are using with no supporting data
  • 88.
    Degenerate Dimensions/Key Likelyfound in the header of a file The other items have been absorbed in other dimensions customer, date, vendor, item The remaining item has no supporting attributes but is important CLIN, Requisition #, Order # Useful information and should be absorbed in the fact table
  • 89.
    Degenerate Dimensions/Key Usefulinformation and should be absorbed in the fact table If there is other supporting attributes, it becomes a typical dimension
  • 90.
    Junk Dimensions Residentflags, status codes, and miscellaneous information persists after the dimensional design is near complete Alternatives: Place the flags in the fact tables Make each attribute a dimension Remove the attributes completely
  • 91.
    Junk Dimensions Leavethe flags in the fact tables likely sparse data no real browse entry capability can significantly increase the size of the fact table Remove the attributes from the design potentially critical information will be lost if they provide no relevance, remove them
  • 92.
    Junk Dimensions Makea flag into it’s own dimension may greatly increase the number of dimensions, increasing the size of the fact table can clutter and confuse the design Combine all relevant flags, etc. into a single dimension the number of possibilities remain finite information is retained
  • 93.
    Keys, Keys, KeysSurrogate keys (always use) 4 byte integer (2 32 or two billion + integers) Date keys should use surrogates as well dates are typically 8 bytes -- saves 4 bytes per fact Do not use smart keys with embedded meanings Do not use legacy or production keys
  • 94.
    Just the FactsAttempt to make all facts additive simplifies calculations across dimensions all numbers are not additive facts Semi-additive facts can be used but understand they are there averages, max, min Non-additive facts often are avoided but may have value weather conditions (non-discrete), non-discrete discriptions
  • 95.
    Steps to Designinga Fact Table Time to choose: data mart (functional business area) grain of the fact table (what level of detail) dimensions associated to the data mart the facts relative to the data mart
  • 96.
    Data Mart Singleoperational source data marts provide the least amount of risk Multiple operational source data marts typical provide more cross functional value Examples: (remember, processes you measure) Marketing Sales Inventory Productivity
  • 97.
    Fact Table GrainWithout this, dimensions can not be accurately defined Select as low of a grain as possible handles unexpected queries adapts readily to additional facts and dimensions delivers the most comprehensive solution Consumes more space Performance can be an issue
  • 98.
    Fact Loads Byrecord account for every transaction or activity recorded (ATM) Snapshot A picture of the related facts at a specific point in time (monthly reporting) Line item track and reflect the status of line item activity (PO)
  • 99.
    Dimensions Once thegrain is defined, basic dimensions will be evident from the grain (customer, time, etc.) Addition of other dimensions and junk dimensions All dimensions can not be at a lower level of granularity than the lowest fact table grain
  • 100.
    Identifying Facts Thegrain of the fact table dictates the facts All facts must be at the same level Individual transaction tables typically have 1 fact (the numeric value of the transaction) Snap shot and line item fact tables will likely contain multiple facts in that multiple additive facts are captured Keep all three types separated
  • 101.
    Fact Table FamiliesProcess chain (supply chain, linear) fact table represents each step in the process RFI-RFP-RFQ-Contact-Delivery supply chain process example: page 200 each fact is connected on the bus Value Circle (parallel measurement) health care (example page 202) retail
  • 102.
    Fact Table FamiliesHeterogeneous Product Schemas Service offered by the business are distinct and separate banking (checking, savings, loans, etc.) Insurance (life, home, auto, etc.) Transaction an Snapshot Schemas Snapshot (periodic picture) example page 210 Transaction (activity detail) example page 207
  • 103.
    Aggregate Families Usedto improve query performance Typically roll ups of facts along a dimension for anticipated reporting and querying Aggregate tables can also be used to combine details from two fact tables of varying granularity
  • 104.
    Factless Fact TablesUsed for two reasons: record an activity (student attendance page 213) answers what the most popular classes were what days are frequently missed Coverage (account for activity that may not have happened) (example page 215) An entry is placed in the fact table for all item of interest answers questions regarding what did and did not have activity