Download to read offline
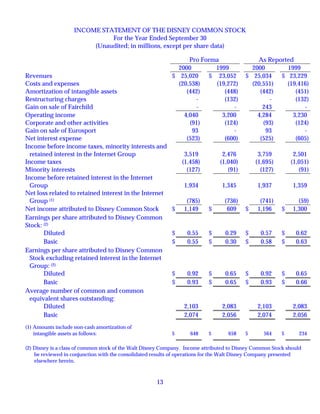
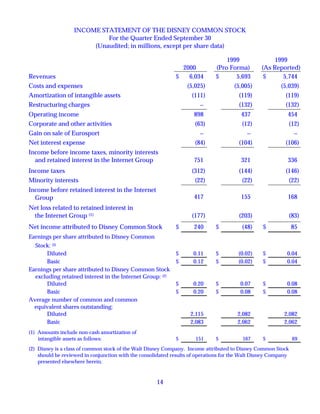
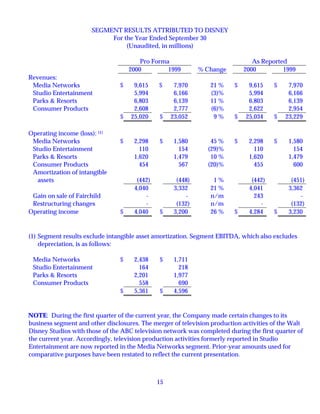
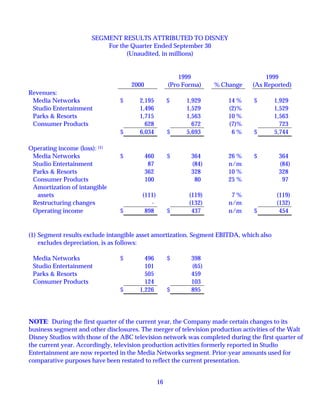
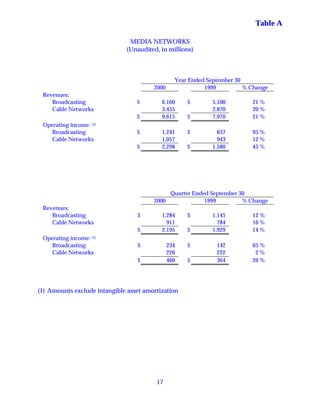
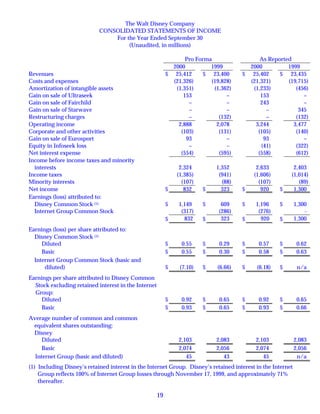
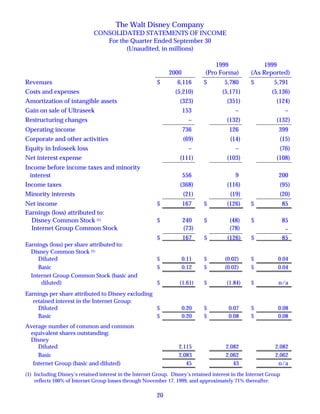
The Walt Disney Company reported higher earnings for both the fiscal year and quarter ended September 30, 2000. For the year, earnings per share increased 42% excluding Disney's interest in the Internet Group and 90% including it, while revenues grew 9% and operating income rose 26%. In the fourth quarter, EPS rose 82% excluding the Internet Group and diluted EPS was $0.11 including it, with revenues up 6% and operating income increasing 58%. Media Networks, Parks & Resorts, and Studio Entertainment saw revenue and profit gains for the year and quarter.


