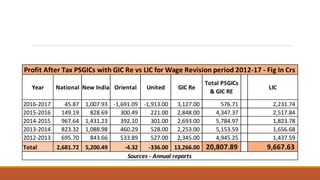
This document discusses the performance of PSGICs (Public Sector General Insurance Companies) and GIC Re compared to LIC for the wage revision period of 2012-2017. Some key points:
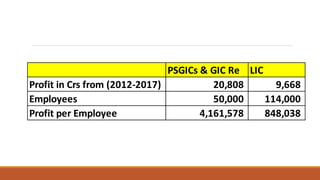
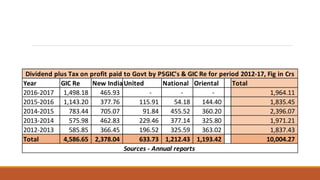
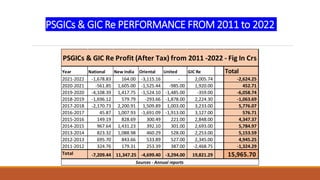
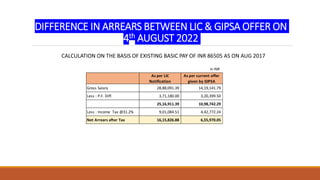
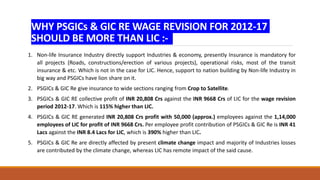
- PSGICs and GIC Re had total profits of Rs. 20,808 crores vs Rs. 9,668 crores for LIC, paying higher taxes and dividends to the government.
- On a per employee basis, PSGICs and GIC Re generated Rs. 4.16 crores profit per employee compared to Rs. 0.85 crores for LIC.
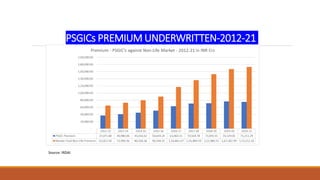
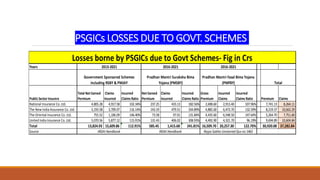
- PSGICs support national development through mandatory insurance coverage and creation of specialized insurance pools.