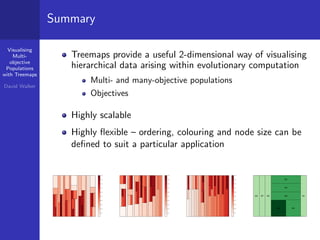
Visualising
Multi-
objective
Populations
with Treemaps
David Walker
Visualising Multi-objective Populations
with Treemaps
David Walker
College of Engineering, Mathematics and Physical Sciences
University of Exeter, UK
VizGEC 2015
Visualising
Multi-
objective
Populations
with Treemaps
David Walker
Multi-objective Visualisation
Visualising multi-objective populations is an important
aspect of EC
0.0 0.2 0.4 0.6 0.8 1.00.0
0.2
0.4
0.6
0.8
1.0
−1.5 −1.0 −0.5 0.0 0.5 1.0
−1.0
−0.5
0.0
0.5
1.0
1.5
f1 f2 f3 f4 f5
0.0
0.5
1.0
1.5
2.0
Visualising
Multi-
objective
Populations
with Treemaps
David Walker
Treemaps
Visualise hierarchical data (often used for clustering)
Each node has an associated “value”
The value of a node is represented by the amount of space
assigned to that node in the treemap
0.1
0.2
0.3
0.4
0.5
0.6
0.7
0.8
0.9
1.0
Goal:
Represent a multi-objective
population using a treemap
Visualising
Multi-
objective
Populations
with Treemaps
David Walker
Multi-objective Trees
Step 1: Pareto sorting
Construct a partial ordering of individuals using Pareto sorting
– this results in a graph
Step 2: Prune edges using dominance distance
Remove edges such that each node has exactly one parent node
(retain the parent with the smallest dominance distance) and
insert an artificial “root” node using the global best
A
B
C
D
E
F
nr
A
B
C
D
E
F
Visualising
Multi-
objective
Populations
with Treemaps
David Walker
Multi-objective Treemaps
0 2 4 6 8 10
f1
0
2
4
6
8
10
f2
A
B
C
D
E
F
G
H
I
A
D
I E
F
B
G
H
C
Visualising
Multi-
objective
Populations
with Treemaps
David Walker
An Example: DTLZ2
0.1
0.2
0.3
0.4
0.5
0.6
0.7
0.8
0.9
1.0
Visualising
Multi-
objective
Populations
with Treemaps
David Walker
Enhancing the Treemap
Order the nodes to enhance the clarity of the treemap
0.1
0.2
0.3
0.4
0.5
0.6
0.7
0.8
0.9
1.0
0.1
0.2
0.3
0.4
0.5
0.6
0.7
0.8
0.9
1.0
Many-objective Treemaps: 3- and 5-objective DTLZ2
0.1
0.2
0.3
0.4
0.5
0.6
0.7
0.8
0.9
1.0
0.1
0.2
0.3
0.4
0.5
0.6
0.7
0.8
0.9
1.0
Visualising
Multi-
objective
Populations
with Treemaps
David Walker
Circular Treemaps
In the treemaps presented so far it is difficult to observe
dominance relationships – instead use circular treemaps
0.1
0.2
0.3
0.4
0.5
0.6
0.7
0.8
0.9
1.0
A
A
Visualising
Multi-
objective
Populations
with Treemaps
David Walker
Many-objective Circular Treemaps
3-objective DTLZ2
0.1
0.2
0.3
0.4
0.5
0.6
0.7
0.8
0.9
1.0
5-objective DTLZ2
0.1
0.2
0.3
0.4
0.5
0.6
0.7
0.8
0.9
1.0
Visualising
Multi-
objective
Populations
with Treemaps
David Walker
Revealing Additional Information
Visualising Crowding Distance – as used in NSGA-II
0 2 4 6 8 10 12 14 16
f1
0
2
4
6
8
10
12
14
16
18
f2
Visualising
Multi-
objective
Populations
with Treemaps
David Walker
Visualising Objectives
Hughes defined a many-objective radar design problem
comprising 9 objectives, which group into three categories:
1 range objectives
2 velocity objectives
3 transmission time
M3 M7 M5
M9 M4
M8
M6
M2
M1
Visualising
Multi-
objective
Populations
with Treemaps
David Walker
Summary
Treemaps provide a useful 2-dimensional way of visualising
hierarchical data arising within evolutionary computation
Multi- and many-objective populations
Objectives
Highly scalable
Highly flexible – ordering, colouring and node size can be
defined to suit a particular application
0.1
0.2
0.3
0.4
0.5
0.6
0.7
0.8
0.9
1.0
0.1
0.2
0.3
0.4
0.5
0.6
0.7
0.8
0.9
1.0
0.1
0.2
0.3
0.4
0.5
0.6
0.7
0.8
0.9
1.0
M3 M7 M5
M9 M4
M8
M6
M2
M1
Visualising
Multi-
objective
Populations
with Treemaps
David Walker
Future Work
Expand the range of applications within evolutionary
computation (genetic programming solutions)
Further refine the treemap layout algorithms to suit the
use of treemaps within evolutionary computation
Identify other means of constructing trees to represent
multi-objective populations that are not adversely affected
by treemaps

Visualising Multi-objective Populations with Treemaps