SlideShare a Scribd company logo
Page | 1
Table of Contents
1 Introduction .............................................................................................................4
1.1 Motivation.........................................................................................................4
1.2 Visual Obstacle Avoidance Problem................................................................5
1.2.1 Definitions.................................................................................................5
1.2.2 Problem Statement...................................................................................6
2 Image Processing.....................................................................................................7
2.1 Understanding the Problem ..............................................................................7
2.2 Multi-View Relations .......................................................................................8
2.2.1 Two - view geometry................................................................................8
2.3 Epipolar Geometry............................................................................................8
Figure 2.1: Epipolar geometry of a scene from two images ......................................9
2.3.1 Properties of the Fundamental Matrix ..................................................9
2.3.2 Computation of the Fundamental Matrix ...........................................10
2.3.3 Random Sampling Consensus...............................................................10
2.3.4 Normalized 8 point algorithm...............................................................11
2.4 Homography ...................................................................................................12
2.4.1 Planar Homography ..............................................................................13
2.4.2 Homography between parallel planes of a scene.................................14
2.4.3 Image Warping.......................................................................................14
2.4.4 Computing the homography matrix.....................................................15
2.5 Edge Detection................................................................................................16
2.6 Corner Detection.............................................................................................17
2.7 Image Segmentation .......................................................................................18
2.7.1 K-means clustering ................................................................................19
3 DESIGN ................................................................................................................20
3.1 Requirements ..................................................................................................21
3.2 Design Methodology ......................................................................................22
3.2.1 System Design Model.............................................................................22
3.4 Hardware Constraints .....................................................................................23
Page | 2
3.5 Development Environment.............................................................................23
3.5.1 The MATLAB Environment.................................................................24
3.5.2 Differences between C and MATLAB .................................................24
3.6 Design Plan.....................................................................................................26
3.6.1 Descriptions of Sub-problems...............................................................27
4 IMPLEMENTATION ...........................................................................................29
4.1 Point Correspondences ...................................................................................29
4.1.1 Corner detection.....................................................................................29
4.2.2 Matching Corners ..................................................................................29
4.3 Homography Computation .............................................................................33
4.4 Warping Images..............................................................................................37
4.4.1 Warp Comparator .................................................................................40
4.5 Fundamental Matrix Computation..................................................................42
4.6 Image Segmentation and Edge Detection.......................................................42
4.6.1 Colour Segmentation and Edge Detection...........................................42
4.6.2 Object Segmentation..............................................................................43
4.8 Contour matching.........................................................................................47
5 Evaluation..............................................................................................................49
5.1 Point Correspondences ...................................................................................49
5.1.1 Corner detection.....................................................................................49
5.3.2 Matching correspondences....................................................................49
5.3 Computing homography and corner heights...................................................52
5.4 Computing epipolar geometry and contour heights........................................56
5.5 Image warping and obstacle detection............................................................57
5.6 Segmentation and obstacle detection..............................................................59
5.7 Summary of Evaluation ..................................................................................62
6 Appendix ...............................................................................................................63
Page | 3
Page | 4
1 Introduction
In this part, we will understand the motivation behind this work; the problem
statement and need to find the solution to the problem will be discussed; overall
objective & goal of the thesis will be described; its significance will be discussed; the
methodology & approach adapted will be explained briefly; the details of
contributions & publications will be cited; finally the format of the report will be
presented to enlighten you on what is going to be discussed in further chapters.
1.1 Motivation
All the aircrafts around the world, are currently using Traffic Alert & Collision
Avoidance System (TCAS) to reduce the risk of mid-air collision. The logic used to
avoid the collision has evolved over the course since 1970s when it was first brought
into application. The Main component of TCAS is onboard beacon radar surveillance
that monitors the local air traffic. The iterative process involves series of specific
logics that are implemented in codes to evaluate the system through simulation using
number of encounter models.
In recent years, the interest in Unmanned Air Vehicles grown rapidly. UAV cover a
wide range of applications from military, security & surveillance to commercial
services. In last two decades, the application and industry for UAV utilization has
grown tremendously. Industries around the world are understanding & becoming
aware of the functionality and capabilities of an autonomous unmanned aerial vehicle
that varies in shape, size, function & performance.
For growth and development of UAV industry and its application to continue on fast
scale, it is important for UAVs to operate freely and provide capable performance at
equivalent level of safety as compared to that of manned aircraft. Hence, Collision
avoidance is emerging as a key issue for UAV access to Civil Airspace.
Page | 5
1.2 Visual Obstacle Avoidance Problem
1.2.1 Definitions
In the literature, we found that there are two different research approaches in the name
of collision avoidance. In this thesis, we have used distinct definitions that enabled
us to break the problem into various categories. The most important difference that
is needed to be declared foremost is UAV avoiding collisions with stationary
obstacles as opposed to air traffic. Hence, we define:
Cooperative Collision Avoidance, where two aircrafts that are in communication with
one another, negotiate a mitigation strategy.
We are not concerned with Cooperative Collision Avoidance in this thesis. We are
considering our obstacle to be static (like buildings or terrain) or flying (like hostile
missiles).
Non-Cooperative Collision Avoidance, where the aircraft is solely responsible to find
a way to avoid the conflict scenario with the Terrain, Building or Intruder Aircraft.
NFZ (No Fly Zones): Distinguished/ sensitive area declared by the Military for safety
and security issues. Cannot be crossed, only avoid. Static in nature. E.g. Bhabha
Atomic Research Center.
In the thesis, we make use of standard definitions given by FAA or to be more specific
defined by Minimum Operation Performance Standards. These standard, where ever
required have been redefined to accommodate the context of our problem.
Near Mid Air Collision (NMAC) – when two aircrafts come within 500 feet
horizontally, which is 152.3metres & 500 feet vertically.
Safety Bubble – the sphere with radius 500 feet around the UAV at any instant, within
which any aircraft is an intruder, considered to be a potential conflict threat.
Conflict Scenario – an encounter scenario between two UAV’s where the intruder
comes within 500 feet.
Collision Scenario – an encounter where two UAV’s collide with one another if
avoidance fails.
Mid Air Collision (MAC) – when two UAV’s collide during the course of flight.
Page | 6
1.2.2 Problem Statement
The Effective Surveillance by any Autonomous UAV it is necessary to make sure
that it is able to perform in all situations. The UAV may be required to survey places
within a city or other natural terrain in friendly and hostile territory. However, in case
of an attack it becomes difficult to avoid the incoming missiles or even to recognize
any hostile attack.
The Aim of this Thesis is to provide an easy and practical method to avoid Attacks,
No Fly Zones and Collisions while also modifying the Flight Path of the UAV. This
is done by utilizing the camera on – board the UAV to survey the terrain and find any
hostile object or buildings that may fall in the flight path of the UAV or if the flight
path of the UAV passes through the firing range of the object.
The UAV is primarily a Surveillance UAV and has no weapons on board. The initial
coordinates for start and stop points as well as the coordinates to be surveyed must
be entered before the flight of the UAV starts. This provides the UAV with the
required reference points.
Page | 7
2 Image Processing
Several methods such as Odometry, Infrared and Laser have been used to achieve
Obstacle Detection, this project uses Vision, which is the processing of images
dependent on light radiated from the UAV’s environment to attempt to build a
reliable Obstacle Detection System.
A comprehensive study has been made of techniques from several fields of
Engineering that contribute to obstacle detection. This project is based on subsets of
three Obstacle Detection System Techniques. These are:
 Obstacle detection using planar homography and image warping (via comparison
to warped image)
 Obstacle detection using planar homography and image segmentation (via
computation of heights of segments)
 Obstacle detection using epipolar geometry, planar homography and edge
detection (via computation of heights along contours)
The ultimate goal of this project is in fact the evaluation of each of these “sub-
systems” in different operating environments or scenes, finally comparing and
contrasting their performances. The construction of a system that detects obstacles in
real time is not attempted. Rather, the aim is to write a MATLAB code that allows a
system to detect obstacles reliably.
2.1 Understanding the Problem
In order to perceive the world through Vision, the System must be able to recognize
certain characteristics of its immediate environment. This is done through the analysis
of images taken by a camera. The ability to recognize and differentiate textures,
shapes, colors, etc. is vital to the replication of human vision which is the ultimate
goal of all computer vision research. Perhaps the greatest challenge is the
interpretation of 2D images into 3D scenes since a significant proportion of a scene’s
characteristics are absent in its image. Moreover, a prior knowledge of the
environment (e.g. lighting, texture, background etc.) is required since they affect the
appearance of objects which the computer is trying to describe.
Computer vision problems can be subdivided into low-level and high level problems.
The former refers to the initial stages of image processing with very little other
knowledge of the environment and includes operations such as Edge Detection,
Boundary Drawing, etc. whereas the latter refers to highly task-specific operations
performed on presumably perfect data taken from low-level processes with some or
no additional data and includes operations such as Obstacle Detection, Boundary
Generation.
Page | 8
2.2 Multi-View Relations
Multi-view relations are the fundamental principles on which this project is based.
These include Epipolar Geometry and Planar Homography. The fact that different
views of the same object are somehow related is the basis behind Multi-View
Relations.
2.2.1 Two - view geometry
The relationship between two images of the same scene can be more than enough to
accomplish the task of obstacle detection to a reasonably reliable extent. The pair of
images can be obtained at the same time using two cameras or one after the other,
usually with the same camera moving relative to the scene.
2.3 Epipolar Geometry
Epipolar geometry is defined the internal projective geometry between two images.
The reason epipolar geometry is being studied here is because of its applications in
finding 2D co-ordinates of the same point of a scene on images taken from two
different camera positions. Epipolar lines are vital in narrowing down the possible
point matches on one image for a point in another image of the same scene. Planar
homography can then be used to estimate the heights of these points usually through
the edges, thus performing obstacle detection.
The epipolar geometry of a scene is not dependent on the structure of the scene, but
on the camera’s internal parameters and relative position. The epipolar geometry can
be expressed as its fundamental matrix. The matrix, denoted as F, is a 3x3 rank 2
matrix. The theory of epipolar geometry states that given a set of matching points x
and x’ in a 3-Dimensional space obtained from two separate views of the same scene,
the points satisfy the relation –
x’T
. Fx = 0
Page | 9
Figure 2.1: Epipolar geometry of a scene from two images
 The baseline can be defined as the line joining the two camera centers.
 The epipoles can be defined as the points of intersection of each image plane (for
each view) and the baseline.
 The epipolar plane can be defined as a plane containing the baseline. There may
be a series of such planes depending on a single parameter
 An epipolar line is basically the intersection between the image plane and the
epipolar plane, also intersecting at the epipoles.
2.3.1 Properties of the Fundamental Matrix
 The transpose of F represent the relationship between the two points x’ and x, in
the opposite order. i.e. xT
FT
x’ = 0
 I = FT
x’ represents the epipolar line corresponding to the point x in the second
image. That is the corresponding point x on the second image satisfies xT
I=0.
 The line I’=Fx contains the epipole e’ for any point x on the second image (other
than e). Similarly the line I=FT
x’ contains the epipole e. i.e. e’T
(Fx) for all values
of x and thus e’T
F=0 and similarly Fe=0.
X is the location of a point on the scene and x’ and x are its locations
on the images planes from camera Centers C’ and C respectively
Page | 10
 With 9 elements (being a 3X3 matrix) and the common scaling not being
important F would have eight degrees of freedom. However owing to the
constraint that det(F)=0, F has 7 - Degrees of Freedom
 F is not of full rank since Inverse Mapping is not possible. This is because of the
fact that with the pair of epipolar I’ and I lines corresponding to matching points,
any point on the second image on I is mapped on the same line I’.
From the relationship:
X’T
FX = 0
Where,
X = [x y 1]T
and X’ = [x’ y’ 1]T
and
f11 f12 f13
F = f21 f22 f23
f33 f32 f33
So
(f11x’ + f21y’ + f31)x + (f12x’ + f22y’ + f32)y + (f13x’ + f23y’ + f33) = 0
Therefore given the co-ordinates of a point X’ in the first image and the fundamental
matrix for the scene, it is possible to compute a line (the epipolar line) in the second
image on which the corresponding point X lies. This is basis used for finding
matching points between two images along their contours used in this project and it
will be essential in detecting the heights of these points above the ground plane which
is effectively performing the task of obstacle detection.
2.3.2 Computation of the Fundamental Matrix
The following shows how an ordinary least squares solution can be found to the
computation of the fundamental matrix.
We have the epipolar relation X’TFX = 0
x’1x1 x’1y1 x’1 y’1x1 y’1y1 y’1 x1y1 1
Af = : : : : : : : : f = 0
x’nxn x’nyn x’n y’nxn y’nyn y’n xnyn 1
2.3.3 Random Sampling Consensus
The Random Sampling Consensus (RANSAC) algorithm is for the robust fitting of
models when there are many data outliers. The RANSAC algorithm is studied here
because of its applications in the computations of parameters for several models
required for obstacle detection (epipolar geometry and planar homography).
Page | 11
Data samples may have a number of outliers that do not correspond to the intended
model. The classification of data into inliers and outliers can be a problem. Given a
set of ‘n’ data points, if the number of outliers is known as x, then the parameters of
the model can be estimated repeatedly with combinations of (n-x) elements and
keeping track of how many points agree with each of these models. Points agreeing
with a model are those that are within a threshold of the model and are calculated
using mathematical functions like Euclidian distance. The points are called the
consensus set. However this method becomes difficult to achieve when the number
of outliers are not known. The RANSAC algorithm does not have this drawback.
The method involves selecting a certain minimum number of elements from the data
sample randomly. The parameters of the model are estimated using these elements.
The support for the estimated model (i.e. the number of elements in the consensus
set) is noted by computing how many points are within the threshold. This process of
random selection, parameter estimation and support computation is repeated a
number of times and then the model with maximum support is chosen. The
parameters of the model are now estimated again but this time with all the elements
in the consensus set of the previously chosen model. This final model is the output of
the RANSAC algorithm.
RANSAC Algorithm
 Randomly select a sample of s data points from S and instantiate the model
from this subset
 Determine the set of data points Si, which are within a distance threshold t of
the model. The set Si is the consensus set of the sample and defines the inliers
of S.
 If the size of Si is greater than some threshold T, re-estimate the model using
all the points in Si and terminate.
 If the size of Si is less than T, select a new subset and repeat the above.
 After N trials the largest consensus set Si is selected and the model is re-
estimated using all the points in the subset Si
Figure 2.2: Algorithm for RANSAC
2.3.4 Normalized 8 point algorithm
This is the simplest method of computing the fundamental matrix. It involves first
normalizing the points, computing the value of F using a linear equation and
enforcing the singularity constraint on it and then de-normalizing F to give the actual
fundamental matrix.
The normalized 8-point algorithm is obviously not optimal since the significance of
all entries of F is not equal i.e. some entries are more constrained by the point-point
matches than others. Several optimizations can be performed to compute a better
estimate of F, such as iterative estimation which is based on minimizing the algebraic
error and the Gold Standard method which is dependent on the assumption of an error
model. However, the simplest and easiest method for the automatic computation of
Page | 12
F is the RANSAC method using eight point-correspondences. We need only 7 points
to compute F and the 8th
points would increase the order of the computation of F
exponentially. However, using 7 points we might end up with 3 solutions for each F
which is not desirable when using a large number of combinations of point-
correspondences to repeatedly compute F.
A random sample of 8 points are taken and the fundamental matrix is computed. The
distance for each point is then calculated and the number of inliers or number of
points for which distance is within the threshold is deduced. This process is repeated
a large number of times and the F with the largest number of inliers is chosen for the
following operations. F is now estimated using all correspondences that were
classified as inliers for the previously chosen F.
Algorithm
 Interest Points: Compute interest points in each image
 Putative Correspondences: Compute a set of interest point matches based on
proximity and similarity of their intensity neighborhood.
 RANSAC robust estimation: Repeat for N samples where N is determined
adaptively
 Select a random sample of 8 correspondences and compute the fundamental
matrix F.
 Calculate the distance d for each putative correspondence
 Compute the number of inliers consistent with F by the number of
correspondences for which d < t pixels
 Choose the F with the largest number of inliers. In the case of ties choose the
solution that has the lowest standard deviation of inliers.
 Non-linear estimation: re-estimate F from all correspondences classified as
inliers by minimizing a cost function
 Guided matching: Further interest point correspondences are now determined
using the estimated F to define a search strip about the epipolar line
Figure 2.3: Algorithm for the normalized 8-point method of computation of F
Normalization – This is the translation and scaling of the image such that the centroid
(average position) of the reference points is at the origin and the RMS distance of the
points from the origin is equal to /2. This has the effect of removing the effects of
the camera calibration.
2.4 Homography
Planar homography can be described as the relationship between corresponding
points between two images of the same scene. It can be used to identify points on the
same plane of an image. In this project, it is essential in identifying the ground plane
and to find the heights of distinct points above it. The computation of the homography
Page | 13
of a scene is also necessary to detect obstacles via image warping which is one of the
three methods used in this project.
The homography relationship is encapsulated by the H matrix such that for points X’
and X on the two images the following holds:
X ≈ HX’
Given the matrix H for a certain plane on the scene, the relationship holds for all
points on the image that are on the same plane.
Homography by itself is the relationship between the plane in space and the image
plane (Figure 2.4). Let X be the co-ordinates of a point on the image plane while X’
are its co-ordinates on the plane in space II.
[x y z]T
≈ P[x’ y’ 0 T]T
T = P[X Y T]T
X X’
2.4.1 Planar Homography
Given two images of the same scene, it is already known that there exists a a
relationship or homography between the image plane of the first camera (position)
and the plane in space and that between the image plane of the second camera
(position) and the plane in space. It can thus be deduced that there is a homography
between the two image planes. This relationship is known as planar homography.
Thus there exists the following relationship between a pair of corresponding points
(X’ and X on different images) on the same plane used to compute the homography.
X’ = HX
Figure 2.4: Homography relationship between a plane in scene and image plane
Page | 14
Thus if H is known for a particular plane between two images, for any point X on
the first image, the position of its corresponding point X’ on the second image can
be computed given that X lies on the same plane the homography is related to.
Similarly the converse can be done using
X = H-1
X’
2.4.2 Homography between parallel planes of a scene
Given the homography matrices Hz1 and Hz2 for two parallel planes that have
distances z1 and z2 from the camera respectively, the homography matrix for a third
plane z parallel to the given planes can be computed using interpolation:
This means that given the homographies of two parallel planes, the homographies of
a number of planes (parallel to the given pair) at different heights can be computed.
Given the locations of a point between two images of the scene, it is possible to
identify the homography the point corresponds to via comparison to its “warped”
position using the homography relation (X’ = HX). Since we know the height of each
plane (which was used to compute each homography), the height of the point can
simply be estimated as the height for the homography it most closely corresponds to.
2.4.3 Image Warping
Figure 2.5: Homography relationship between two images of scene
Page | 15
When two images are taken of a scene from different camera positions, the
relationship X’ = HX can be used to create a “warped” image from the first image.
The warped image is essentially an “estimate” of the second image given that that all
points on both images lie on the same plane as the ones used to compute the
homography of the scene.
While creating the warped image, the warped coordinates X of each pixel with
coordinates X’ on the first image is found using X’ = HX. The intensity of X (or
intensities if using RGB images) are copied to position X’ on the warped image.
However this means that there may be pixels on the warped image which are not
warped positions for any pixels in the first image and there may be pixels that are
warped positions for more than one pixel from the first image. These problems are
solved using interpolation. Blanks pixels are simply filled up by averaging the
intensities of their non-blank neighbours. Pixels that are warped positions for more
than one pixel on the first image have the average intensities for all the corresponding
pixels from the first image.
Assuming the plane to which the homography corresponds to is the ground, the
warped image and second image should be identical except for parts of the scene that
are above the ground plane (i.e. obstacles). The difference between intensities of
corresponding pixels between the warped image and second image is often used as a
method of obstacle detection.
2.4.4 Computing the homography matrix
By using the scale ambiguity of the homography equation we can turn the
computation of H into an OLS (ordinary least squares) problem. This is the
inhomogeneous solution to the computation of H.
From X’ = HX
where X = (s t 1)’ and X’ = (x y 1)’
h1 h2 h3
H = h4 h5 h6
h7 h8 1
We have
s x
t = H y
1 1
s xh1+ yh2 + h3
t = xh4 + yh5 + h6
1 xh7 + yh8 + 1
s = xh1+ yh2 + h3 i)
t = xh4 + yh5 + h6 ii)
Page | 16
1 = xh7 + yh8 + 1 iii)
The two equations per point would finally read.
-x -y -1 0 0 0 s*x s*y
0 0 0 -x -y -1 t*x t*y
So for n points it may be written as
h1
-x1 -y1 -1 0 0 0 s1*x1 s1*y1 h2 -s1
0 0 0 -x1 -y1 -1 t1*x1 t1*y1 h3 -t1
: : : : : : : : h4 : : :
: : : : : : h5 = :
-xn -yn -1 0 0 0 sn*xn sn*yn h6 -sn
0 0 0 -xn -yn -1 tn*xn tn*yn h7 -tn
h8
tmp1 htmp tmp2
tmp1 * htmp = tmp2
htmp = tmp1-1
* tmp2
htmp1 htmp2
htmp3 htmp4 H = 1
htmp5 htmp6
htmp7 htmp8
A satisfactory solution cannot be obtained using this method if h9 = 0, however this
is the method most commonly used because of the rarity of such circumstances. Since
there are eight unknowns, four point correspondences are required to solve the
computation of H. However if any three of these points are collinear the solution
would not be satisfactory. This is because the effect of having a set of collinear points
in solving linear equations is the same as having a pair of points since either can
define a straight line and neither can define a plane.
As with the computation of the fundamental matrix, a RANSAC method is perhaps
the most suited one for the computation of the homography of a scene.
2.5 Edge Detection
Edges are characterized by abrupt changes on an image indicating boundaries or other
features. The detection of edges is vital in computer vision in accomplishing several
operations such as segmentation, object modelling, registration etc. Points on edges
are used in this project to find point correspondences along contours of obstacles
using epipolar geometry (Section 2.2). Homography (Section 2.3) can be used on
h 1
.. -s
.. = -t
h 8
Page | 17
these correspondences to estimate the heights of these points on the scene thereby
identifying obstacles.
Figure 2.7 shows parts of two images with varying intensity along the horizontal. The
intensity function of each pixel and its derivatives are vital in detecting edges on any
object as is obvious by observing the distinct characteristics of these derivatives at
edges.
2.6 Corner Detection
Corners are local features on images identified by large variations in intensity in both
x and y directions. Corners detected during image analysis are used in a variety of
applications such as stereo point correspondence location, motion tracking, image
database retrieval etc. since they are most reliable features on image in terms of the
lack of ambiguity. This means that motion is very distinct at corners and moreover
corners can also be used in the reconstruction of most objects even though it would
be a mere approximation. Point correspondences are required for the computation of
the homography and epipolar geometry of a scene. Corners are usually selected as
the points used since they are the most distinguishable points and thus the easiest to
match across images.
Corners are detected using derivatives of the intensity function of pixels in both x and
y directions. The most commonly used corner detection algorithms compute the
“local structure matrix” of each pixel to determine whether it is a corner.
For a pixel (x,y) with intensity function I(x,y), its local structure matrix (A) is
Figure 2.7: Edges and derivatives of their intensity
Page | 18
In the presence of noise the image is often smoothed before computing the local
structure matrix for each pixel. Furthermore each of the entries may be smoothed by
a Gaussian filter w(r;s) with a preset s or a simple box filter.
Note that A is always symmetric and positive semi-definite and it has exactly two
eigenvalues λ
1 and λ2 (i.e. λ1>0 and λ2>0)
These eigenvalues can then be used to distinguish between uniform points, edges
and corners on the image.
 For points that are on perfectly
uniform parts of the image λ
1=
λ
2= 0
 For points that are on perfect
black and white step edges λ
1>0
and λ
2=0 where the eigenvector
(v1) corresponding to λ
1 is
orthogonal to the edge.
 For points that are on perfect
black square against white
background corner, λ
1>0 and
λ2>0.
This is the basic principle the Harris corner detector uses while working on greyscale
images. The algorithm for this method is as follows
Algorithm
• For each pixel (x,y) find A
• For each A find 2 eigenvalues λ
max, λ
min • Sort all λ
min, discard pixel with
small λ
min.
• Discard pixels with large λ
max - λ
min
• Remaining are corner points
Figure 2.10: Algorithm for the Harris Corner Detector
2.7 Image Segmentation
Image segmentation may be defined as the process of distinguishing objects in an
image from the background. The purposes of segmentation in obstacle detection is
quite obvious, since segments must be distinguished or separated first before they
can be identified as obstacles.
Typically several techniques are used to accomplish this task when dealing with
images that are described by the intensity of each pixel (intensity images).
 Edge-based methods: These methods are completely dependent on the system’s
ability to detect contours of objects. Pixels that are enclosed by the same contours
lines are then identified as a single object. This method is not reliable at all in the
presence of blurring because the contour lines formed are incomplete. As a result
pixels from different actual objects may be grouped together through the gap in
the contours.
Figure 2.9: Corners, Edges and other points
Page | 19
 Threshold techniques: These methods rely on the ability to distinguish objects
from the background only if the intensity of the pixels on it fall outside a certain
threshold which is a characteristic of the background. This means that pixels with
intensities that are outside the range of intensities of those on the background are
treated as objects on it. This method too is very susceptible to blurring since only
local rather than spatial information on pixels is taken into account. Moreover a
prior knowledge of the background itself is required to preset the allowable range
of intensities on it, unless some other methods are used to first identify the ground
itself or to first train the system on each particular background.
 Region based method: This method involves first segmenting the image into
connected regions by grouping neighboring pixels that have similar intensities.
Regions next to each other can then be merged together depending on how similar
they are or how sharp the boundaries are between then. Obviously the stringency
of these criteria for merging regions can lead to inaccurate segmentation due to
under-merging or over-merging.
 Connectivity-preserving relaxation method: This method is based on the
identification of initial curve boundaries and their iterative modification through
the application of various shrinking and expanding operations dependent on a
certain energy function. As is expected of such methods the system would still be
very liable to getting caught in a local minimum.
The region based method is probably the simplest method capable of decently
identifying objects on a background. Furthermore, it is less susceptible to noise and
broken edges and no prior knowledge of the scene is required as in threshold
techniques. On the other hand, the connectivity preserving relaxation method is still
a relatively new method and was considered too complex for the purposed of this
project.
2.7.1 K-means clustering
Region based image segmentation would probably be the most widely used technique
given minimal information about the scene, i.e. with no prior knowledge of the range
of intensities of pixels on the background. However first pixels of similar intensities
are needed to be grouped together. It is understandable that even on an object with
little or no texture, pixels will not have the same intensity. Therefore some
classification method is necessary to first group together pixels that are similar in
intensity making the following process of segmentation nearly error free.
K-means clustering is a method for this task especially since it is an unsupervised
method. The basic idea behind this method is: a set of pattern vectors T =
{x1,x2…..xn}, each vector is assigned a cluster ci from a set of k possible classes
where ci=j implies vector xi belongs to cluster j. It starts off by initializing class
centers (mc’s) and then assigning each pattern vector to its closest class in terms of
distance or some other measurement. The class centers are then updated averaging
the values of the vectors within it and vectors are then reassigned to their closest
classes using recomputed class centers. The process is iterative and only terminates
once there are no changes in assignments of all pixels following updates of class
centers.
Page | 20
The k-means algorithm is not without its disadvantages. Class centers need to be
chosen during initialization (usually as random members of the dataset). This means
the final result is dependent on the selection of these initial class centers. Moreover
during the classification process it is possible that some clusters may become empty
eventually. This would once again give unsatisfactory results. The algorithm
converges to a local minimum rather than a global minimum since there is the
possibility of a better assignment of classes with different class initializations that
lead to a better solution. Prior knowledge on the distribution of the dataset is often
used to gain better results in terms of a global minimum.
For the purposes of region based segmentation, class centers are initialized with
intensity values rather than co-ordinates. A pixel is assigned to a class with central
intensity closest to its own relative to that of other class centers. The class centers are
then recomputed averaging the intensities of all pixels within the cluster.
Following the process of k-means clustering region-based segmentation becomes a
considerably simpler problem to tackle. Following classification via k-means,
adjacent pixels assigned to the same cluster are identified as part of the same segment.
The process can be reiterated several times until no neighboring pixels with the same
class label are parts of different segments.
3 DESIGN
This part puts forth a list of requirements for the systems intended for this project.
There is also a general discussion on the several design methodologies commonly
used to develop a system and a choice is made after considering the timeframe and
nature of the project. Other factors affecting the design of the project such as
hardware constraints are mentioned along with a discussion on the development tools
and methods used to implement it. The problem is finally broken down into a series
of smaller and smaller sub-problems. An analysis of these sub-problems as well as
their interdependencies as part of the main problem are then discussed as part of the
“Design Plan”.
Figure 2.11: Algorithm for K - means clustering
Page | 21
3.1 Requirements
The main aim of the project is to use several techniques to research and study the
reliability with which a computer can detect obstacle given certain constraints in
hardware. It uses a combination of very fundamental techniques in various subfields
of computing that are later amalgamated into the obstacle detection machine. A
bottom-up approach has been taken to develop this system. It may be noted that this
project is not simply an engineering or development project and it may be categorized
more as research since most of it emphasizes on the comparisons between several
computer vision techniques in terms of reliability.
The final system would use image processing techniques such as detecting corners
and edges, pattern recognition techniques such as clustering and segmentation and
finally the basic concepts of computer vision based around multi-view relations
(planar homography and fundamental matrices) to study how capable a system is in
obstacle detection.
The following is a list of requirements that the aimed system was intended to satisfy:
 To process images and find points of corners between them
 To distinguish the ground plane from all other planes when given two images of
the same scene
 To identify points on either image belonging to the same plane
 To form and compare a “warped” image which can be described as an estimation
of the final image, assuming everything on the scene is on the ground.
 To calculate the height of points on either image given that the ground plane has
been identified
 To segment individual objects on the scene such that the height of each object can
be found
 To process images and find their corresponding edges between them
 To find the height of points along the edges of an obstacle such that it is useful
for detecting slopes or spherical objects
The true purpose of this system is the evaluation of the three obstacle detection
techniques that have overlapping requirements.
 Obstacle detection using planar homography and image warping using
comparison to warped image.
 Obstacle detection using planar homography and image segmentation using
computation of heights of segments.
 Obstacle detection using epipolar geometry, planar homography and edge
detection using computation of heights along contours.
Please note that this project does not aim to accomplish these tasks in real time since
its main purpose is simply the evaluation of the reliability of these techniques. Since
the fundamental concepts behind it are multi-view relations, pictures are simply taken
using an Integrated Webcam from two different positions (assuming pure translation
between them) and then the set of consecutive images are transferred on to a standard
personal computer which processes these images accordingly.
Page | 22
3.2 Design Methodology
A bottom-up approach was taken to develop the intended system. This approach
implies that the obstacle detection problem was broken down into smaller and smaller
sub-problems. The most basic sub-problems were tackled individually and their
solutions were put together into progressively more complex sub-problems which
were finally integrated to form the final system.
The top-down approach of implementing the basics of the main problem first and
then identifying and solving smaller sub-problems progressively seemed unsuitable
for the purposes of this project. The basis behind this reasoning is that without the
solution to the most basic sub-problems like detecting corners and finding point-
correspondences, upon which all other sub-problems are dependent it would be rather
pointless defining the main problem. It would have been possible to do so, if sample
solutions like matched corners were used as test data for the larger sub-problems,
however enough sample solutions were simply not available to test completely the
functionality and accuracy of the system. Therefore, the basic sub-problems had to
be solved first and then they were used to solve and test progressively larger sub-
problems.
3.2.1 System Design Model
Even though there are a number of system design models only two were considered
for this project. These were the waterfall model and the spiral model.
 The waterfall model is a very generic step by step model with feedback and error
loops going back to the previous step in case changes need to be made. Although
it was the most commonly used model earlier, it should only be treated as a
guideline since it is not a very realistic model. It is perhaps only applicable for
short projects that do not necessitate or cannot accommodate much feedback or
review in between the steps.
Figure 3.1: The Waterfall Model Figure 3.2: The Spiral Model
Page | 23
 The spiral model on the other hand is more suited to longer term projects. It is a
process of iterative development where the parts of the problem are continuous
analyzed, evaluated and developed with continuous review. Given the bottom-up
nature of this project, the spiral model was considered appropriate, since it allows
the individual design and implementation of sub-problems which is an
incremental process. The research nature of this project means that new features
are continuously being added to it which makes iterative development a necessity.
3.4 Hardware Constraints
Before the design plan can be discussed, the constraints on the system must be
considered. As it was mentioned a very standard personal computer is used to process
images transferred from a digital camera rather than attempting to process them via
a webcam in real time. This satisfies the aims of this project since it is more based
around researching computer vision techniques rather than attempting to develop an
obstacle detection system given very stringent requirements. The specifications of
the personal computer used are given below:
Device Specifications:
 Personal Computer (ASUS P52F)
 Intel i5, 2nd
Gen, 2.7 GHz Processor
 6GB RAM
 500GB Hard Disk
 Built in Web Camera – Max Res 640x480
3.5 Development Environment
The development environment is vital to the implementation of a system and it must
be chosen before commencing the design plan since the design will be influenced by
it. Two development environments were considered for this project. C was always
first preference, mostly due to its popularity. The best way of representing images in
terms of data is in the form of matrices and the project required very complex
manipulations of matrices which was difficult in C language. Hence, MATLAB was
chosen as the environment for the development of this project. MATLAB provides
the programmer with inbuilt functions for most complex mathematical operations and
its image processing toolbox makes it simple use to process data from images and
then represent the processed information in the form of graphs, plots and other
images.
Page | 24
3.5.1 The MATLAB Environment
Advantages of MATLAB
 It is an interpreted language which makes it very suitable for development and
research purposes since code and data can be updated while still in execution.
 It is a function-based language, which makes it very easy to develop, extend and
document programs.
 It is a language intended for numerical computation. It operates on matrices rather
than scalar which simplifies many mathematical operations
 It does not require the user to predefine every variable with a type and a size
before its first use.
 It is very easy to exchange data between Matlab and other applications such as
Excel which would be an advantage since most numerical analysis performed in
the evaluation of this report can be done easily in Excel.
 Its built-in features allow not only the programmer to perform calculations but
also present the results visually with minimum complexity in code.
 Matlab allows the programmer to work with undefined values. That is division
by zero is allowed without giving an error resulting in a special symbol inf as the
answer. Inf can be used in subsequent calculations where its division or
multiplication with any other real number results to Inf. This is very useful when
working with calculating values that might easily be undefined (e.g. gradients of
vertical lines).
Disadvantages of MATLAB
 Since it is an interpreted language, it can be really slow. However, good
programming practices can often increase its speed incredibly.
 The fact that variables are not declared can often lead to mistakes made my
programmers in spelling variable names etc. to go undetected.
3.5.2 Differences between C and MATLAB
Since C and Matlab were the two main programming environments considered for
this project, a very comprehensive study comparing and contrasting the two
languages was made.
 C is a compiled language whereas Matlab is an interpreted language. Although a
compiled C program will run considerably faster than an interpreted Matlab
program, the latter is definitely preferred during development.
 The fact that variables do not have to be declared in Matlab does give the
programmer the advantage of fast coding, however unlike in C it also makes the
program more susceptible to fail.
 Although like Matlab, C can also use arrays and matrices, C restricts the size of
these data structures on declaration. Furthermore, calculations involving elements
of an array would involve large bits of code in C, whereas Matlab can perform
them with a simple command, making it ideal for solving technical problems.
 Many libraries are available for C that give it almost the same functionality as
Matlab, however one has to search for these libraries and one can never be entirely
Page | 25
sure of the reliability of these libraries. Other than technical calculations Matlab
also has inbuilt functions (or purchasable toolboxes) for plotting graphs, linear
algebra, differential equations etc.
 In C, all variables declared in one scope are accessible by functions and
procedures in the next scopes, however in Matlab all variables need to be
explicitly declared at the beginning of a function call to be accessible in the next
scope. This can be an advantage since it prevents the programmer from writing
code that may inadvertently change the value of a global variable.
 Learning to use the more complicated functions of C would require one to go
through a book or other resources. However, Matlab comes very well-
documented and it is relatively easy to learn the language even from scratch by
simply reading the documentation provided with it.
Page | 26
3.6 Design Plan
The following chart shows each sub-problem in blocks. Blocks further down in the
chart are the more basic sub-problems which were solved first while block towards
the top of the list are more complex and were solved only after the sub-problems it is
dependent on are solved first. Arrows indicate dependency and flow of information
between sub-problems, i.e. for sub-problems contributing to the solution of a larger
problem there are arrows from the contributing sub-problems to it. These arrows are
labelled with the data interchanged between sub-problems and the direction of
information flow is indicated by the head of the arrow.
Computation of
heights of segments
Obstacle Detection
for UAV
Obstacle detection via
comparison to warped
Computation of heights
along contours
Formation of
warped image
Computation of
heights of corners
Matching points
along contours
Edge
Detection
Computation of
H matrix
Computation of
F matrix
Matching corners
between images
Corner
Detection
Image
Segmentation
Basic Sub-problem
Solved Last
Solved First
Main Problem
Corner Coords
Matched CornersMatched Corners
H matrix
H matrix Edge Coords
F matrix
Warped Image Corner Heights Segments Coords Matched Contours
Comparison Image Segments Heights Image Contour Heights Image
H Matrix
Edge
Coords
Images
Images
Figure 3.3: The Design Plan identifying all sub-problems
Page | 27
3.6.1 Descriptions of Sub-problems
The following is a brief description of the purpose and planned implementation of
the solution to each sub-problem or “module”. References have been included to the
literature review where appropriate where background knowledge may be required
to understand the methods and techniques involved in the solutions. Unless otherwise
stated, all the solutions are to be implemented and coded in the development
environment by myself.
 Corner Detection - Once the initial and final images have been processed into
data using a standard operation of the development environment, corners on both
images are located individually.
 Matching corners between images - Using the co-ordinates of corners from
Corner Detection, this module tries to find pairs of corresponding corners
between the two images. Its output is a set of pairs of co-ordinates, with each pair
being co-ordinates of the same corner on the initial and final image.
Correspondences of each point can be found by comparing a set of candidates
and selecting the one with the most similar intensities of neighboring pixels with
the one being matched.
 Computation of H matrix - Using the matched corners from matching corners
between images, the homography matrix (H) is computed for the scene using the
RANSAC in-homogenous method.
 Computation of F matrix - Using the matched corners from matching corners
between images, the fundamental matrix (F) is computed for the scene using the
normalized 8 point RANSAC algorithm.
 Formation of warped image - The homography matrix from Computation of H
matrix is used to create a warped image from the initial image. This is basically
done by finding the expected positions of all pixels on initial image and carrying
their intensities to these computed positions to the warped image. Interpolation is
used to estimate the intensities of pixels not plotted on the warped image.
 Obstacle detection via comparison to warped image - The warped image from
Formation of warped image is compared to the final image. A new image is
formed displaying the difference in intensity of pixels in corresponding locations
in the final image and warped image. A 2nd image is also formed displaying the
difference in intensity of blocks (16x16) of pixels in corresponding locations in
the final image and warped image. Both these images are indicators of obstacles.
 Edge Detection - The edge detector uses the canny method to give coordinates of
all points that are on edges or contours. Edge detection is a function provided
with the MATLAB image processing toolbox incorporating several methods of
detection. It also returns a binary image, which indicates whether a pixel at a
particular coordinate is an edge or not in the initial image. Edge detection is
performed both on the initial and final image.
 Computation of heights of corners - Using the homography matrix obtained from
Computation of H Matrix, the homography matrix of each plane parallel to the
ground between the ground and the height of the camera is estimated. Using the
matching corner pairs from matching corners between images this module
estimates its height in the scene by finding out which homography the pair most
closely corresponds to.
Page | 28
 Image Segmentation - Region based segmentation is used to segment the final
image into several segments or “objects”. The result is a matrix of the same
dimensions as the final image indicating which segment each point on the final
image belongs to. K-means clustering is performed on the image first followed
by segmentation.
 Computation of heights of segments - Using the segmentation information
obtained from Image Segmentation and the heights of each corner from
Computation of heights of corners it is possible to compute the height of each
segment. This is simply the maximum height among all the corners in each
segment. An image is created with high intensity for higher segments and low
intensity for segments close to the ground. This is another method of obstacle
detection.
 Matching points along contours - Using the fundamental matrix obtained from
Computation of F Matrix and the coordinates of all points on corners from Edge
Detection, it is possible to draw the epipolar line for each edge-point. A
correspondence for each edge point on the initial image can be found on the final
image by drawing its epipolar line and using it as a search strip for candidate
matches. The candidate with neighboring pixels most similar to the one being
matched is chosen as its match.
 Computation of heights along contours - Using the pairs of corresponding points
on contours obtained from Matching points along contours and the homography
matrix obtained from Computation of H matrix it possible to find the height of
each point on the edge in the scene. The method used is exactly the same as with
the Computation of heights of corners, the only difference being point
correspondences of edge-points are used rather than corner-points. An image is
formed with blocks indicating the heights of points on corners (increasing
intensity meaning greater altitude). This is basically done by dividing the image
in 16X16 blocks and increasing the intensity according the maximum height
among the edge points in each block.
 Obstacle Detection for a UAV - This as the title of this project indicates is the
main problem. This merely displays the images from the three obstacle detection
methods obtained from Obstacle detection by comparison to warped image,
Computation of heights of segments and Computation of heights along contours
to the user indicating the presence of obstacles in the scene.
Page | 29
4 IMPLEMENTATION
The Matlab environment was chosen to develop the system. A bottom up approach
was taken to achieve the outcome of this project since it is essentially based on
exploiting the use of simple operations that can be put together to perform one
complex task in the end.
4.1 Point Correspondences
4.1.1 Corner detection
The algorithm commonly known as the Harris corner detector is used to detect
corners which are later used to find corresponding points between the images.
[cim, r, c] <- harris(im, sigma, thresh, radius, disp)
The function Harris takes used the following parameters
im image to be processed in the form of a matrix
sigma standard deviation used to perform Gaussian smoothing
thresh threshold for corner detection (optional)
radius radius of region considered in non-maximal suppression (optional)
disp flag which if set the original image is displayed with the corners overlaid on it
(optional)
And it returns:
cim binary image of same dimension as im marking corners, i.e.
cim(x,y)=1 if (x,y) is a corner on im
r matrix of dimensions nx1 with row coordinates of n corner points
c cim binary image of same dimension as im marking corners, i.e.
cim(x,y)=1 if (x,y) is a corner on im
The Harris corner detector works by calculating the local structure matrix for each
pixel. Then it performs Eigen-decomposition of the local structure matrix for each
pixel giving two eigenvalues. If the difference between the two eigenvalues is large
the pixel is then identified as a corner.
4.2.2 Matching Corners
As mentioned earlier the Harris corner detector was used to find corners on image1
and image2, with the list of corners finally stored in nx2 matrices corners_im1 and
corners_im2 respectively. Since the function harris when given an image, imagez
returns the x and y coordinates of n corners in separate (1xn) matrices rz and cz
respectively. The matrix giving a list of corners (with x and y coordinates on each
row) corners_imn is created simply as one with rn and cn as its two columns.
Furthermore iscornerim1 and iscornerim2 are binary matrices of the same dimensions
as image1 and image2 where iscornerimn(x,y)=1 if (x,y) is a corner on imagen.
Page | 30
One of the requirements to compute homography of the scene was to find pairs of
corresponding points between the two images. For points to be matched between
images they must be unique and distinguishable. Corners are used since they are the
most distinguishable points in any image because of their distinct neighboring
regions. It can be assumed that two points are a match if their neighboring regions
are the same i.e. roughly the difference in RGB/greyscale values between a certain
block of neighboring region around the points are more or less the same.
Let us assume matched corners is a relation consisting of (x,y)->(i,j) such that (x,y)
and (i,j) are corresponding points between image1 and image2 respectively. To find
true matches between points matched_corners must be a one-one relation.
Therefore for each corner (x,y) on image1, corners on image2 within a certain radius
or window (w) are selected as potential candidates for a match. This means that every
corner on image2 with coordinates (s,t) where x-w ≤ s ≤ x+w and y-w ≤ s ≤ y+w is
treated as a candidate match for (x,y).
It is possible for there to be several corners on image2 which are close matches that
may result to matched corners being a many-many relation (Figure 4.2a). Please note
that it is possible for corners on image1 to have no candidate matches on image2 at
all (i.e. if there are no image2 corners within the window) and similarly for corners
on image2 to qualify as candidate matches for no image1 corners at all.
Page | 31
All possible candidates for each corner (x,y) on image1 are searched and the
difference in neighboring regions between each corner (x,y) on image1 and each of
its candidate matches (i,j) on image2 are calculated. This can be done simply by
subtracting the part of matrix image2 (i-n to i+n, jn to j+n) from part of the matrix
image1 (x-n to x+n, y-n to y+n). Then the sum difference would be the sum of the
absolute values of all the elements in the matrix resulting from the subtraction.
Page | 32
If the difference is greater than a certain
preset number, then the match is
disregarded. This is simply because if there
the difference is too huge then the
relationship between the two corners may
be considered too unreliable, that is, they
are not really matches at all.
Figure 4.4: Matched corners as a many-
many relation between corners on image1
and corners on image2 that are its
candidate matches with unreliable pairs
removed.
The candidate (i,j) with the lowest sum
difference to (x,y) is chosen as a match for
(x,y).This means that matched corners is
now a many-one relation since it is still
possible for several corners on image1 to
match to one corner on image2.
Figure 4.5: Matched corners as a many-one
many relation between each corner on
image1 and a corner on image2 that is its
best match.
However matched corners must be a one-
one relation to serve the purpose of
homography computation efficiently. In
order to achieve this, for each (i,j) on
matched corners (i.e. each corner on
image2 on matched corners) the entire
relation is searched for all corners (x,y) on
image1 mapping to (i,j) and only the
corner on image1 with the least sum
difference for neighbors to (i,j) is kept
whereas the rest are discarded. This means
that in case there are multiple matches to
any (i,j), only the best match is kept finally
making matched corners a one-one
relation as it was aimed to be in order to serve the purposes of this system.
Figure 4.6: Matched corners as a
one-one relation with final correspondences
Page | 33
4.3 Homography Computation
The aim is to compute the homography matrix for the ground plane between the two
images image1 and image2. Since H has 8 degrees of freedom, it can be computed
using four pairs of matching points between image1 and image2.
Some corners are discarded as potentials for calculating H (%HC1). These are pairs
of corners with little difference between their positions (<5 in Euclidian distance) and
those in the upper half of the image. The algorithm used is a variation of the
inhomogeneous RANSAC computation of H developed by myself. The only
difference is instead of selecting the homography with the most inliers, the
homography with the highest degree of correspondence to corners is selected.
Page | 34
The following process is repeated several times, each time calculating a new value of
H (%HC2).
Four random corners are selected first (i.e. four rows from matched corners are
picked) and then it is made certain that no three of these four corners lie on the same
line (%HC3). This can be done by checking whether for each trio of corners out of
the four (i.e. 4 combinations of 3 corners each) the gradient between two pairs of
points from the trio are the same. Then with this set of four corners the h matrix is
calculated. The next step is to find out how good the corners selected were for
estimating the homography of the ground plane. This can be done by comparing how
good estimates of warped positions the homography matrix gives for each corner.
For a corner on the initial image (ix,iy) and its corresponding corner on the final
image (fx,fy), its warped (expected) position (ex,ey) is computed using
(ex,ey,tmp)t
= h_matrix*(ix,iy,1)t
A comparison is made between ex and
ey using the following variables
(%HC4). p = Euclidian distance
between (ix,iy) and (ex,ey) q =
Euclidian distance between (ix,iy) and
(fx,fy)
r = Euclidian distance between (fx,fy)
and (ex,ey) t = angle between lines
(ix,iy)to(ex,ey) and (ix,iy)to(fx,fy),
using cosine formula on p, q and r. d =
t + r*100/p
The variable d represents a comparison
between the final corner and warped
corner. Small values of d indicate that
the point d correspond to the same
homography as H. This method of
comparing final points and warped
points will be referred to as the d
method throughout the rest of this
report.
The sum of d’s (diff) is stored for each
H (%HC5).
The correspondence d between the final and warped corner is thus calculated as a
sum of angle between them (from the initial corner) and the distance between them
expressed as a percentage of the distance between the initial and final corner (since
in the case of small values of p, a simple difference r would not be very reliable).
Large values of d, indicate that the corner does not correspond to the homography
used.
Please note that on the final output corners on the initial image are shown as circles,
those on the final image are shown as crosses and warped corners are shown as
triangles. The lines p and q (but not r) are shown for each trio of such corners.
Figure 4.8: Initial, final and warped corners and
the d method for corner comparison
Page | 35
After calculating several values of H and their corresponding diff’s, the value of H
with the minimum corresponding value of diff (i.e. the H which most corners seem
to agree with) is chosen as h_matrix (%HC6).
Page | 36
Then corners within a certain threshold of d used by calculating H are selected by
calculating d similarly as done earlier (%HC7). The selected corners are now used to
compute an even better estimate of H (%HC8), which become the final homography
matrix (for the ground plane) used throughout the rest of the program for image1 and
image2.
Afterwards the expected warped positions of each corner from image1 in matched
corners are estimated using h_matrix. Then the coordinates of the corner on the initial
image, its corresponding corner on the final image and the expected corner (found
from warping using h_matrix) are stored in rows of a matrix cornerswrp (%HC9).
Furthermore, the initial, final and expected corners are plotted as dots, crosses and
triangles respectively on both images with line between each pair of initial and final
corners and another line between each pair of initial and expected corners. (%HC10)
Page | 37
4.4 Warping Images
In order to detect obstacles, the first step taken is to warp the image from the
homography estimated earlier and the initial image. This is basically an image of the
scene from the same camera position as where the final image image2 was taken IF
all the pixels in image1 were located on the ground plane.
For each pixel (x,y) on image1, its position (s,t) on imagew can be calculated using
the homography relationship (%IW1)
(s t tmp)t
= h_matrix*(x y 1)t
Then by executing imagew(s,t) = image1(x,y) the contents of the pixel are transferred
to imagew. However, this method is incomplete since some pixels on imagew may
not be mapped on to at all and some pixels may be mapped more than once.
Let us first consider the case of the latter. Another matrix plottedw of same
dimensions as imagew is initialised with 0s, such that plottedw(s,t) indicates how
many (x,y)’s have mapped on to (s,t) on imagew. Everytime a point (s,t) on imagew
is plotted on to by a point(x,y) in image1, plottedw(s,t) is incremented by 1 and the
contents of image1(x,y) is added to imagec(s,t). This means that finally plottedw(s,t)
holds the number of times each point (s,t) on imagew has been plotted and
imagew(s,t) hold the sum of all values of image1(x,y) that (s,t) has been plotted on to
by (%IW2). In order for imagew to hold the actual warped image, the average value
for each pixel is found. This can be done simply by dividing each element of imagew
(for pixels that have been plotted at least once) by the corresponding element in
plottedw (%IW3).
Page | 38
Now let us the consider the case where a point (s,t) on imagew has not been plotted
at all. The simplest thing to do would be average the values of all its eight neighboring
pixels and store that in imagew(s,t).
However one must also consider the possibility that some of its neighboring pixels
may not have been plotted either. The basic idea is to find out the number of (s,t)’s
neighboring pixels that are plotted nbrs_pltd by checking whether plottedw(i,j) > 0
and summing the value of image w(i,j)’s where (i,j) represent neighbors that are
plotted already nbrs_sumd (%IW4). The value of imagec(s,t) can then be interpolated
by averaging these values i.e. imagec(s,t) = nbrs_sumd / nbrs_pltd and then
plotted3(s,t) is set to 1 indicating (s,t) has now been plotted (%IW5)
In case none of the neighbors have been plotted, the pixel is left as it is while a count
is kept (%IW6) of how many pixels have not been plotted at all (notplotted).
The entire process is repeated until all the pixels on imagec have been plotted i.e.
until not plotted=0 (%IW7). It is a safe assumption that this loop will terminate given
that at least one pixel on imagec has been plotted and the rest would be interpolated
from it.
Page | 39
Page | 40
4.4.1 Warp Comparator
Perhaps the crudest method of obstacle detection is from a comparison between the
warped image imagew found earlier and the final image image2. A pixel-pixel
comparison would be pointless since the likelihood of every pixel on the ground plane
matching perfectly regardless of the accuracy of our estimation of h is rather
minuscule. The approach taken is to compare 16x16 blocks of image2 with
corresponding 16x16 blocks of imagew, calculating the difference between each
corresponding pixel and summing their absolute values to give the block differences
(blockdiff). If blockdiff for a particular block is above a certain threshold, it is safe
to assume the pixel on that block do not correspond well with the homography of the
ground plane and the entire block can thus be treated as an obstacle.
As mentioned earlier both images are divided into blocks of 16*16 pixels.
So, block (i,j) for imagex would encompass pixels ({i-1}*16+1 to i*16, {j-1}*16+1
to j*16) from imagex, i.e. a 16x16 matrix of pixels. e.g. block (i=1,j=1) would include
pixels with x-coordinates 1 to 16 and y-coordinates 1 to 16, i.e. 256 pixels. The block
difference blockdiff(i,j) for each block (i,j) is calculated simply by subtracting the
parts of matrices from imagew and image2 that block (i,j) encapsulates and then
summing their absolute values (%WC1).
Therefore blockdiff would contain the differences between corresponding pixels
from each block in image2 and imagew. As stated earlier, if blockdiff(i,j) is above a
certain threshold all pixels in block (i,j) are considered parts of obstacles (%WC2).
An improvement is made to this approach for obstacle detection by taking into
account corners that lie in each block. If any corner in a block (i,j) does not
correspond to the homography of the ground plane by using the d method (%WC3)
i.e. if d is above a certain tolerance limit, it can be assumed that it is part of an obstacle
and the entire block can be marked as one. This is done simply by adding the
threshold to blockdiff(i,j) if (i,j) contains any such corners. This means that regardless
of the block differences previously found earlier, the discovery of a non-
corresponding corner in block (i,j) would force blockdiff(i,j) across the threshold
indicating an obstacle (%WC4).
Page | 41
Finally a new image imagec is created representing the comparison between the final
image image2 and the warped image imagew. Imagec is essentially a copy of image2,
however blocks on imagec that have blockdiff(i,j)>threshold are left as black
indicating obstacles. This can be done by initialising imagec as composed of just
black (0 value) pixels and then copying all pixels from all blocks (i,j) from image2 to
imagec unless blockdiff(i,j)>threshold (%WC2).
The image imagec can then just be displayed as any standard image is displayed while
blocks of black on the display will indicate obstacles found using the warping method
(%WC5)
Page | 42
4.5 Fundamental Matrix Computation
The algorithm, given pairs of matching points, uses RANSAC to compute the
fundamental matrix which it returns along with a set of pairs of matching points that
agree well with the epipolar geometry computed.
[matrix, goodmatchL, goodmatchR, residual] <-
fundamental_RANSAC(matchL,matchR)
The function takes in matchL and matchR (which are 3xn matrices) as parameters
which contains homogenous co-ordinates of n points on each column in matchL and
its match on the corresponding column is in matchR.
Similarly goodmatchL and goodmatchR are 3xn matrices containing homogenous co-
ordinates of matching points given that these points agree well with the fundamental
matrix computed.
The returned value residual is the average residual of good matching pairs.
The algorithm is the 8-point normalized algorithm for the computation of F. After the
normalization of point-correspondences given as parameters, it uses RANSAC to
randomly select a subset of these correspondences and computes the fundamental
matrix. It then computes epipolar lines for each point on the initial (or left) image and
then calculates the distance of the their matches on the final (or right) image to it.
Point correspondences for which this distance is below a threshold are considered as
inliers. The process of random selection, matrix computation and inlier identification
is repeated several times and the fundamental matrix with the most number of inliers
is selected for further computation. The fundamental matrix is then recomputed using
all the points that were earlier identified as inliers.
4.6 Image Segmentation and Edge Detection
4.6.1 Colour Segmentation and Edge Detection
Code written by Chen [5] is also used to segment images and find edges based on
colour variation. His algorithm uses the pattern recognition technique of k-means
clustering (Section 2.7.1) to classify pixels on the image according to colour thus
performing colour segmentation. After that the standard Matlab function edge is used
(with “Canny” as the chosen method) to perform edge detection.
[colour_seg edge_seg]<- kmean_seg(im)
When given an image im, it returns the following images (or matrices) which are of
the same dimensions as im
colour_seg - This is the simply the image im after the k-means clustering method is
performed, that is, the pixels on the image have been put into distinct classes
depending on their colour.
Page | 43
edge_seg - This is the result of performing canny edge-detection on the image
colour_seg. It is a binary binary image with 1s representing edges and 0s representing
any other pixels on colour_seg.
So, if the point (x,y) was part of an edge on the initial image im then edge_seg(x,y)=1
otherwise edge_seg(x,y)=0
4.6.2 Object Segmentation
The algorithm for colour segmentation returns an image imageseg which basically
used kmeans clustering for the classification of pixels that are similar in colour.
However this means that pixels on two separate objects of similar colour will be
members of the same class. The idea here is to classify the pixels such that only pixels
on the same object (with an enclosed edge) are members of the same class.
A very simple approach is taken to accomplish this from the already colour
segmented image imageseg. The method involves taking each pixel and then finding
out which of its already classified neighboring pixels it matches most closely with.
Since pixels are selected left to right top to bottom, the already classified neighboring
pixels would be its left, top and top left neighbors. The pixel (x,y) is classified into
the same segment as that of the neighbor (i,j) it most closely resembles in terms of
colour segmentation (i.e. has minimum difference in value) by setting segment(x,y)
= segment(i,j) %OS1. However if this minimum difference is above a threshold, we
can assume it is part of a different segment. In such cases, a new segment/class is
created and the pixel (x,y) is assigned to it by setting segment(x,y) = newsegment
(%OS2).
Image with colour segmentation (imageseg) New segmentation map
(segment)
Please note that for pixels on the first row or first column, there is only one
neighboring pixel that has been classified so there is no need to find a minimum
(%OS3). The first pixel (1, 1) is set as part of segment 1, i.e. segment (1, 1) =1, to
initialize the process (%OS4).
It is still possible for an object to be divided into several segments. This may happen
if parts of the object were approached at different times by the segmenting algorithm
and a new segment was created each of these times. To tackle with this problem, all
The comparisons between made between each pixel (x,y)
and its already segmented neighbours. This is done by
calculating the differences between the pixels.
The segment chosen for (x,y) is that of the neighbour it
has least difference with (provided this is below the
threshold)
Figure 4.15: Comparisons of pixels to its neigbours and segmentation
Page | 44
pairs of consecutive pixels must be analyzed and if they are similar in intensity, the
segment of the second pixel must be set to the segment of the first pixel. Moreover,
all the pixels earlier in the segment of the second pixel are assigned the same segment
as the first pixel.
Page | 45
4.7 Height estimation
4.7.1 Height estimation of points
In order to estimate the height of each point, it is necessary to know the homography
of the plane it corresponds to (Section 2.4.2). So, homographies of each plane at
intervals of one distance unit (cm) are computed using the standard homography
formula for parallel planes using h_matrix as H from distance = camera height (ch)
and h_inf as H from distance = infinity (%HP1). H_matrices is assumed to be a 3
dimensional array of dimensions (0-ch,1-3,1-3). It is computed such that
h_matrices(i,1-3,13) returns a 3*3 matrix that is the homography of the plane at
height i. h_inf is assumed to be the identity matrix for simplicity in this project since
points at infinity hardly seem to move regardless of camera motion
In order to estimate the height of a point (ix,iy) on image1 which has a corresponding
point (fx,fy) on image2, (ex,ey) is calculated for (ix,iy) for each parallel plane at
heights i = 0 to ch and a comparison is made between (ex,ey) and (fx,fy) using the d
method (explained earlier) %HP2. The height i selected as the estimated height for
(ix,iy) is the height at which using h_matrices(i) the comparing variable d has the
lowest value, i.e. the height at which the point (ix,iy) seems to match the best to
(%HP3). Please note that since Matlab does not allow global variables h_matrices
needs to passed as a parameter for calculateheight.
height <- calculateheight(ix,iy,fx,fy,h_matrices
Page | 46
4.7.2 Height estimation for segments
The height of each segment can be found simply by going through each corner and
then calculating the heights of each corner. If the height h of a corner (x,y) is greater
than the height the currently set height for the segment it belongs to i.e. segment(x,y),
h is set as the new height of that particular segment (%HS1). This way, the maximum
height among the corners of a segment is stored as the height of the segment.
Finally an image heightimage is created showing the heights of each segment. This
is done by assigning each pixel (x,y) on heightimage as the height of the segment(x,y)
lies in (%HS2). This would mean that heightimage now contains values possibly 0 to
ch (0 indicating ground). To represent the height of segments better, each pixel of
height image is divided by the maximum possible height ch and multiplied by the
maximum possible pixel value (255 for a 8-bit greyscale image). Ultimately on
heightimage (%HS3), pixels would appear darker if they are part of a segment that is
nearer to the ground (completely black if at height 0) and lighter as the segment is
further from the ground in terms of height (completely white if at height ch).
Page | 47
4.8 Contour matching
The fundamental matrix F is computed using the set of matching corners found earlier
as input parameters. The aim is to find matching points along the contour between
image1 and image2.
We know that that the fundamental matrix can be used to give the equation of the
epipolar line (%CM1) on image2 for each point (x,y) on image1. Using this line j =
lm*i+lc, it is possible to find a set of points within a certain region that are possible
candidates for matches to (x,y). (Section 2.3.1) The points we are considering on
image1 are those that lie on edges, i.e. edgeim1(x,y)=1. Candidate matches on image2
would be points on image2 along the line j=lm*i+lc within a certain window w that
lie on edges (%CM2), i.e. image2(i,j)=1. Since really large or small values of lm
(gradient) can make i change very little or a lot respectively with respect to j over the
window, i is varied over the window and j calculated from it for small values of lm
(%CM3) whereas j is varied over the window and i calculated from it for larger values
of lm using the equation i = (j – lc) / lm (%CM4).
The rest of the matching process is exactly the same as that for corners. Differences
between neighboring regions are calculated and the candidate with the least
difference is chosen as the matching corner (%CM5). After that many-one matches
are removed by only keeping points on image1 that have the least difference for a set
of multiple points matching to a single point on image2 (%CM6).
Page | 48
The height for each point along the contour can be found using height(x, y, i, j,
h_matrices) where (x, y, i, j) is a row of matchingpoints (%CM7). This can be later
shown on image1 and it can be observed how the estimate height increases or
decreases along the contour as the actual height increases or decreases. Then for each
element (x, y, i, j) on matchedpoints, its height can be displayed on coordinates (x,y)
on image1 and (i,j) on image2, since (x,y) and (i,j) give the position of the same point
on the scene on image1 and image2 respectively. (%CM8)
Page | 49
5EVALUATION
Evaluation is a vital part of any system development process. It is not possible to
know whether a system meets its initial requirements without a thorough
investigation of its operation using a range of experiments. A test plan is first included
in this chapter explaining a range of experiments that are necessary to evaluate this
system thoroughly. Afterwards, the implementation of each test and its results are
discussed with a brief summary of the evaluation conducted.
5.1 Point Correspondences
5.1.1 Corner detection
As mentioned earlier this is initially dependent on how well corners can be found on
both image and then a correspondence relationship can be established between pairs
of corners each of which are on a different image.
The Harris corner detector was used to perform this initial task of locating corners.
The results were very encouraging since in most occasions a large number of corners
could be found. Moreover, even when the ground plane and the object were very
similar in colour the Harris detector was able to locate the corners which is considered
quite difficult.
5.3.2 Matching correspondences
Matches of pairs of corners were found by initially taking one pixel on image1 and
then looking at the neighborhood of every pixel on image2 within a certain radius of
it and picking the closest matches.
As expected if there were too many corners in the neighboring regions, the process
was considerably slow and took up to three minutes for an image with around a 200
corners (Figure 5.1b).
The other problem faced was when there were too many putative matches that had
similar neighborhoods as the corner being matched. This is very likely in floors which
have a chessboard pattern with very small blocks. Let us assume, a corner on the top
right of a black block on image1 is being matched. If the pattern is really dense then
it is possible there might be several top right corners on black blocks on image2
within the window of search. This means that several candidate matches may have
exactly the same neighboring regions as the initial corner and it may be matched with
any one of these candidates not necessarily the right one, eventually leading to
degeneracies in the computation of the homography of the scene.
If there is too much texture however, e.g. a grainy pattern on the floor, the corner
detector may detect literally thousands of corners on the scene and may take a while
processing matches which will be highly inaccurate (Figure 5.1b). However if the
pattern is not very distinct, it does not regard any of the grains as corners at all and
so no corners or point correspondences can be found.
A mid-way scene in terms of finding good point correspondences is one with a few
corners on the ground e.g. pieces of paper on the ground (Figure 5.1c). Ground planes
such as this are used throughout the latter stages of evaluation. The best corner
correspondences can probably be found with a tiled floor where each tile (unlike the
chessboard) is big enough for there to not be two similar corners on the search
window of each corner being matched (Figure 5.1e).
Page | 50
Please Note: The figures show corners on the initial image as dots and the corners on
the final image as crosses. There is a line between a dot and a cross if the pair is
matched corner. Corners with circles around them are those considered reliable for
homography computation.
5.1a:No texture at all on background
5.1b:Grainy carpet - Too much texture on background
5.1c: Pieces of Paper – Medium texture
Figure 5.1: Scenes with different ground planes
Page | 51
Point correspondences are constrained by the window used to search for candidate
matches. This means that if the camera is moved forward or backward too much
between the two images, the actual match for an initial corner may not be within its
search window and will not be considered as a candidate match for it (Figure 5.2c).
This means the corner is not matched to anything at all or in the worse case
inaccurately to a random candidate corner within its window. On the other hand if
the movement is too small (Figure 5.2b), most point matches will be considered as
too close and thus unreliable for computing H and they will be disregarded. Camera
movements between 5cm and 10cm were considered the most suitable for these set
of experiments.
5.1d:Frequent tiles – Too much texture
5.1e:Large Tiles – Most desirable texture
Figure 5.1: Scenes with different ground planes (continued)
Page | 52
5.3 Computing homography and corner heights
As mentioned earlier the computation of H is entirely dependent on the location of
point correspondences between the two images of the scene. Estimation of heights of
corners and points along contours are done at the same time and so these were
evaluated at the same time as the computation of H.
How well H has been computed can be observed by having a look at both images
with each initial corner, its matched final corner and its warped position estimated
from the computed value of H. The closer the final and warped positions of each
corner on the ground are, it can be assumed the more accurate the computation of H
was. Moreover if the computation of H is accurate, then the computed heights of
corners on the ground and obstacles would be consistent with their real heights.
Graphs of actual heights and computed heights along with the correlation coefficients
between them give a good picture of how well the homography for the scene has been
computed.
5.2a: Initial image 5.2b:Final Image - Too little movement
5.2c:Final Image - Too much movement 5.2d: Final Image - Adequate movement
Figure 5.2: Movement of camera between images and its effects
Page | 53
Corners in the background did not have much on an effect on the computation of H,
since only corners on the lower half on the image were taken into account while
performing the RANSAC algorithm.
Inaccurate point correspondences on the floor owing to too much texture on it may
lead to degenerate computations of H. As a result heights estimated will not be
accurate either.
Page | 54
If there are no point or few correspondences on the ground (that is there is either too
much texture on it or none at all), the RANSAC algorithm attempts to compute H by
using the corners on the base of the obstacle. This does not lead to a very accurate
estimation of H since there are very few such corners usually present. Moreover this
is only possible if the base of the object lies in the lower half of the image since
anything above it are disregarded during the computation of H. It is also possible for
RANSAC to chose points that are on a different plane above the ground to compute
H. E.g. in Figure 5.3a, corners on the 10cm plane (marked with circles) are chosen
by RANSAC for the final computation of H. As a result, all computed heights of
corners are about 10cm less than their actual heights with 10cm being identified as
0cm (Figure 5.3c). There is a still strong correlation between actual and computed
heights as seen in Figure 5.3b, with the correlation coefficient computed as 0.75,
however there is an x-intercept of around 6cm (which is almost equal to the height of
the plane H corresponds to)
As mentioned earlier, with a few flat objects (e.g. pieces of paper) on the floor, a
decent estimation of H can be expected (Figure 5.4a). Corners marked with circles
are used for the computation of H and all these lie on the ground plane. As one can
see the regression line of computed vs actual heights is very close to the line of perfect
computation (where computed height = actual height). The correlation coefficient
was computed at 0.80 which is quite decent. Moreover the line almost passes through
the origin. A floor with large tiles would yield the maximum point correspondences
and thus the best computation of H. Another point to note is that height estimations
are highly inaccurate for heights close to the camera height. This can be observed in
Figure 5.4b where the camera is at 75cm.
Page | 55
Page | 56
5.4 Computing epipolar geometry and contour heights
As with the computation of the homography of the scene, the computation of the
fundamental matrix is completely dependent on the location of point correspondences
between the initial and final images.
The accuracy of the estimation of F can be observed by having a look at the epipolar
lines of each initial corner and checking whether the matching final corners lie on the
corresponding epipolar lines. Furthermore, point correspondences along the contours
can be found using the fundamental matrix to define a search trip along the epipolar
lines for each point on the contours. How well these points match keeping in mind
the camera motion is an even better indicator of the how good the computed estimate
of F is. As in the case of the homography, inaccurate point correspondences lead to
very degenerate computations of epipolar geometry. For scenes with few point
correspondences the fundamental matrix computed was not very accurate and lead to
many inaccurate point matches along the contours. For scenes with a decent number
of correspondences the fundamental matrix computed was quite a good estimate and
the point matches along the contours were more or less perfect. For scenes with an
abundant number of correspondences the computation of F was more or less perfect
and so were the consequent point matches along the contours.
Figure 5.5 shows a decent computation of epipolar geometry owing to good point
correspondences on the ground and well-performed edge detection. Epipolar lines
and edge heights are shown as well. Finally in 5.5d, the obstacle detection methods
using heights of edges (in blocks) are shown, with lighter blocks indicating greater
heights.
5.5a: Final Image - Contour matching 5.5b:Final Image - epipolar lines of corners
5.5c:Final Image - Contour Heights
Figure 5.5: Contour matching, epipolar lines and heights along contours
Page | 57
5.5 Image warping and obstacle detection
Since the pixels of the warped image can be thought of as functions of pixels of the
initial image with the homography matrix as a parameter, any obstacle detection
method using the warping image would be dependent on the accuracy of the
homography matrix. We can simply look at the final image, warped image, the
difference image and the block difference image to observe how well the system has
performed at detecting obstacles.
As expected degenerate computations of the homography matrix (e.g. where corners
on a plane other than the ground have been used to compute it because of the lack of
corners on the ground or simply where point correspondences were computed
incorrectly) objects on the ground may easily be detected as obstacles.
If there are too few corners on the ground, the estimate for H is not very accurate and
thus the warped image will not be a very good representation of the initial image after
the camera motion. This may lead to objects on the floor being detected as obstacles
as well.
In the case of objects with very little texture on the ground (assuming the homography
computed is a decent estimation), only blocks around the edges of objects will be
detected as obstacles. This is simply because when comparing the final and warped
images, there is not much difference towards the center of the object because of the
lack of texture. However the pixels are obviously conspicuously different along the
contours of the object.
Even though this performs the task of obstacle detection to some extent, it is quite
fallible. For example, in the case where the object and the ground behind it are of
more or less the same colour (brown box on Figure 5.6b), there will not be much
difference in pixels values even along the contours and thus no obstacles will be
detected at all. One must also realize that depending on the threshold set for block
5.5d:Obstacle detection via Contour Heights
Figure 5.5: Contour matching, epipolar lines and heights along contours (Continued)
Page | 58
differences, this method can only detect obstacles over a certain height (around 10cm
in these experiments). Setting the threshold too high means that most objects will not
be detected as obstacles and setting it too low means that even the slightest texture
on the ground may be identified as obstacles.
Even if a large number of good point correspondences are used to compute H, it is
still merely an estimate. For this reason, if there is a lot of texture on the ground in
the initial image, they will not be transferred perfectly to the warped image and this
might lead to inconsistencies with the final image. As a result, anything with texture
on the ground may be detected as an obstacle (Figure 5.6d).
The best case scenario for this method of obstacle detection is perhaps when the
computation of H is decent, there is very little texture on the ground and a lot of it on
the obstacles (square patterned box on figure 5.6b).
The image warping method seems to work for all shapes of objects given there is
enough texture on the object and the homography is computed more or less
accurately.
Page | 59
5.6 Segmentation and obstacle detection
This depends on how well H has been computed (consequently how well the heights
of corners have been estimate) and how easily the image can be segmented.
Assuming a decent computation of H, there are mainly two cases we have to consider.
If the obstacle and ground are more or less the same colour, they may be segmented
as one object (Figure 5.7b). So the maximum height of a corner in the object is
considered the height for all points on the segmented object. As a result all points on
the ground would be assigned the same height and the entire ground would be
indicated as an obstacle (Figure 5.7c).
5.7a:Final Image - Heights of Corners
5.7b:Final Image – Segmentation 5.7c:Final Image – Obstacle detection
Figure 5.7: Segmentation and Obstacle Detection - Obstacle and background similar in colour
Page | 60
If the obstacles and the ground are different colours, they are segmented as separate
objects. As a result pixels on the ground are given more or less the height of 0
(depending on how good the estimation of H is). Obstacles on the other hand are
treated individually and are given more or less accurate heights (Figure 5.8).
However, if the object has quite a bit of texture in it (e.g. stripes), it may be
segmented as several objects and each segment may have its own height (Figure 5.9).
5.8a:Final Image - Heights of Corners
5.8b:Final Image - Segmentation 5.8c:Final Image - Obstacle detection
Figure 5.8: Segmentation and Obstacle Detection - Obstacle and background different in colour
Page | 61
e.g. If the object has horizontal stripes, it will be divided into horizontal segments
with each segment having a progressively higher height value (Figure 5.9).
5.9a Final Image - Heights of Corners
5.9b: Final Image – Segmentation 5.9c: Final Image – Obstacle detection
Figure 5.9: Segmentation and Obstacle Detection - Stripes on obstacle
Page | 62
5.7 Summary of Evaluation
A range of experiments have been conducted to evaluation the performance of the
solution to each basic sub-problem (e.g. corner detection) to the three obstacle
detection methods used in this project. From the experiments conducted it is obvious
that each of the three methods of obstacle detection do not perform their best under
the same set of scene characteristics. The following is a table of methods of obstacle
detection and the features of an ideal scene for each of them.
Table 5.1: Methods of obstacle detection and preferred scene features
Page | 63
6 Appendix
Programming Codes
% Main program
file1 = 'image1.jpg' % Initial input image file
file2 = 'image2.jpg' % Final input image file
% Choosing which methods of obstacle detection to use
segmenter=1
edger=1
warper=1
image1=imread(file1);
[row,col,color]=size(image1);
image2=imread(file2);
% Corner Detection
sigma=2;
thresh=1000;
radius=2;
disp=1;
[iscornerim1, r1, c1] = harris(image1, sigma, thresh, radius, disp);
[iscornerim2, r2, c2] = harris(image2, sigma, thresh, radius, disp);
% Image segmentation and edge detection
[im edgeim1] = kmean_seg(file1); [im edgeim2] = kmean_seg(file2);
%%%%%%%%%%%%%%%%%%%%
% Matching Corners %
%%%%%%%%%%%%%%%%%%%%
cornertotals = []
% Matching Corners resulting in one-many pairs
for z=1:size(r1)
x = r1(z);
y = c1(z);
if x>windowsize & y>windowsize & x<row-windowsize & y<col-
windowsize
mintotal = 30000;
Page | 64
found = 0;
for i=(x-windowsize):(x+windowsize)
for j=(y-windowsize):(y+windowsize)
if i>nhood & j>nhood & i<row-nhood & j<col-nhood &
iscornerim2(i,j)==1
diff_total =
sum(sum(abs(double(image1(xnhood:x+nhood,y-nhood:y+nhood)) -
double(image2(i-nhood:i+nhood,jnhood:j+nhood)))));
if diff_total<mintotal
mintotal=diff_total;
tempi = i;
tempj = j;
found = 1;
end
end
end
end
if found>0
cornertotals = [cornertotals; x y tempi tempj mintotal];
end
end
end
[nomatchedcorners tmp] = size(cornertotals);
matchedcorners = [];
% Matching Corners resulting in one-one pairs
tempx=0;
tempy=0;
for u=1:nomatchedcorners
i = cornertotals(u,3);
j = cornertotals(u,4);
mintotal = 65535;
for v=1:nomatchedcorners
a = cornertotals(v,1);
Visual Obstacle detection in an UAV

More Related Content

Similar to Visual Obstacle detection in an UAV

AWP Best Practices
AWP  Best PracticesAWP  Best Practices
AWP Best PracticesJohn_Gallo
 
A_TOMCZYNSKI_MAA-DISS-19-A__665187 FINAL
A_TOMCZYNSKI_MAA-DISS-19-A__665187 FINALA_TOMCZYNSKI_MAA-DISS-19-A__665187 FINAL
A_TOMCZYNSKI_MAA-DISS-19-A__665187 FINALAlex Tomczynski
 
Wide area protection & Control technologies
Wide area protection & Control technologiesWide area protection & Control technologies
Wide area protection & Control technologiesPower System Operation
 
Whitepaper The Case For Integrated Risk &amp; Compliance Management Platforms...
Whitepaper The Case For Integrated Risk &amp; Compliance Management Platforms...Whitepaper The Case For Integrated Risk &amp; Compliance Management Platforms...
Whitepaper The Case For Integrated Risk &amp; Compliance Management Platforms...AarronSpinlely
 
Statement of Best Practices - Fall Protection
Statement of Best Practices - Fall ProtectionStatement of Best Practices - Fall Protection
Statement of Best Practices - Fall ProtectionCraig Ihde
 
2017-Collision-Avoidance-Systems-WP-v1.pdf
2017-Collision-Avoidance-Systems-WP-v1.pdf2017-Collision-Avoidance-Systems-WP-v1.pdf
2017-Collision-Avoidance-Systems-WP-v1.pdfAlexSandroBorgesPere
 
eMOTION! REPORTS.com Archives - (Boeing) Air Traffic Management: Revolutionar...
eMOTION! REPORTS.com Archives - (Boeing) Air Traffic Management: Revolutionar...eMOTION! REPORTS.com Archives - (Boeing) Air Traffic Management: Revolutionar...
eMOTION! REPORTS.com Archives - (Boeing) Air Traffic Management: Revolutionar...GLOBAL HEAVYLIFT HOLDINGS
 
eMOTION! REPORTS.com Archives: (Boeing) Air Traffic Management: Revolutionary...
eMOTION! REPORTS.com Archives: (Boeing) Air Traffic Management: Revolutionary...eMOTION! REPORTS.com Archives: (Boeing) Air Traffic Management: Revolutionary...
eMOTION! REPORTS.com Archives: (Boeing) Air Traffic Management: Revolutionary...GLOBAL HEAVYLIFT HOLDINGS
 
FAA Integration of Civil UAS in National Airspace Roadmap 2013
FAA Integration of Civil UAS in National Airspace Roadmap 2013FAA Integration of Civil UAS in National Airspace Roadmap 2013
FAA Integration of Civil UAS in National Airspace Roadmap 2013Tom "Blad" Lindblad
 
HMC industry report_drone_technology_160321[1]
HMC industry report_drone_technology_160321[1]HMC industry report_drone_technology_160321[1]
HMC industry report_drone_technology_160321[1]Robert Cheek
 
Hmc industry report_drone_technology_160321[1]
Hmc industry report_drone_technology_160321[1]Hmc industry report_drone_technology_160321[1]
Hmc industry report_drone_technology_160321[1]Robert Cheek
 
HMC_Industry_Report_Drone_Technology_160321[1]
HMC_Industry_Report_Drone_Technology_160321[1]HMC_Industry_Report_Drone_Technology_160321[1]
HMC_Industry_Report_Drone_Technology_160321[1]Robert Cheek
 
Dual Image Grooved Sign Final
Dual Image Grooved Sign FinalDual Image Grooved Sign Final
Dual Image Grooved Sign FinalJin young Kim
 
Project SHINE Findings Report (1-Oct-2014)
Project SHINE Findings Report (1-Oct-2014)Project SHINE Findings Report (1-Oct-2014)
Project SHINE Findings Report (1-Oct-2014)Bob Radvanovsky
 
Advancements and Applications of Drone Technology: A Comprehensive Review
Advancements and Applications of Drone Technology: A Comprehensive ReviewAdvancements and Applications of Drone Technology: A Comprehensive Review
Advancements and Applications of Drone Technology: A Comprehensive ReviewIRJTAE
 
Risk_Assessment_and_AWP_Selection
Risk_Assessment_and_AWP_SelectionRisk_Assessment_and_AWP_Selection
Risk_Assessment_and_AWP_SelectionCraig Ihde
 
Insight into an Emerging Technology: Commercial Drones
Insight into an Emerging Technology: Commercial DronesInsight into an Emerging Technology: Commercial Drones
Insight into an Emerging Technology: Commercial DronesFoiz Rahman
 
Wihte paper : Remote assistance in Mixed Reality
Wihte paper : Remote assistance in Mixed RealityWihte paper : Remote assistance in Mixed Reality
Wihte paper : Remote assistance in Mixed RealityImmersion
 

Similar to Visual Obstacle detection in an UAV (20)

AWP Best Practices
AWP  Best PracticesAWP  Best Practices
AWP Best Practices
 
A_TOMCZYNSKI_MAA-DISS-19-A__665187 FINAL
A_TOMCZYNSKI_MAA-DISS-19-A__665187 FINALA_TOMCZYNSKI_MAA-DISS-19-A__665187 FINAL
A_TOMCZYNSKI_MAA-DISS-19-A__665187 FINAL
 
Wide area protection & Control technologies
Wide area protection & Control technologiesWide area protection & Control technologies
Wide area protection & Control technologies
 
Whitepaper The Case For Integrated Risk &amp; Compliance Management Platforms...
Whitepaper The Case For Integrated Risk &amp; Compliance Management Platforms...Whitepaper The Case For Integrated Risk &amp; Compliance Management Platforms...
Whitepaper The Case For Integrated Risk &amp; Compliance Management Platforms...
 
Statement of Best Practices - Fall Protection
Statement of Best Practices - Fall ProtectionStatement of Best Practices - Fall Protection
Statement of Best Practices - Fall Protection
 
2017-Collision-Avoidance-Systems-WP-v1.pdf
2017-Collision-Avoidance-Systems-WP-v1.pdf2017-Collision-Avoidance-Systems-WP-v1.pdf
2017-Collision-Avoidance-Systems-WP-v1.pdf
 
eMOTION! REPORTS.com Archives - (Boeing) Air Traffic Management: Revolutionar...
eMOTION! REPORTS.com Archives - (Boeing) Air Traffic Management: Revolutionar...eMOTION! REPORTS.com Archives - (Boeing) Air Traffic Management: Revolutionar...
eMOTION! REPORTS.com Archives - (Boeing) Air Traffic Management: Revolutionar...
 
eMOTION! REPORTS.com Archives: (Boeing) Air Traffic Management: Revolutionary...
eMOTION! REPORTS.com Archives: (Boeing) Air Traffic Management: Revolutionary...eMOTION! REPORTS.com Archives: (Boeing) Air Traffic Management: Revolutionary...
eMOTION! REPORTS.com Archives: (Boeing) Air Traffic Management: Revolutionary...
 
FAA Integration of Civil UAS in National Airspace Roadmap 2013
FAA Integration of Civil UAS in National Airspace Roadmap 2013FAA Integration of Civil UAS in National Airspace Roadmap 2013
FAA Integration of Civil UAS in National Airspace Roadmap 2013
 
UAS roadmap 2013
UAS roadmap 2013UAS roadmap 2013
UAS roadmap 2013
 
HMC industry report_drone_technology_160321[1]
HMC industry report_drone_technology_160321[1]HMC industry report_drone_technology_160321[1]
HMC industry report_drone_technology_160321[1]
 
Hmc industry report_drone_technology_160321[1]
Hmc industry report_drone_technology_160321[1]Hmc industry report_drone_technology_160321[1]
Hmc industry report_drone_technology_160321[1]
 
HMC_Industry_Report_Drone_Technology_160321[1]
HMC_Industry_Report_Drone_Technology_160321[1]HMC_Industry_Report_Drone_Technology_160321[1]
HMC_Industry_Report_Drone_Technology_160321[1]
 
Dual Image Grooved Sign Final
Dual Image Grooved Sign FinalDual Image Grooved Sign Final
Dual Image Grooved Sign Final
 
Swiss Cheese
Swiss CheeseSwiss Cheese
Swiss Cheese
 
Project SHINE Findings Report (1-Oct-2014)
Project SHINE Findings Report (1-Oct-2014)Project SHINE Findings Report (1-Oct-2014)
Project SHINE Findings Report (1-Oct-2014)
 
Advancements and Applications of Drone Technology: A Comprehensive Review
Advancements and Applications of Drone Technology: A Comprehensive ReviewAdvancements and Applications of Drone Technology: A Comprehensive Review
Advancements and Applications of Drone Technology: A Comprehensive Review
 
Risk_Assessment_and_AWP_Selection
Risk_Assessment_and_AWP_SelectionRisk_Assessment_and_AWP_Selection
Risk_Assessment_and_AWP_Selection
 
Insight into an Emerging Technology: Commercial Drones
Insight into an Emerging Technology: Commercial DronesInsight into an Emerging Technology: Commercial Drones
Insight into an Emerging Technology: Commercial Drones
 
Wihte paper : Remote assistance in Mixed Reality
Wihte paper : Remote assistance in Mixed RealityWihte paper : Remote assistance in Mixed Reality
Wihte paper : Remote assistance in Mixed Reality
 

Visual Obstacle detection in an UAV

  • 1. Page | 1 Table of Contents 1 Introduction .............................................................................................................4 1.1 Motivation.........................................................................................................4 1.2 Visual Obstacle Avoidance Problem................................................................5 1.2.1 Definitions.................................................................................................5 1.2.2 Problem Statement...................................................................................6 2 Image Processing.....................................................................................................7 2.1 Understanding the Problem ..............................................................................7 2.2 Multi-View Relations .......................................................................................8 2.2.1 Two - view geometry................................................................................8 2.3 Epipolar Geometry............................................................................................8 Figure 2.1: Epipolar geometry of a scene from two images ......................................9 2.3.1 Properties of the Fundamental Matrix ..................................................9 2.3.2 Computation of the Fundamental Matrix ...........................................10 2.3.3 Random Sampling Consensus...............................................................10 2.3.4 Normalized 8 point algorithm...............................................................11 2.4 Homography ...................................................................................................12 2.4.1 Planar Homography ..............................................................................13 2.4.2 Homography between parallel planes of a scene.................................14 2.4.3 Image Warping.......................................................................................14 2.4.4 Computing the homography matrix.....................................................15 2.5 Edge Detection................................................................................................16 2.6 Corner Detection.............................................................................................17 2.7 Image Segmentation .......................................................................................18 2.7.1 K-means clustering ................................................................................19 3 DESIGN ................................................................................................................20 3.1 Requirements ..................................................................................................21 3.2 Design Methodology ......................................................................................22 3.2.1 System Design Model.............................................................................22 3.4 Hardware Constraints .....................................................................................23
  • 2. Page | 2 3.5 Development Environment.............................................................................23 3.5.1 The MATLAB Environment.................................................................24 3.5.2 Differences between C and MATLAB .................................................24 3.6 Design Plan.....................................................................................................26 3.6.1 Descriptions of Sub-problems...............................................................27 4 IMPLEMENTATION ...........................................................................................29 4.1 Point Correspondences ...................................................................................29 4.1.1 Corner detection.....................................................................................29 4.2.2 Matching Corners ..................................................................................29 4.3 Homography Computation .............................................................................33 4.4 Warping Images..............................................................................................37 4.4.1 Warp Comparator .................................................................................40 4.5 Fundamental Matrix Computation..................................................................42 4.6 Image Segmentation and Edge Detection.......................................................42 4.6.1 Colour Segmentation and Edge Detection...........................................42 4.6.2 Object Segmentation..............................................................................43 4.8 Contour matching.........................................................................................47 5 Evaluation..............................................................................................................49 5.1 Point Correspondences ...................................................................................49 5.1.1 Corner detection.....................................................................................49 5.3.2 Matching correspondences....................................................................49 5.3 Computing homography and corner heights...................................................52 5.4 Computing epipolar geometry and contour heights........................................56 5.5 Image warping and obstacle detection............................................................57 5.6 Segmentation and obstacle detection..............................................................59 5.7 Summary of Evaluation ..................................................................................62 6 Appendix ...............................................................................................................63
  • 4. Page | 4 1 Introduction In this part, we will understand the motivation behind this work; the problem statement and need to find the solution to the problem will be discussed; overall objective & goal of the thesis will be described; its significance will be discussed; the methodology & approach adapted will be explained briefly; the details of contributions & publications will be cited; finally the format of the report will be presented to enlighten you on what is going to be discussed in further chapters. 1.1 Motivation All the aircrafts around the world, are currently using Traffic Alert & Collision Avoidance System (TCAS) to reduce the risk of mid-air collision. The logic used to avoid the collision has evolved over the course since 1970s when it was first brought into application. The Main component of TCAS is onboard beacon radar surveillance that monitors the local air traffic. The iterative process involves series of specific logics that are implemented in codes to evaluate the system through simulation using number of encounter models. In recent years, the interest in Unmanned Air Vehicles grown rapidly. UAV cover a wide range of applications from military, security & surveillance to commercial services. In last two decades, the application and industry for UAV utilization has grown tremendously. Industries around the world are understanding & becoming aware of the functionality and capabilities of an autonomous unmanned aerial vehicle that varies in shape, size, function & performance. For growth and development of UAV industry and its application to continue on fast scale, it is important for UAVs to operate freely and provide capable performance at equivalent level of safety as compared to that of manned aircraft. Hence, Collision avoidance is emerging as a key issue for UAV access to Civil Airspace.
  • 5. Page | 5 1.2 Visual Obstacle Avoidance Problem 1.2.1 Definitions In the literature, we found that there are two different research approaches in the name of collision avoidance. In this thesis, we have used distinct definitions that enabled us to break the problem into various categories. The most important difference that is needed to be declared foremost is UAV avoiding collisions with stationary obstacles as opposed to air traffic. Hence, we define: Cooperative Collision Avoidance, where two aircrafts that are in communication with one another, negotiate a mitigation strategy. We are not concerned with Cooperative Collision Avoidance in this thesis. We are considering our obstacle to be static (like buildings or terrain) or flying (like hostile missiles). Non-Cooperative Collision Avoidance, where the aircraft is solely responsible to find a way to avoid the conflict scenario with the Terrain, Building or Intruder Aircraft. NFZ (No Fly Zones): Distinguished/ sensitive area declared by the Military for safety and security issues. Cannot be crossed, only avoid. Static in nature. E.g. Bhabha Atomic Research Center. In the thesis, we make use of standard definitions given by FAA or to be more specific defined by Minimum Operation Performance Standards. These standard, where ever required have been redefined to accommodate the context of our problem. Near Mid Air Collision (NMAC) – when two aircrafts come within 500 feet horizontally, which is 152.3metres & 500 feet vertically. Safety Bubble – the sphere with radius 500 feet around the UAV at any instant, within which any aircraft is an intruder, considered to be a potential conflict threat. Conflict Scenario – an encounter scenario between two UAV’s where the intruder comes within 500 feet. Collision Scenario – an encounter where two UAV’s collide with one another if avoidance fails. Mid Air Collision (MAC) – when two UAV’s collide during the course of flight.
  • 6. Page | 6 1.2.2 Problem Statement The Effective Surveillance by any Autonomous UAV it is necessary to make sure that it is able to perform in all situations. The UAV may be required to survey places within a city or other natural terrain in friendly and hostile territory. However, in case of an attack it becomes difficult to avoid the incoming missiles or even to recognize any hostile attack. The Aim of this Thesis is to provide an easy and practical method to avoid Attacks, No Fly Zones and Collisions while also modifying the Flight Path of the UAV. This is done by utilizing the camera on – board the UAV to survey the terrain and find any hostile object or buildings that may fall in the flight path of the UAV or if the flight path of the UAV passes through the firing range of the object. The UAV is primarily a Surveillance UAV and has no weapons on board. The initial coordinates for start and stop points as well as the coordinates to be surveyed must be entered before the flight of the UAV starts. This provides the UAV with the required reference points.
  • 7. Page | 7 2 Image Processing Several methods such as Odometry, Infrared and Laser have been used to achieve Obstacle Detection, this project uses Vision, which is the processing of images dependent on light radiated from the UAV’s environment to attempt to build a reliable Obstacle Detection System. A comprehensive study has been made of techniques from several fields of Engineering that contribute to obstacle detection. This project is based on subsets of three Obstacle Detection System Techniques. These are:  Obstacle detection using planar homography and image warping (via comparison to warped image)  Obstacle detection using planar homography and image segmentation (via computation of heights of segments)  Obstacle detection using epipolar geometry, planar homography and edge detection (via computation of heights along contours) The ultimate goal of this project is in fact the evaluation of each of these “sub- systems” in different operating environments or scenes, finally comparing and contrasting their performances. The construction of a system that detects obstacles in real time is not attempted. Rather, the aim is to write a MATLAB code that allows a system to detect obstacles reliably. 2.1 Understanding the Problem In order to perceive the world through Vision, the System must be able to recognize certain characteristics of its immediate environment. This is done through the analysis of images taken by a camera. The ability to recognize and differentiate textures, shapes, colors, etc. is vital to the replication of human vision which is the ultimate goal of all computer vision research. Perhaps the greatest challenge is the interpretation of 2D images into 3D scenes since a significant proportion of a scene’s characteristics are absent in its image. Moreover, a prior knowledge of the environment (e.g. lighting, texture, background etc.) is required since they affect the appearance of objects which the computer is trying to describe. Computer vision problems can be subdivided into low-level and high level problems. The former refers to the initial stages of image processing with very little other knowledge of the environment and includes operations such as Edge Detection, Boundary Drawing, etc. whereas the latter refers to highly task-specific operations performed on presumably perfect data taken from low-level processes with some or no additional data and includes operations such as Obstacle Detection, Boundary Generation.
  • 8. Page | 8 2.2 Multi-View Relations Multi-view relations are the fundamental principles on which this project is based. These include Epipolar Geometry and Planar Homography. The fact that different views of the same object are somehow related is the basis behind Multi-View Relations. 2.2.1 Two - view geometry The relationship between two images of the same scene can be more than enough to accomplish the task of obstacle detection to a reasonably reliable extent. The pair of images can be obtained at the same time using two cameras or one after the other, usually with the same camera moving relative to the scene. 2.3 Epipolar Geometry Epipolar geometry is defined the internal projective geometry between two images. The reason epipolar geometry is being studied here is because of its applications in finding 2D co-ordinates of the same point of a scene on images taken from two different camera positions. Epipolar lines are vital in narrowing down the possible point matches on one image for a point in another image of the same scene. Planar homography can then be used to estimate the heights of these points usually through the edges, thus performing obstacle detection. The epipolar geometry of a scene is not dependent on the structure of the scene, but on the camera’s internal parameters and relative position. The epipolar geometry can be expressed as its fundamental matrix. The matrix, denoted as F, is a 3x3 rank 2 matrix. The theory of epipolar geometry states that given a set of matching points x and x’ in a 3-Dimensional space obtained from two separate views of the same scene, the points satisfy the relation – x’T . Fx = 0
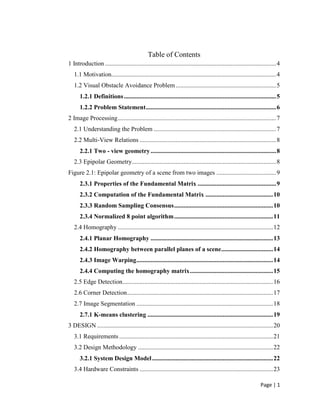
  • 9. Page | 9 Figure 2.1: Epipolar geometry of a scene from two images  The baseline can be defined as the line joining the two camera centers.  The epipoles can be defined as the points of intersection of each image plane (for each view) and the baseline.  The epipolar plane can be defined as a plane containing the baseline. There may be a series of such planes depending on a single parameter  An epipolar line is basically the intersection between the image plane and the epipolar plane, also intersecting at the epipoles. 2.3.1 Properties of the Fundamental Matrix  The transpose of F represent the relationship between the two points x’ and x, in the opposite order. i.e. xT FT x’ = 0  I = FT x’ represents the epipolar line corresponding to the point x in the second image. That is the corresponding point x on the second image satisfies xT I=0.  The line I’=Fx contains the epipole e’ for any point x on the second image (other than e). Similarly the line I=FT x’ contains the epipole e. i.e. e’T (Fx) for all values of x and thus e’T F=0 and similarly Fe=0. X is the location of a point on the scene and x’ and x are its locations on the images planes from camera Centers C’ and C respectively
  • 10. Page | 10  With 9 elements (being a 3X3 matrix) and the common scaling not being important F would have eight degrees of freedom. However owing to the constraint that det(F)=0, F has 7 - Degrees of Freedom  F is not of full rank since Inverse Mapping is not possible. This is because of the fact that with the pair of epipolar I’ and I lines corresponding to matching points, any point on the second image on I is mapped on the same line I’. From the relationship: X’T FX = 0 Where, X = [x y 1]T and X’ = [x’ y’ 1]T and f11 f12 f13 F = f21 f22 f23 f33 f32 f33 So (f11x’ + f21y’ + f31)x + (f12x’ + f22y’ + f32)y + (f13x’ + f23y’ + f33) = 0 Therefore given the co-ordinates of a point X’ in the first image and the fundamental matrix for the scene, it is possible to compute a line (the epipolar line) in the second image on which the corresponding point X lies. This is basis used for finding matching points between two images along their contours used in this project and it will be essential in detecting the heights of these points above the ground plane which is effectively performing the task of obstacle detection. 2.3.2 Computation of the Fundamental Matrix The following shows how an ordinary least squares solution can be found to the computation of the fundamental matrix. We have the epipolar relation X’TFX = 0 x’1x1 x’1y1 x’1 y’1x1 y’1y1 y’1 x1y1 1 Af = : : : : : : : : f = 0 x’nxn x’nyn x’n y’nxn y’nyn y’n xnyn 1 2.3.3 Random Sampling Consensus The Random Sampling Consensus (RANSAC) algorithm is for the robust fitting of models when there are many data outliers. The RANSAC algorithm is studied here because of its applications in the computations of parameters for several models required for obstacle detection (epipolar geometry and planar homography).
  • 11. Page | 11 Data samples may have a number of outliers that do not correspond to the intended model. The classification of data into inliers and outliers can be a problem. Given a set of ‘n’ data points, if the number of outliers is known as x, then the parameters of the model can be estimated repeatedly with combinations of (n-x) elements and keeping track of how many points agree with each of these models. Points agreeing with a model are those that are within a threshold of the model and are calculated using mathematical functions like Euclidian distance. The points are called the consensus set. However this method becomes difficult to achieve when the number of outliers are not known. The RANSAC algorithm does not have this drawback. The method involves selecting a certain minimum number of elements from the data sample randomly. The parameters of the model are estimated using these elements. The support for the estimated model (i.e. the number of elements in the consensus set) is noted by computing how many points are within the threshold. This process of random selection, parameter estimation and support computation is repeated a number of times and then the model with maximum support is chosen. The parameters of the model are now estimated again but this time with all the elements in the consensus set of the previously chosen model. This final model is the output of the RANSAC algorithm. RANSAC Algorithm  Randomly select a sample of s data points from S and instantiate the model from this subset  Determine the set of data points Si, which are within a distance threshold t of the model. The set Si is the consensus set of the sample and defines the inliers of S.  If the size of Si is greater than some threshold T, re-estimate the model using all the points in Si and terminate.  If the size of Si is less than T, select a new subset and repeat the above.  After N trials the largest consensus set Si is selected and the model is re- estimated using all the points in the subset Si Figure 2.2: Algorithm for RANSAC 2.3.4 Normalized 8 point algorithm This is the simplest method of computing the fundamental matrix. It involves first normalizing the points, computing the value of F using a linear equation and enforcing the singularity constraint on it and then de-normalizing F to give the actual fundamental matrix. The normalized 8-point algorithm is obviously not optimal since the significance of all entries of F is not equal i.e. some entries are more constrained by the point-point matches than others. Several optimizations can be performed to compute a better estimate of F, such as iterative estimation which is based on minimizing the algebraic error and the Gold Standard method which is dependent on the assumption of an error model. However, the simplest and easiest method for the automatic computation of
  • 12. Page | 12 F is the RANSAC method using eight point-correspondences. We need only 7 points to compute F and the 8th points would increase the order of the computation of F exponentially. However, using 7 points we might end up with 3 solutions for each F which is not desirable when using a large number of combinations of point- correspondences to repeatedly compute F. A random sample of 8 points are taken and the fundamental matrix is computed. The distance for each point is then calculated and the number of inliers or number of points for which distance is within the threshold is deduced. This process is repeated a large number of times and the F with the largest number of inliers is chosen for the following operations. F is now estimated using all correspondences that were classified as inliers for the previously chosen F. Algorithm  Interest Points: Compute interest points in each image  Putative Correspondences: Compute a set of interest point matches based on proximity and similarity of their intensity neighborhood.  RANSAC robust estimation: Repeat for N samples where N is determined adaptively  Select a random sample of 8 correspondences and compute the fundamental matrix F.  Calculate the distance d for each putative correspondence  Compute the number of inliers consistent with F by the number of correspondences for which d < t pixels  Choose the F with the largest number of inliers. In the case of ties choose the solution that has the lowest standard deviation of inliers.  Non-linear estimation: re-estimate F from all correspondences classified as inliers by minimizing a cost function  Guided matching: Further interest point correspondences are now determined using the estimated F to define a search strip about the epipolar line Figure 2.3: Algorithm for the normalized 8-point method of computation of F Normalization – This is the translation and scaling of the image such that the centroid (average position) of the reference points is at the origin and the RMS distance of the points from the origin is equal to /2. This has the effect of removing the effects of the camera calibration. 2.4 Homography Planar homography can be described as the relationship between corresponding points between two images of the same scene. It can be used to identify points on the same plane of an image. In this project, it is essential in identifying the ground plane and to find the heights of distinct points above it. The computation of the homography
  • 13. Page | 13 of a scene is also necessary to detect obstacles via image warping which is one of the three methods used in this project. The homography relationship is encapsulated by the H matrix such that for points X’ and X on the two images the following holds: X ≈ HX’ Given the matrix H for a certain plane on the scene, the relationship holds for all points on the image that are on the same plane. Homography by itself is the relationship between the plane in space and the image plane (Figure 2.4). Let X be the co-ordinates of a point on the image plane while X’ are its co-ordinates on the plane in space II. [x y z]T ≈ P[x’ y’ 0 T]T T = P[X Y T]T X X’ 2.4.1 Planar Homography Given two images of the same scene, it is already known that there exists a a relationship or homography between the image plane of the first camera (position) and the plane in space and that between the image plane of the second camera (position) and the plane in space. It can thus be deduced that there is a homography between the two image planes. This relationship is known as planar homography. Thus there exists the following relationship between a pair of corresponding points (X’ and X on different images) on the same plane used to compute the homography. X’ = HX Figure 2.4: Homography relationship between a plane in scene and image plane
  • 14. Page | 14 Thus if H is known for a particular plane between two images, for any point X on the first image, the position of its corresponding point X’ on the second image can be computed given that X lies on the same plane the homography is related to. Similarly the converse can be done using X = H-1 X’ 2.4.2 Homography between parallel planes of a scene Given the homography matrices Hz1 and Hz2 for two parallel planes that have distances z1 and z2 from the camera respectively, the homography matrix for a third plane z parallel to the given planes can be computed using interpolation: This means that given the homographies of two parallel planes, the homographies of a number of planes (parallel to the given pair) at different heights can be computed. Given the locations of a point between two images of the scene, it is possible to identify the homography the point corresponds to via comparison to its “warped” position using the homography relation (X’ = HX). Since we know the height of each plane (which was used to compute each homography), the height of the point can simply be estimated as the height for the homography it most closely corresponds to. 2.4.3 Image Warping Figure 2.5: Homography relationship between two images of scene
  • 15. Page | 15 When two images are taken of a scene from different camera positions, the relationship X’ = HX can be used to create a “warped” image from the first image. The warped image is essentially an “estimate” of the second image given that that all points on both images lie on the same plane as the ones used to compute the homography of the scene. While creating the warped image, the warped coordinates X of each pixel with coordinates X’ on the first image is found using X’ = HX. The intensity of X (or intensities if using RGB images) are copied to position X’ on the warped image. However this means that there may be pixels on the warped image which are not warped positions for any pixels in the first image and there may be pixels that are warped positions for more than one pixel from the first image. These problems are solved using interpolation. Blanks pixels are simply filled up by averaging the intensities of their non-blank neighbours. Pixels that are warped positions for more than one pixel on the first image have the average intensities for all the corresponding pixels from the first image. Assuming the plane to which the homography corresponds to is the ground, the warped image and second image should be identical except for parts of the scene that are above the ground plane (i.e. obstacles). The difference between intensities of corresponding pixels between the warped image and second image is often used as a method of obstacle detection. 2.4.4 Computing the homography matrix By using the scale ambiguity of the homography equation we can turn the computation of H into an OLS (ordinary least squares) problem. This is the inhomogeneous solution to the computation of H. From X’ = HX where X = (s t 1)’ and X’ = (x y 1)’ h1 h2 h3 H = h4 h5 h6 h7 h8 1 We have s x t = H y 1 1 s xh1+ yh2 + h3 t = xh4 + yh5 + h6 1 xh7 + yh8 + 1 s = xh1+ yh2 + h3 i) t = xh4 + yh5 + h6 ii)
  • 16. Page | 16 1 = xh7 + yh8 + 1 iii) The two equations per point would finally read. -x -y -1 0 0 0 s*x s*y 0 0 0 -x -y -1 t*x t*y So for n points it may be written as h1 -x1 -y1 -1 0 0 0 s1*x1 s1*y1 h2 -s1 0 0 0 -x1 -y1 -1 t1*x1 t1*y1 h3 -t1 : : : : : : : : h4 : : : : : : : : : h5 = : -xn -yn -1 0 0 0 sn*xn sn*yn h6 -sn 0 0 0 -xn -yn -1 tn*xn tn*yn h7 -tn h8 tmp1 htmp tmp2 tmp1 * htmp = tmp2 htmp = tmp1-1 * tmp2 htmp1 htmp2 htmp3 htmp4 H = 1 htmp5 htmp6 htmp7 htmp8 A satisfactory solution cannot be obtained using this method if h9 = 0, however this is the method most commonly used because of the rarity of such circumstances. Since there are eight unknowns, four point correspondences are required to solve the computation of H. However if any three of these points are collinear the solution would not be satisfactory. This is because the effect of having a set of collinear points in solving linear equations is the same as having a pair of points since either can define a straight line and neither can define a plane. As with the computation of the fundamental matrix, a RANSAC method is perhaps the most suited one for the computation of the homography of a scene. 2.5 Edge Detection Edges are characterized by abrupt changes on an image indicating boundaries or other features. The detection of edges is vital in computer vision in accomplishing several operations such as segmentation, object modelling, registration etc. Points on edges are used in this project to find point correspondences along contours of obstacles using epipolar geometry (Section 2.2). Homography (Section 2.3) can be used on h 1 .. -s .. = -t h 8
  • 17. Page | 17 these correspondences to estimate the heights of these points on the scene thereby identifying obstacles. Figure 2.7 shows parts of two images with varying intensity along the horizontal. The intensity function of each pixel and its derivatives are vital in detecting edges on any object as is obvious by observing the distinct characteristics of these derivatives at edges. 2.6 Corner Detection Corners are local features on images identified by large variations in intensity in both x and y directions. Corners detected during image analysis are used in a variety of applications such as stereo point correspondence location, motion tracking, image database retrieval etc. since they are most reliable features on image in terms of the lack of ambiguity. This means that motion is very distinct at corners and moreover corners can also be used in the reconstruction of most objects even though it would be a mere approximation. Point correspondences are required for the computation of the homography and epipolar geometry of a scene. Corners are usually selected as the points used since they are the most distinguishable points and thus the easiest to match across images. Corners are detected using derivatives of the intensity function of pixels in both x and y directions. The most commonly used corner detection algorithms compute the “local structure matrix” of each pixel to determine whether it is a corner. For a pixel (x,y) with intensity function I(x,y), its local structure matrix (A) is Figure 2.7: Edges and derivatives of their intensity
  • 18. Page | 18 In the presence of noise the image is often smoothed before computing the local structure matrix for each pixel. Furthermore each of the entries may be smoothed by a Gaussian filter w(r;s) with a preset s or a simple box filter. Note that A is always symmetric and positive semi-definite and it has exactly two eigenvalues λ 1 and λ2 (i.e. λ1>0 and λ2>0) These eigenvalues can then be used to distinguish between uniform points, edges and corners on the image.  For points that are on perfectly uniform parts of the image λ 1= λ 2= 0  For points that are on perfect black and white step edges λ 1>0 and λ 2=0 where the eigenvector (v1) corresponding to λ 1 is orthogonal to the edge.  For points that are on perfect black square against white background corner, λ 1>0 and λ2>0. This is the basic principle the Harris corner detector uses while working on greyscale images. The algorithm for this method is as follows Algorithm • For each pixel (x,y) find A • For each A find 2 eigenvalues λ max, λ min • Sort all λ min, discard pixel with small λ min. • Discard pixels with large λ max - λ min • Remaining are corner points Figure 2.10: Algorithm for the Harris Corner Detector 2.7 Image Segmentation Image segmentation may be defined as the process of distinguishing objects in an image from the background. The purposes of segmentation in obstacle detection is quite obvious, since segments must be distinguished or separated first before they can be identified as obstacles. Typically several techniques are used to accomplish this task when dealing with images that are described by the intensity of each pixel (intensity images).  Edge-based methods: These methods are completely dependent on the system’s ability to detect contours of objects. Pixels that are enclosed by the same contours lines are then identified as a single object. This method is not reliable at all in the presence of blurring because the contour lines formed are incomplete. As a result pixels from different actual objects may be grouped together through the gap in the contours. Figure 2.9: Corners, Edges and other points
  • 19. Page | 19  Threshold techniques: These methods rely on the ability to distinguish objects from the background only if the intensity of the pixels on it fall outside a certain threshold which is a characteristic of the background. This means that pixels with intensities that are outside the range of intensities of those on the background are treated as objects on it. This method too is very susceptible to blurring since only local rather than spatial information on pixels is taken into account. Moreover a prior knowledge of the background itself is required to preset the allowable range of intensities on it, unless some other methods are used to first identify the ground itself or to first train the system on each particular background.  Region based method: This method involves first segmenting the image into connected regions by grouping neighboring pixels that have similar intensities. Regions next to each other can then be merged together depending on how similar they are or how sharp the boundaries are between then. Obviously the stringency of these criteria for merging regions can lead to inaccurate segmentation due to under-merging or over-merging.  Connectivity-preserving relaxation method: This method is based on the identification of initial curve boundaries and their iterative modification through the application of various shrinking and expanding operations dependent on a certain energy function. As is expected of such methods the system would still be very liable to getting caught in a local minimum. The region based method is probably the simplest method capable of decently identifying objects on a background. Furthermore, it is less susceptible to noise and broken edges and no prior knowledge of the scene is required as in threshold techniques. On the other hand, the connectivity preserving relaxation method is still a relatively new method and was considered too complex for the purposed of this project. 2.7.1 K-means clustering Region based image segmentation would probably be the most widely used technique given minimal information about the scene, i.e. with no prior knowledge of the range of intensities of pixels on the background. However first pixels of similar intensities are needed to be grouped together. It is understandable that even on an object with little or no texture, pixels will not have the same intensity. Therefore some classification method is necessary to first group together pixels that are similar in intensity making the following process of segmentation nearly error free. K-means clustering is a method for this task especially since it is an unsupervised method. The basic idea behind this method is: a set of pattern vectors T = {x1,x2…..xn}, each vector is assigned a cluster ci from a set of k possible classes where ci=j implies vector xi belongs to cluster j. It starts off by initializing class centers (mc’s) and then assigning each pattern vector to its closest class in terms of distance or some other measurement. The class centers are then updated averaging the values of the vectors within it and vectors are then reassigned to their closest classes using recomputed class centers. The process is iterative and only terminates once there are no changes in assignments of all pixels following updates of class centers.
  • 20. Page | 20 The k-means algorithm is not without its disadvantages. Class centers need to be chosen during initialization (usually as random members of the dataset). This means the final result is dependent on the selection of these initial class centers. Moreover during the classification process it is possible that some clusters may become empty eventually. This would once again give unsatisfactory results. The algorithm converges to a local minimum rather than a global minimum since there is the possibility of a better assignment of classes with different class initializations that lead to a better solution. Prior knowledge on the distribution of the dataset is often used to gain better results in terms of a global minimum. For the purposes of region based segmentation, class centers are initialized with intensity values rather than co-ordinates. A pixel is assigned to a class with central intensity closest to its own relative to that of other class centers. The class centers are then recomputed averaging the intensities of all pixels within the cluster. Following the process of k-means clustering region-based segmentation becomes a considerably simpler problem to tackle. Following classification via k-means, adjacent pixels assigned to the same cluster are identified as part of the same segment. The process can be reiterated several times until no neighboring pixels with the same class label are parts of different segments. 3 DESIGN This part puts forth a list of requirements for the systems intended for this project. There is also a general discussion on the several design methodologies commonly used to develop a system and a choice is made after considering the timeframe and nature of the project. Other factors affecting the design of the project such as hardware constraints are mentioned along with a discussion on the development tools and methods used to implement it. The problem is finally broken down into a series of smaller and smaller sub-problems. An analysis of these sub-problems as well as their interdependencies as part of the main problem are then discussed as part of the “Design Plan”. Figure 2.11: Algorithm for K - means clustering
  • 21. Page | 21 3.1 Requirements The main aim of the project is to use several techniques to research and study the reliability with which a computer can detect obstacle given certain constraints in hardware. It uses a combination of very fundamental techniques in various subfields of computing that are later amalgamated into the obstacle detection machine. A bottom-up approach has been taken to develop this system. It may be noted that this project is not simply an engineering or development project and it may be categorized more as research since most of it emphasizes on the comparisons between several computer vision techniques in terms of reliability. The final system would use image processing techniques such as detecting corners and edges, pattern recognition techniques such as clustering and segmentation and finally the basic concepts of computer vision based around multi-view relations (planar homography and fundamental matrices) to study how capable a system is in obstacle detection. The following is a list of requirements that the aimed system was intended to satisfy:  To process images and find points of corners between them  To distinguish the ground plane from all other planes when given two images of the same scene  To identify points on either image belonging to the same plane  To form and compare a “warped” image which can be described as an estimation of the final image, assuming everything on the scene is on the ground.  To calculate the height of points on either image given that the ground plane has been identified  To segment individual objects on the scene such that the height of each object can be found  To process images and find their corresponding edges between them  To find the height of points along the edges of an obstacle such that it is useful for detecting slopes or spherical objects The true purpose of this system is the evaluation of the three obstacle detection techniques that have overlapping requirements.  Obstacle detection using planar homography and image warping using comparison to warped image.  Obstacle detection using planar homography and image segmentation using computation of heights of segments.  Obstacle detection using epipolar geometry, planar homography and edge detection using computation of heights along contours. Please note that this project does not aim to accomplish these tasks in real time since its main purpose is simply the evaluation of the reliability of these techniques. Since the fundamental concepts behind it are multi-view relations, pictures are simply taken using an Integrated Webcam from two different positions (assuming pure translation between them) and then the set of consecutive images are transferred on to a standard personal computer which processes these images accordingly.
  • 22. Page | 22 3.2 Design Methodology A bottom-up approach was taken to develop the intended system. This approach implies that the obstacle detection problem was broken down into smaller and smaller sub-problems. The most basic sub-problems were tackled individually and their solutions were put together into progressively more complex sub-problems which were finally integrated to form the final system. The top-down approach of implementing the basics of the main problem first and then identifying and solving smaller sub-problems progressively seemed unsuitable for the purposes of this project. The basis behind this reasoning is that without the solution to the most basic sub-problems like detecting corners and finding point- correspondences, upon which all other sub-problems are dependent it would be rather pointless defining the main problem. It would have been possible to do so, if sample solutions like matched corners were used as test data for the larger sub-problems, however enough sample solutions were simply not available to test completely the functionality and accuracy of the system. Therefore, the basic sub-problems had to be solved first and then they were used to solve and test progressively larger sub- problems. 3.2.1 System Design Model Even though there are a number of system design models only two were considered for this project. These were the waterfall model and the spiral model.  The waterfall model is a very generic step by step model with feedback and error loops going back to the previous step in case changes need to be made. Although it was the most commonly used model earlier, it should only be treated as a guideline since it is not a very realistic model. It is perhaps only applicable for short projects that do not necessitate or cannot accommodate much feedback or review in between the steps. Figure 3.1: The Waterfall Model Figure 3.2: The Spiral Model
  • 23. Page | 23  The spiral model on the other hand is more suited to longer term projects. It is a process of iterative development where the parts of the problem are continuous analyzed, evaluated and developed with continuous review. Given the bottom-up nature of this project, the spiral model was considered appropriate, since it allows the individual design and implementation of sub-problems which is an incremental process. The research nature of this project means that new features are continuously being added to it which makes iterative development a necessity. 3.4 Hardware Constraints Before the design plan can be discussed, the constraints on the system must be considered. As it was mentioned a very standard personal computer is used to process images transferred from a digital camera rather than attempting to process them via a webcam in real time. This satisfies the aims of this project since it is more based around researching computer vision techniques rather than attempting to develop an obstacle detection system given very stringent requirements. The specifications of the personal computer used are given below: Device Specifications:  Personal Computer (ASUS P52F)  Intel i5, 2nd Gen, 2.7 GHz Processor  6GB RAM  500GB Hard Disk  Built in Web Camera – Max Res 640x480 3.5 Development Environment The development environment is vital to the implementation of a system and it must be chosen before commencing the design plan since the design will be influenced by it. Two development environments were considered for this project. C was always first preference, mostly due to its popularity. The best way of representing images in terms of data is in the form of matrices and the project required very complex manipulations of matrices which was difficult in C language. Hence, MATLAB was chosen as the environment for the development of this project. MATLAB provides the programmer with inbuilt functions for most complex mathematical operations and its image processing toolbox makes it simple use to process data from images and then represent the processed information in the form of graphs, plots and other images.
  • 24. Page | 24 3.5.1 The MATLAB Environment Advantages of MATLAB  It is an interpreted language which makes it very suitable for development and research purposes since code and data can be updated while still in execution.  It is a function-based language, which makes it very easy to develop, extend and document programs.  It is a language intended for numerical computation. It operates on matrices rather than scalar which simplifies many mathematical operations  It does not require the user to predefine every variable with a type and a size before its first use.  It is very easy to exchange data between Matlab and other applications such as Excel which would be an advantage since most numerical analysis performed in the evaluation of this report can be done easily in Excel.  Its built-in features allow not only the programmer to perform calculations but also present the results visually with minimum complexity in code.  Matlab allows the programmer to work with undefined values. That is division by zero is allowed without giving an error resulting in a special symbol inf as the answer. Inf can be used in subsequent calculations where its division or multiplication with any other real number results to Inf. This is very useful when working with calculating values that might easily be undefined (e.g. gradients of vertical lines). Disadvantages of MATLAB  Since it is an interpreted language, it can be really slow. However, good programming practices can often increase its speed incredibly.  The fact that variables are not declared can often lead to mistakes made my programmers in spelling variable names etc. to go undetected. 3.5.2 Differences between C and MATLAB Since C and Matlab were the two main programming environments considered for this project, a very comprehensive study comparing and contrasting the two languages was made.  C is a compiled language whereas Matlab is an interpreted language. Although a compiled C program will run considerably faster than an interpreted Matlab program, the latter is definitely preferred during development.  The fact that variables do not have to be declared in Matlab does give the programmer the advantage of fast coding, however unlike in C it also makes the program more susceptible to fail.  Although like Matlab, C can also use arrays and matrices, C restricts the size of these data structures on declaration. Furthermore, calculations involving elements of an array would involve large bits of code in C, whereas Matlab can perform them with a simple command, making it ideal for solving technical problems.  Many libraries are available for C that give it almost the same functionality as Matlab, however one has to search for these libraries and one can never be entirely
  • 25. Page | 25 sure of the reliability of these libraries. Other than technical calculations Matlab also has inbuilt functions (or purchasable toolboxes) for plotting graphs, linear algebra, differential equations etc.  In C, all variables declared in one scope are accessible by functions and procedures in the next scopes, however in Matlab all variables need to be explicitly declared at the beginning of a function call to be accessible in the next scope. This can be an advantage since it prevents the programmer from writing code that may inadvertently change the value of a global variable.  Learning to use the more complicated functions of C would require one to go through a book or other resources. However, Matlab comes very well- documented and it is relatively easy to learn the language even from scratch by simply reading the documentation provided with it.
  • 26. Page | 26 3.6 Design Plan The following chart shows each sub-problem in blocks. Blocks further down in the chart are the more basic sub-problems which were solved first while block towards the top of the list are more complex and were solved only after the sub-problems it is dependent on are solved first. Arrows indicate dependency and flow of information between sub-problems, i.e. for sub-problems contributing to the solution of a larger problem there are arrows from the contributing sub-problems to it. These arrows are labelled with the data interchanged between sub-problems and the direction of information flow is indicated by the head of the arrow. Computation of heights of segments Obstacle Detection for UAV Obstacle detection via comparison to warped Computation of heights along contours Formation of warped image Computation of heights of corners Matching points along contours Edge Detection Computation of H matrix Computation of F matrix Matching corners between images Corner Detection Image Segmentation Basic Sub-problem Solved Last Solved First Main Problem Corner Coords Matched CornersMatched Corners H matrix H matrix Edge Coords F matrix Warped Image Corner Heights Segments Coords Matched Contours Comparison Image Segments Heights Image Contour Heights Image H Matrix Edge Coords Images Images Figure 3.3: The Design Plan identifying all sub-problems
  • 27. Page | 27 3.6.1 Descriptions of Sub-problems The following is a brief description of the purpose and planned implementation of the solution to each sub-problem or “module”. References have been included to the literature review where appropriate where background knowledge may be required to understand the methods and techniques involved in the solutions. Unless otherwise stated, all the solutions are to be implemented and coded in the development environment by myself.  Corner Detection - Once the initial and final images have been processed into data using a standard operation of the development environment, corners on both images are located individually.  Matching corners between images - Using the co-ordinates of corners from Corner Detection, this module tries to find pairs of corresponding corners between the two images. Its output is a set of pairs of co-ordinates, with each pair being co-ordinates of the same corner on the initial and final image. Correspondences of each point can be found by comparing a set of candidates and selecting the one with the most similar intensities of neighboring pixels with the one being matched.  Computation of H matrix - Using the matched corners from matching corners between images, the homography matrix (H) is computed for the scene using the RANSAC in-homogenous method.  Computation of F matrix - Using the matched corners from matching corners between images, the fundamental matrix (F) is computed for the scene using the normalized 8 point RANSAC algorithm.  Formation of warped image - The homography matrix from Computation of H matrix is used to create a warped image from the initial image. This is basically done by finding the expected positions of all pixels on initial image and carrying their intensities to these computed positions to the warped image. Interpolation is used to estimate the intensities of pixels not plotted on the warped image.  Obstacle detection via comparison to warped image - The warped image from Formation of warped image is compared to the final image. A new image is formed displaying the difference in intensity of pixels in corresponding locations in the final image and warped image. A 2nd image is also formed displaying the difference in intensity of blocks (16x16) of pixels in corresponding locations in the final image and warped image. Both these images are indicators of obstacles.  Edge Detection - The edge detector uses the canny method to give coordinates of all points that are on edges or contours. Edge detection is a function provided with the MATLAB image processing toolbox incorporating several methods of detection. It also returns a binary image, which indicates whether a pixel at a particular coordinate is an edge or not in the initial image. Edge detection is performed both on the initial and final image.  Computation of heights of corners - Using the homography matrix obtained from Computation of H Matrix, the homography matrix of each plane parallel to the ground between the ground and the height of the camera is estimated. Using the matching corner pairs from matching corners between images this module estimates its height in the scene by finding out which homography the pair most closely corresponds to.
  • 28. Page | 28  Image Segmentation - Region based segmentation is used to segment the final image into several segments or “objects”. The result is a matrix of the same dimensions as the final image indicating which segment each point on the final image belongs to. K-means clustering is performed on the image first followed by segmentation.  Computation of heights of segments - Using the segmentation information obtained from Image Segmentation and the heights of each corner from Computation of heights of corners it is possible to compute the height of each segment. This is simply the maximum height among all the corners in each segment. An image is created with high intensity for higher segments and low intensity for segments close to the ground. This is another method of obstacle detection.  Matching points along contours - Using the fundamental matrix obtained from Computation of F Matrix and the coordinates of all points on corners from Edge Detection, it is possible to draw the epipolar line for each edge-point. A correspondence for each edge point on the initial image can be found on the final image by drawing its epipolar line and using it as a search strip for candidate matches. The candidate with neighboring pixels most similar to the one being matched is chosen as its match.  Computation of heights along contours - Using the pairs of corresponding points on contours obtained from Matching points along contours and the homography matrix obtained from Computation of H matrix it possible to find the height of each point on the edge in the scene. The method used is exactly the same as with the Computation of heights of corners, the only difference being point correspondences of edge-points are used rather than corner-points. An image is formed with blocks indicating the heights of points on corners (increasing intensity meaning greater altitude). This is basically done by dividing the image in 16X16 blocks and increasing the intensity according the maximum height among the edge points in each block.  Obstacle Detection for a UAV - This as the title of this project indicates is the main problem. This merely displays the images from the three obstacle detection methods obtained from Obstacle detection by comparison to warped image, Computation of heights of segments and Computation of heights along contours to the user indicating the presence of obstacles in the scene.
  • 29. Page | 29 4 IMPLEMENTATION The Matlab environment was chosen to develop the system. A bottom up approach was taken to achieve the outcome of this project since it is essentially based on exploiting the use of simple operations that can be put together to perform one complex task in the end. 4.1 Point Correspondences 4.1.1 Corner detection The algorithm commonly known as the Harris corner detector is used to detect corners which are later used to find corresponding points between the images. [cim, r, c] <- harris(im, sigma, thresh, radius, disp) The function Harris takes used the following parameters im image to be processed in the form of a matrix sigma standard deviation used to perform Gaussian smoothing thresh threshold for corner detection (optional) radius radius of region considered in non-maximal suppression (optional) disp flag which if set the original image is displayed with the corners overlaid on it (optional) And it returns: cim binary image of same dimension as im marking corners, i.e. cim(x,y)=1 if (x,y) is a corner on im r matrix of dimensions nx1 with row coordinates of n corner points c cim binary image of same dimension as im marking corners, i.e. cim(x,y)=1 if (x,y) is a corner on im The Harris corner detector works by calculating the local structure matrix for each pixel. Then it performs Eigen-decomposition of the local structure matrix for each pixel giving two eigenvalues. If the difference between the two eigenvalues is large the pixel is then identified as a corner. 4.2.2 Matching Corners As mentioned earlier the Harris corner detector was used to find corners on image1 and image2, with the list of corners finally stored in nx2 matrices corners_im1 and corners_im2 respectively. Since the function harris when given an image, imagez returns the x and y coordinates of n corners in separate (1xn) matrices rz and cz respectively. The matrix giving a list of corners (with x and y coordinates on each row) corners_imn is created simply as one with rn and cn as its two columns. Furthermore iscornerim1 and iscornerim2 are binary matrices of the same dimensions as image1 and image2 where iscornerimn(x,y)=1 if (x,y) is a corner on imagen.
  • 30. Page | 30 One of the requirements to compute homography of the scene was to find pairs of corresponding points between the two images. For points to be matched between images they must be unique and distinguishable. Corners are used since they are the most distinguishable points in any image because of their distinct neighboring regions. It can be assumed that two points are a match if their neighboring regions are the same i.e. roughly the difference in RGB/greyscale values between a certain block of neighboring region around the points are more or less the same. Let us assume matched corners is a relation consisting of (x,y)->(i,j) such that (x,y) and (i,j) are corresponding points between image1 and image2 respectively. To find true matches between points matched_corners must be a one-one relation. Therefore for each corner (x,y) on image1, corners on image2 within a certain radius or window (w) are selected as potential candidates for a match. This means that every corner on image2 with coordinates (s,t) where x-w ≤ s ≤ x+w and y-w ≤ s ≤ y+w is treated as a candidate match for (x,y). It is possible for there to be several corners on image2 which are close matches that may result to matched corners being a many-many relation (Figure 4.2a). Please note that it is possible for corners on image1 to have no candidate matches on image2 at all (i.e. if there are no image2 corners within the window) and similarly for corners on image2 to qualify as candidate matches for no image1 corners at all.
  • 31. Page | 31 All possible candidates for each corner (x,y) on image1 are searched and the difference in neighboring regions between each corner (x,y) on image1 and each of its candidate matches (i,j) on image2 are calculated. This can be done simply by subtracting the part of matrix image2 (i-n to i+n, jn to j+n) from part of the matrix image1 (x-n to x+n, y-n to y+n). Then the sum difference would be the sum of the absolute values of all the elements in the matrix resulting from the subtraction.
  • 32. Page | 32 If the difference is greater than a certain preset number, then the match is disregarded. This is simply because if there the difference is too huge then the relationship between the two corners may be considered too unreliable, that is, they are not really matches at all. Figure 4.4: Matched corners as a many- many relation between corners on image1 and corners on image2 that are its candidate matches with unreliable pairs removed. The candidate (i,j) with the lowest sum difference to (x,y) is chosen as a match for (x,y).This means that matched corners is now a many-one relation since it is still possible for several corners on image1 to match to one corner on image2. Figure 4.5: Matched corners as a many-one many relation between each corner on image1 and a corner on image2 that is its best match. However matched corners must be a one- one relation to serve the purpose of homography computation efficiently. In order to achieve this, for each (i,j) on matched corners (i.e. each corner on image2 on matched corners) the entire relation is searched for all corners (x,y) on image1 mapping to (i,j) and only the corner on image1 with the least sum difference for neighbors to (i,j) is kept whereas the rest are discarded. This means that in case there are multiple matches to any (i,j), only the best match is kept finally making matched corners a one-one relation as it was aimed to be in order to serve the purposes of this system. Figure 4.6: Matched corners as a one-one relation with final correspondences
  • 33. Page | 33 4.3 Homography Computation The aim is to compute the homography matrix for the ground plane between the two images image1 and image2. Since H has 8 degrees of freedom, it can be computed using four pairs of matching points between image1 and image2. Some corners are discarded as potentials for calculating H (%HC1). These are pairs of corners with little difference between their positions (<5 in Euclidian distance) and those in the upper half of the image. The algorithm used is a variation of the inhomogeneous RANSAC computation of H developed by myself. The only difference is instead of selecting the homography with the most inliers, the homography with the highest degree of correspondence to corners is selected.
  • 34. Page | 34 The following process is repeated several times, each time calculating a new value of H (%HC2). Four random corners are selected first (i.e. four rows from matched corners are picked) and then it is made certain that no three of these four corners lie on the same line (%HC3). This can be done by checking whether for each trio of corners out of the four (i.e. 4 combinations of 3 corners each) the gradient between two pairs of points from the trio are the same. Then with this set of four corners the h matrix is calculated. The next step is to find out how good the corners selected were for estimating the homography of the ground plane. This can be done by comparing how good estimates of warped positions the homography matrix gives for each corner. For a corner on the initial image (ix,iy) and its corresponding corner on the final image (fx,fy), its warped (expected) position (ex,ey) is computed using (ex,ey,tmp)t = h_matrix*(ix,iy,1)t A comparison is made between ex and ey using the following variables (%HC4). p = Euclidian distance between (ix,iy) and (ex,ey) q = Euclidian distance between (ix,iy) and (fx,fy) r = Euclidian distance between (fx,fy) and (ex,ey) t = angle between lines (ix,iy)to(ex,ey) and (ix,iy)to(fx,fy), using cosine formula on p, q and r. d = t + r*100/p The variable d represents a comparison between the final corner and warped corner. Small values of d indicate that the point d correspond to the same homography as H. This method of comparing final points and warped points will be referred to as the d method throughout the rest of this report. The sum of d’s (diff) is stored for each H (%HC5). The correspondence d between the final and warped corner is thus calculated as a sum of angle between them (from the initial corner) and the distance between them expressed as a percentage of the distance between the initial and final corner (since in the case of small values of p, a simple difference r would not be very reliable). Large values of d, indicate that the corner does not correspond to the homography used. Please note that on the final output corners on the initial image are shown as circles, those on the final image are shown as crosses and warped corners are shown as triangles. The lines p and q (but not r) are shown for each trio of such corners. Figure 4.8: Initial, final and warped corners and the d method for corner comparison
  • 35. Page | 35 After calculating several values of H and their corresponding diff’s, the value of H with the minimum corresponding value of diff (i.e. the H which most corners seem to agree with) is chosen as h_matrix (%HC6).
  • 36. Page | 36 Then corners within a certain threshold of d used by calculating H are selected by calculating d similarly as done earlier (%HC7). The selected corners are now used to compute an even better estimate of H (%HC8), which become the final homography matrix (for the ground plane) used throughout the rest of the program for image1 and image2. Afterwards the expected warped positions of each corner from image1 in matched corners are estimated using h_matrix. Then the coordinates of the corner on the initial image, its corresponding corner on the final image and the expected corner (found from warping using h_matrix) are stored in rows of a matrix cornerswrp (%HC9). Furthermore, the initial, final and expected corners are plotted as dots, crosses and triangles respectively on both images with line between each pair of initial and final corners and another line between each pair of initial and expected corners. (%HC10)
  • 37. Page | 37 4.4 Warping Images In order to detect obstacles, the first step taken is to warp the image from the homography estimated earlier and the initial image. This is basically an image of the scene from the same camera position as where the final image image2 was taken IF all the pixels in image1 were located on the ground plane. For each pixel (x,y) on image1, its position (s,t) on imagew can be calculated using the homography relationship (%IW1) (s t tmp)t = h_matrix*(x y 1)t Then by executing imagew(s,t) = image1(x,y) the contents of the pixel are transferred to imagew. However, this method is incomplete since some pixels on imagew may not be mapped on to at all and some pixels may be mapped more than once. Let us first consider the case of the latter. Another matrix plottedw of same dimensions as imagew is initialised with 0s, such that plottedw(s,t) indicates how many (x,y)’s have mapped on to (s,t) on imagew. Everytime a point (s,t) on imagew is plotted on to by a point(x,y) in image1, plottedw(s,t) is incremented by 1 and the contents of image1(x,y) is added to imagec(s,t). This means that finally plottedw(s,t) holds the number of times each point (s,t) on imagew has been plotted and imagew(s,t) hold the sum of all values of image1(x,y) that (s,t) has been plotted on to by (%IW2). In order for imagew to hold the actual warped image, the average value for each pixel is found. This can be done simply by dividing each element of imagew (for pixels that have been plotted at least once) by the corresponding element in plottedw (%IW3).
  • 38. Page | 38 Now let us the consider the case where a point (s,t) on imagew has not been plotted at all. The simplest thing to do would be average the values of all its eight neighboring pixels and store that in imagew(s,t). However one must also consider the possibility that some of its neighboring pixels may not have been plotted either. The basic idea is to find out the number of (s,t)’s neighboring pixels that are plotted nbrs_pltd by checking whether plottedw(i,j) > 0 and summing the value of image w(i,j)’s where (i,j) represent neighbors that are plotted already nbrs_sumd (%IW4). The value of imagec(s,t) can then be interpolated by averaging these values i.e. imagec(s,t) = nbrs_sumd / nbrs_pltd and then plotted3(s,t) is set to 1 indicating (s,t) has now been plotted (%IW5) In case none of the neighbors have been plotted, the pixel is left as it is while a count is kept (%IW6) of how many pixels have not been plotted at all (notplotted). The entire process is repeated until all the pixels on imagec have been plotted i.e. until not plotted=0 (%IW7). It is a safe assumption that this loop will terminate given that at least one pixel on imagec has been plotted and the rest would be interpolated from it.
  • 40. Page | 40 4.4.1 Warp Comparator Perhaps the crudest method of obstacle detection is from a comparison between the warped image imagew found earlier and the final image image2. A pixel-pixel comparison would be pointless since the likelihood of every pixel on the ground plane matching perfectly regardless of the accuracy of our estimation of h is rather minuscule. The approach taken is to compare 16x16 blocks of image2 with corresponding 16x16 blocks of imagew, calculating the difference between each corresponding pixel and summing their absolute values to give the block differences (blockdiff). If blockdiff for a particular block is above a certain threshold, it is safe to assume the pixel on that block do not correspond well with the homography of the ground plane and the entire block can thus be treated as an obstacle. As mentioned earlier both images are divided into blocks of 16*16 pixels. So, block (i,j) for imagex would encompass pixels ({i-1}*16+1 to i*16, {j-1}*16+1 to j*16) from imagex, i.e. a 16x16 matrix of pixels. e.g. block (i=1,j=1) would include pixels with x-coordinates 1 to 16 and y-coordinates 1 to 16, i.e. 256 pixels. The block difference blockdiff(i,j) for each block (i,j) is calculated simply by subtracting the parts of matrices from imagew and image2 that block (i,j) encapsulates and then summing their absolute values (%WC1). Therefore blockdiff would contain the differences between corresponding pixels from each block in image2 and imagew. As stated earlier, if blockdiff(i,j) is above a certain threshold all pixels in block (i,j) are considered parts of obstacles (%WC2). An improvement is made to this approach for obstacle detection by taking into account corners that lie in each block. If any corner in a block (i,j) does not correspond to the homography of the ground plane by using the d method (%WC3) i.e. if d is above a certain tolerance limit, it can be assumed that it is part of an obstacle and the entire block can be marked as one. This is done simply by adding the threshold to blockdiff(i,j) if (i,j) contains any such corners. This means that regardless of the block differences previously found earlier, the discovery of a non- corresponding corner in block (i,j) would force blockdiff(i,j) across the threshold indicating an obstacle (%WC4).
  • 41. Page | 41 Finally a new image imagec is created representing the comparison between the final image image2 and the warped image imagew. Imagec is essentially a copy of image2, however blocks on imagec that have blockdiff(i,j)>threshold are left as black indicating obstacles. This can be done by initialising imagec as composed of just black (0 value) pixels and then copying all pixels from all blocks (i,j) from image2 to imagec unless blockdiff(i,j)>threshold (%WC2). The image imagec can then just be displayed as any standard image is displayed while blocks of black on the display will indicate obstacles found using the warping method (%WC5)
  • 42. Page | 42 4.5 Fundamental Matrix Computation The algorithm, given pairs of matching points, uses RANSAC to compute the fundamental matrix which it returns along with a set of pairs of matching points that agree well with the epipolar geometry computed. [matrix, goodmatchL, goodmatchR, residual] <- fundamental_RANSAC(matchL,matchR) The function takes in matchL and matchR (which are 3xn matrices) as parameters which contains homogenous co-ordinates of n points on each column in matchL and its match on the corresponding column is in matchR. Similarly goodmatchL and goodmatchR are 3xn matrices containing homogenous co- ordinates of matching points given that these points agree well with the fundamental matrix computed. The returned value residual is the average residual of good matching pairs. The algorithm is the 8-point normalized algorithm for the computation of F. After the normalization of point-correspondences given as parameters, it uses RANSAC to randomly select a subset of these correspondences and computes the fundamental matrix. It then computes epipolar lines for each point on the initial (or left) image and then calculates the distance of the their matches on the final (or right) image to it. Point correspondences for which this distance is below a threshold are considered as inliers. The process of random selection, matrix computation and inlier identification is repeated several times and the fundamental matrix with the most number of inliers is selected for further computation. The fundamental matrix is then recomputed using all the points that were earlier identified as inliers. 4.6 Image Segmentation and Edge Detection 4.6.1 Colour Segmentation and Edge Detection Code written by Chen [5] is also used to segment images and find edges based on colour variation. His algorithm uses the pattern recognition technique of k-means clustering (Section 2.7.1) to classify pixels on the image according to colour thus performing colour segmentation. After that the standard Matlab function edge is used (with “Canny” as the chosen method) to perform edge detection. [colour_seg edge_seg]<- kmean_seg(im) When given an image im, it returns the following images (or matrices) which are of the same dimensions as im colour_seg - This is the simply the image im after the k-means clustering method is performed, that is, the pixels on the image have been put into distinct classes depending on their colour.
  • 43. Page | 43 edge_seg - This is the result of performing canny edge-detection on the image colour_seg. It is a binary binary image with 1s representing edges and 0s representing any other pixels on colour_seg. So, if the point (x,y) was part of an edge on the initial image im then edge_seg(x,y)=1 otherwise edge_seg(x,y)=0 4.6.2 Object Segmentation The algorithm for colour segmentation returns an image imageseg which basically used kmeans clustering for the classification of pixels that are similar in colour. However this means that pixels on two separate objects of similar colour will be members of the same class. The idea here is to classify the pixels such that only pixels on the same object (with an enclosed edge) are members of the same class. A very simple approach is taken to accomplish this from the already colour segmented image imageseg. The method involves taking each pixel and then finding out which of its already classified neighboring pixels it matches most closely with. Since pixels are selected left to right top to bottom, the already classified neighboring pixels would be its left, top and top left neighbors. The pixel (x,y) is classified into the same segment as that of the neighbor (i,j) it most closely resembles in terms of colour segmentation (i.e. has minimum difference in value) by setting segment(x,y) = segment(i,j) %OS1. However if this minimum difference is above a threshold, we can assume it is part of a different segment. In such cases, a new segment/class is created and the pixel (x,y) is assigned to it by setting segment(x,y) = newsegment (%OS2). Image with colour segmentation (imageseg) New segmentation map (segment) Please note that for pixels on the first row or first column, there is only one neighboring pixel that has been classified so there is no need to find a minimum (%OS3). The first pixel (1, 1) is set as part of segment 1, i.e. segment (1, 1) =1, to initialize the process (%OS4). It is still possible for an object to be divided into several segments. This may happen if parts of the object were approached at different times by the segmenting algorithm and a new segment was created each of these times. To tackle with this problem, all The comparisons between made between each pixel (x,y) and its already segmented neighbours. This is done by calculating the differences between the pixels. The segment chosen for (x,y) is that of the neighbour it has least difference with (provided this is below the threshold) Figure 4.15: Comparisons of pixels to its neigbours and segmentation
  • 44. Page | 44 pairs of consecutive pixels must be analyzed and if they are similar in intensity, the segment of the second pixel must be set to the segment of the first pixel. Moreover, all the pixels earlier in the segment of the second pixel are assigned the same segment as the first pixel.
  • 45. Page | 45 4.7 Height estimation 4.7.1 Height estimation of points In order to estimate the height of each point, it is necessary to know the homography of the plane it corresponds to (Section 2.4.2). So, homographies of each plane at intervals of one distance unit (cm) are computed using the standard homography formula for parallel planes using h_matrix as H from distance = camera height (ch) and h_inf as H from distance = infinity (%HP1). H_matrices is assumed to be a 3 dimensional array of dimensions (0-ch,1-3,1-3). It is computed such that h_matrices(i,1-3,13) returns a 3*3 matrix that is the homography of the plane at height i. h_inf is assumed to be the identity matrix for simplicity in this project since points at infinity hardly seem to move regardless of camera motion In order to estimate the height of a point (ix,iy) on image1 which has a corresponding point (fx,fy) on image2, (ex,ey) is calculated for (ix,iy) for each parallel plane at heights i = 0 to ch and a comparison is made between (ex,ey) and (fx,fy) using the d method (explained earlier) %HP2. The height i selected as the estimated height for (ix,iy) is the height at which using h_matrices(i) the comparing variable d has the lowest value, i.e. the height at which the point (ix,iy) seems to match the best to (%HP3). Please note that since Matlab does not allow global variables h_matrices needs to passed as a parameter for calculateheight. height <- calculateheight(ix,iy,fx,fy,h_matrices
  • 46. Page | 46 4.7.2 Height estimation for segments The height of each segment can be found simply by going through each corner and then calculating the heights of each corner. If the height h of a corner (x,y) is greater than the height the currently set height for the segment it belongs to i.e. segment(x,y), h is set as the new height of that particular segment (%HS1). This way, the maximum height among the corners of a segment is stored as the height of the segment. Finally an image heightimage is created showing the heights of each segment. This is done by assigning each pixel (x,y) on heightimage as the height of the segment(x,y) lies in (%HS2). This would mean that heightimage now contains values possibly 0 to ch (0 indicating ground). To represent the height of segments better, each pixel of height image is divided by the maximum possible height ch and multiplied by the maximum possible pixel value (255 for a 8-bit greyscale image). Ultimately on heightimage (%HS3), pixels would appear darker if they are part of a segment that is nearer to the ground (completely black if at height 0) and lighter as the segment is further from the ground in terms of height (completely white if at height ch).
  • 47. Page | 47 4.8 Contour matching The fundamental matrix F is computed using the set of matching corners found earlier as input parameters. The aim is to find matching points along the contour between image1 and image2. We know that that the fundamental matrix can be used to give the equation of the epipolar line (%CM1) on image2 for each point (x,y) on image1. Using this line j = lm*i+lc, it is possible to find a set of points within a certain region that are possible candidates for matches to (x,y). (Section 2.3.1) The points we are considering on image1 are those that lie on edges, i.e. edgeim1(x,y)=1. Candidate matches on image2 would be points on image2 along the line j=lm*i+lc within a certain window w that lie on edges (%CM2), i.e. image2(i,j)=1. Since really large or small values of lm (gradient) can make i change very little or a lot respectively with respect to j over the window, i is varied over the window and j calculated from it for small values of lm (%CM3) whereas j is varied over the window and i calculated from it for larger values of lm using the equation i = (j – lc) / lm (%CM4). The rest of the matching process is exactly the same as that for corners. Differences between neighboring regions are calculated and the candidate with the least difference is chosen as the matching corner (%CM5). After that many-one matches are removed by only keeping points on image1 that have the least difference for a set of multiple points matching to a single point on image2 (%CM6).
  • 48. Page | 48 The height for each point along the contour can be found using height(x, y, i, j, h_matrices) where (x, y, i, j) is a row of matchingpoints (%CM7). This can be later shown on image1 and it can be observed how the estimate height increases or decreases along the contour as the actual height increases or decreases. Then for each element (x, y, i, j) on matchedpoints, its height can be displayed on coordinates (x,y) on image1 and (i,j) on image2, since (x,y) and (i,j) give the position of the same point on the scene on image1 and image2 respectively. (%CM8)
  • 49. Page | 49 5EVALUATION Evaluation is a vital part of any system development process. It is not possible to know whether a system meets its initial requirements without a thorough investigation of its operation using a range of experiments. A test plan is first included in this chapter explaining a range of experiments that are necessary to evaluate this system thoroughly. Afterwards, the implementation of each test and its results are discussed with a brief summary of the evaluation conducted. 5.1 Point Correspondences 5.1.1 Corner detection As mentioned earlier this is initially dependent on how well corners can be found on both image and then a correspondence relationship can be established between pairs of corners each of which are on a different image. The Harris corner detector was used to perform this initial task of locating corners. The results were very encouraging since in most occasions a large number of corners could be found. Moreover, even when the ground plane and the object were very similar in colour the Harris detector was able to locate the corners which is considered quite difficult. 5.3.2 Matching correspondences Matches of pairs of corners were found by initially taking one pixel on image1 and then looking at the neighborhood of every pixel on image2 within a certain radius of it and picking the closest matches. As expected if there were too many corners in the neighboring regions, the process was considerably slow and took up to three minutes for an image with around a 200 corners (Figure 5.1b). The other problem faced was when there were too many putative matches that had similar neighborhoods as the corner being matched. This is very likely in floors which have a chessboard pattern with very small blocks. Let us assume, a corner on the top right of a black block on image1 is being matched. If the pattern is really dense then it is possible there might be several top right corners on black blocks on image2 within the window of search. This means that several candidate matches may have exactly the same neighboring regions as the initial corner and it may be matched with any one of these candidates not necessarily the right one, eventually leading to degeneracies in the computation of the homography of the scene. If there is too much texture however, e.g. a grainy pattern on the floor, the corner detector may detect literally thousands of corners on the scene and may take a while processing matches which will be highly inaccurate (Figure 5.1b). However if the pattern is not very distinct, it does not regard any of the grains as corners at all and so no corners or point correspondences can be found. A mid-way scene in terms of finding good point correspondences is one with a few corners on the ground e.g. pieces of paper on the ground (Figure 5.1c). Ground planes such as this are used throughout the latter stages of evaluation. The best corner correspondences can probably be found with a tiled floor where each tile (unlike the chessboard) is big enough for there to not be two similar corners on the search window of each corner being matched (Figure 5.1e).
  • 50. Page | 50 Please Note: The figures show corners on the initial image as dots and the corners on the final image as crosses. There is a line between a dot and a cross if the pair is matched corner. Corners with circles around them are those considered reliable for homography computation. 5.1a:No texture at all on background 5.1b:Grainy carpet - Too much texture on background 5.1c: Pieces of Paper – Medium texture Figure 5.1: Scenes with different ground planes
  • 51. Page | 51 Point correspondences are constrained by the window used to search for candidate matches. This means that if the camera is moved forward or backward too much between the two images, the actual match for an initial corner may not be within its search window and will not be considered as a candidate match for it (Figure 5.2c). This means the corner is not matched to anything at all or in the worse case inaccurately to a random candidate corner within its window. On the other hand if the movement is too small (Figure 5.2b), most point matches will be considered as too close and thus unreliable for computing H and they will be disregarded. Camera movements between 5cm and 10cm were considered the most suitable for these set of experiments. 5.1d:Frequent tiles – Too much texture 5.1e:Large Tiles – Most desirable texture Figure 5.1: Scenes with different ground planes (continued)
  • 52. Page | 52 5.3 Computing homography and corner heights As mentioned earlier the computation of H is entirely dependent on the location of point correspondences between the two images of the scene. Estimation of heights of corners and points along contours are done at the same time and so these were evaluated at the same time as the computation of H. How well H has been computed can be observed by having a look at both images with each initial corner, its matched final corner and its warped position estimated from the computed value of H. The closer the final and warped positions of each corner on the ground are, it can be assumed the more accurate the computation of H was. Moreover if the computation of H is accurate, then the computed heights of corners on the ground and obstacles would be consistent with their real heights. Graphs of actual heights and computed heights along with the correlation coefficients between them give a good picture of how well the homography for the scene has been computed. 5.2a: Initial image 5.2b:Final Image - Too little movement 5.2c:Final Image - Too much movement 5.2d: Final Image - Adequate movement Figure 5.2: Movement of camera between images and its effects
  • 53. Page | 53 Corners in the background did not have much on an effect on the computation of H, since only corners on the lower half on the image were taken into account while performing the RANSAC algorithm. Inaccurate point correspondences on the floor owing to too much texture on it may lead to degenerate computations of H. As a result heights estimated will not be accurate either.
  • 54. Page | 54 If there are no point or few correspondences on the ground (that is there is either too much texture on it or none at all), the RANSAC algorithm attempts to compute H by using the corners on the base of the obstacle. This does not lead to a very accurate estimation of H since there are very few such corners usually present. Moreover this is only possible if the base of the object lies in the lower half of the image since anything above it are disregarded during the computation of H. It is also possible for RANSAC to chose points that are on a different plane above the ground to compute H. E.g. in Figure 5.3a, corners on the 10cm plane (marked with circles) are chosen by RANSAC for the final computation of H. As a result, all computed heights of corners are about 10cm less than their actual heights with 10cm being identified as 0cm (Figure 5.3c). There is a still strong correlation between actual and computed heights as seen in Figure 5.3b, with the correlation coefficient computed as 0.75, however there is an x-intercept of around 6cm (which is almost equal to the height of the plane H corresponds to) As mentioned earlier, with a few flat objects (e.g. pieces of paper) on the floor, a decent estimation of H can be expected (Figure 5.4a). Corners marked with circles are used for the computation of H and all these lie on the ground plane. As one can see the regression line of computed vs actual heights is very close to the line of perfect computation (where computed height = actual height). The correlation coefficient was computed at 0.80 which is quite decent. Moreover the line almost passes through the origin. A floor with large tiles would yield the maximum point correspondences and thus the best computation of H. Another point to note is that height estimations are highly inaccurate for heights close to the camera height. This can be observed in Figure 5.4b where the camera is at 75cm.
  • 56. Page | 56 5.4 Computing epipolar geometry and contour heights As with the computation of the homography of the scene, the computation of the fundamental matrix is completely dependent on the location of point correspondences between the initial and final images. The accuracy of the estimation of F can be observed by having a look at the epipolar lines of each initial corner and checking whether the matching final corners lie on the corresponding epipolar lines. Furthermore, point correspondences along the contours can be found using the fundamental matrix to define a search trip along the epipolar lines for each point on the contours. How well these points match keeping in mind the camera motion is an even better indicator of the how good the computed estimate of F is. As in the case of the homography, inaccurate point correspondences lead to very degenerate computations of epipolar geometry. For scenes with few point correspondences the fundamental matrix computed was not very accurate and lead to many inaccurate point matches along the contours. For scenes with a decent number of correspondences the fundamental matrix computed was quite a good estimate and the point matches along the contours were more or less perfect. For scenes with an abundant number of correspondences the computation of F was more or less perfect and so were the consequent point matches along the contours. Figure 5.5 shows a decent computation of epipolar geometry owing to good point correspondences on the ground and well-performed edge detection. Epipolar lines and edge heights are shown as well. Finally in 5.5d, the obstacle detection methods using heights of edges (in blocks) are shown, with lighter blocks indicating greater heights. 5.5a: Final Image - Contour matching 5.5b:Final Image - epipolar lines of corners 5.5c:Final Image - Contour Heights Figure 5.5: Contour matching, epipolar lines and heights along contours
  • 57. Page | 57 5.5 Image warping and obstacle detection Since the pixels of the warped image can be thought of as functions of pixels of the initial image with the homography matrix as a parameter, any obstacle detection method using the warping image would be dependent on the accuracy of the homography matrix. We can simply look at the final image, warped image, the difference image and the block difference image to observe how well the system has performed at detecting obstacles. As expected degenerate computations of the homography matrix (e.g. where corners on a plane other than the ground have been used to compute it because of the lack of corners on the ground or simply where point correspondences were computed incorrectly) objects on the ground may easily be detected as obstacles. If there are too few corners on the ground, the estimate for H is not very accurate and thus the warped image will not be a very good representation of the initial image after the camera motion. This may lead to objects on the floor being detected as obstacles as well. In the case of objects with very little texture on the ground (assuming the homography computed is a decent estimation), only blocks around the edges of objects will be detected as obstacles. This is simply because when comparing the final and warped images, there is not much difference towards the center of the object because of the lack of texture. However the pixels are obviously conspicuously different along the contours of the object. Even though this performs the task of obstacle detection to some extent, it is quite fallible. For example, in the case where the object and the ground behind it are of more or less the same colour (brown box on Figure 5.6b), there will not be much difference in pixels values even along the contours and thus no obstacles will be detected at all. One must also realize that depending on the threshold set for block 5.5d:Obstacle detection via Contour Heights Figure 5.5: Contour matching, epipolar lines and heights along contours (Continued)
  • 58. Page | 58 differences, this method can only detect obstacles over a certain height (around 10cm in these experiments). Setting the threshold too high means that most objects will not be detected as obstacles and setting it too low means that even the slightest texture on the ground may be identified as obstacles. Even if a large number of good point correspondences are used to compute H, it is still merely an estimate. For this reason, if there is a lot of texture on the ground in the initial image, they will not be transferred perfectly to the warped image and this might lead to inconsistencies with the final image. As a result, anything with texture on the ground may be detected as an obstacle (Figure 5.6d). The best case scenario for this method of obstacle detection is perhaps when the computation of H is decent, there is very little texture on the ground and a lot of it on the obstacles (square patterned box on figure 5.6b). The image warping method seems to work for all shapes of objects given there is enough texture on the object and the homography is computed more or less accurately.
  • 59. Page | 59 5.6 Segmentation and obstacle detection This depends on how well H has been computed (consequently how well the heights of corners have been estimate) and how easily the image can be segmented. Assuming a decent computation of H, there are mainly two cases we have to consider. If the obstacle and ground are more or less the same colour, they may be segmented as one object (Figure 5.7b). So the maximum height of a corner in the object is considered the height for all points on the segmented object. As a result all points on the ground would be assigned the same height and the entire ground would be indicated as an obstacle (Figure 5.7c). 5.7a:Final Image - Heights of Corners 5.7b:Final Image – Segmentation 5.7c:Final Image – Obstacle detection Figure 5.7: Segmentation and Obstacle Detection - Obstacle and background similar in colour
  • 60. Page | 60 If the obstacles and the ground are different colours, they are segmented as separate objects. As a result pixels on the ground are given more or less the height of 0 (depending on how good the estimation of H is). Obstacles on the other hand are treated individually and are given more or less accurate heights (Figure 5.8). However, if the object has quite a bit of texture in it (e.g. stripes), it may be segmented as several objects and each segment may have its own height (Figure 5.9). 5.8a:Final Image - Heights of Corners 5.8b:Final Image - Segmentation 5.8c:Final Image - Obstacle detection Figure 5.8: Segmentation and Obstacle Detection - Obstacle and background different in colour
  • 61. Page | 61 e.g. If the object has horizontal stripes, it will be divided into horizontal segments with each segment having a progressively higher height value (Figure 5.9). 5.9a Final Image - Heights of Corners 5.9b: Final Image – Segmentation 5.9c: Final Image – Obstacle detection Figure 5.9: Segmentation and Obstacle Detection - Stripes on obstacle
  • 62. Page | 62 5.7 Summary of Evaluation A range of experiments have been conducted to evaluation the performance of the solution to each basic sub-problem (e.g. corner detection) to the three obstacle detection methods used in this project. From the experiments conducted it is obvious that each of the three methods of obstacle detection do not perform their best under the same set of scene characteristics. The following is a table of methods of obstacle detection and the features of an ideal scene for each of them. Table 5.1: Methods of obstacle detection and preferred scene features
  • 63. Page | 63 6 Appendix Programming Codes % Main program file1 = 'image1.jpg' % Initial input image file file2 = 'image2.jpg' % Final input image file % Choosing which methods of obstacle detection to use segmenter=1 edger=1 warper=1 image1=imread(file1); [row,col,color]=size(image1); image2=imread(file2); % Corner Detection sigma=2; thresh=1000; radius=2; disp=1; [iscornerim1, r1, c1] = harris(image1, sigma, thresh, radius, disp); [iscornerim2, r2, c2] = harris(image2, sigma, thresh, radius, disp); % Image segmentation and edge detection [im edgeim1] = kmean_seg(file1); [im edgeim2] = kmean_seg(file2); %%%%%%%%%%%%%%%%%%%% % Matching Corners % %%%%%%%%%%%%%%%%%%%% cornertotals = [] % Matching Corners resulting in one-many pairs for z=1:size(r1) x = r1(z); y = c1(z); if x>windowsize & y>windowsize & x<row-windowsize & y<col- windowsize mintotal = 30000;
  • 64. Page | 64 found = 0; for i=(x-windowsize):(x+windowsize) for j=(y-windowsize):(y+windowsize) if i>nhood & j>nhood & i<row-nhood & j<col-nhood & iscornerim2(i,j)==1 diff_total = sum(sum(abs(double(image1(xnhood:x+nhood,y-nhood:y+nhood)) - double(image2(i-nhood:i+nhood,jnhood:j+nhood))))); if diff_total<mintotal mintotal=diff_total; tempi = i; tempj = j; found = 1; end end end end if found>0 cornertotals = [cornertotals; x y tempi tempj mintotal]; end end end [nomatchedcorners tmp] = size(cornertotals); matchedcorners = []; % Matching Corners resulting in one-one pairs tempx=0; tempy=0; for u=1:nomatchedcorners i = cornertotals(u,3); j = cornertotals(u,4); mintotal = 65535; for v=1:nomatchedcorners a = cornertotals(v,1);