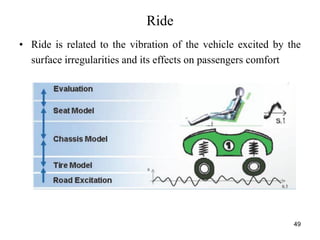
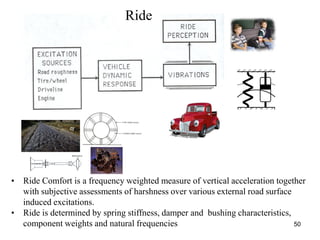
Downloaded 412 times


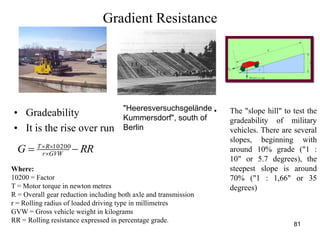

![Gradeability
91
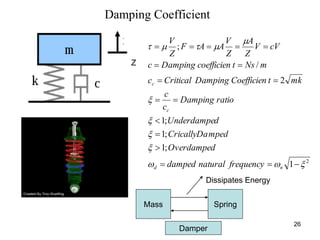
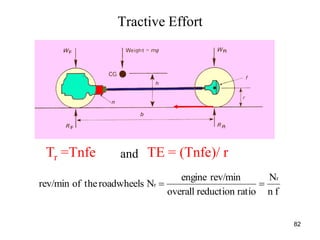
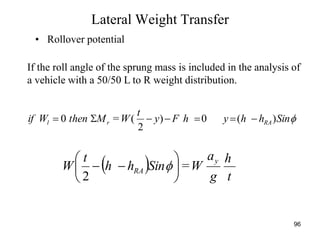
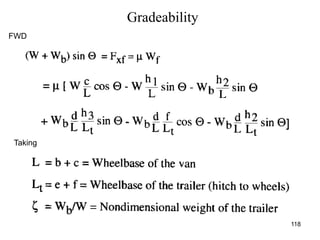
fWSinW
W Sin = Wf = (W c cos - (W/g) ax h - DA ha - W h sin)/L
Neglecting drag forces on a car, the grade can be calculated using
the following equation for front wheel drive vehicle
hL
hgac x
])/([
For a rear wheel drive
hL
hgac x
])/([](https://image.slidesharecdn.com/vehicledynamicscourse-171020104659/85/Vehicle-dynamics-course-91-320.jpg)
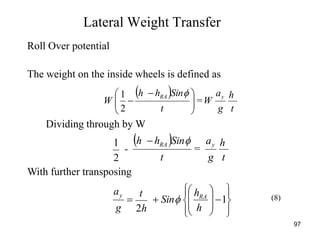

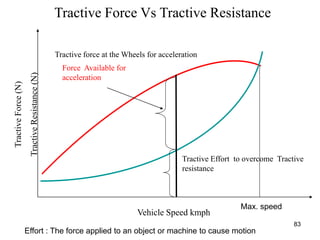
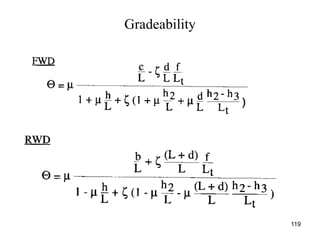
![Determination of Unknowns
117
Unknowns are : Wf, Wr, Fxb, Fzb
cb
hFdcbFWbSinWh
W
cb
hFdFSinWhCosW
W
fe
SinhSinhfW
F
WF
xbzb
r
xbzbc
f
b
zb
bxb
21
21
32
)(cos
]cos[
sin
If there are drag forces and inertia forces they need to be
considered while determining these forces](https://image.slidesharecdn.com/vehicledynamicscourse-171020104659/85/Vehicle-dynamics-course-117-320.jpg)

This document provides an overview of a vehicle dynamics course. It discusses topics that will be covered such as vehicle dynamics fundamentals, load transfer, acceleration and braking performance, wheel alignment, handling, ride forces, suspension technologies, tires, and vehicle dynamic tests. The course will examine chapters on vehicle dynamics, longitudinal and lateral load transfer, tractive effort and forces, weight transfer, and the relationship between road loads and tractive resistance. It also provides examples of vehicle dynamic field tests. The goal is for students to gain an understanding of key vehicle dynamics concepts and metrics.


