Van
•Download as DOCX, PDF•
0 likes•70 views

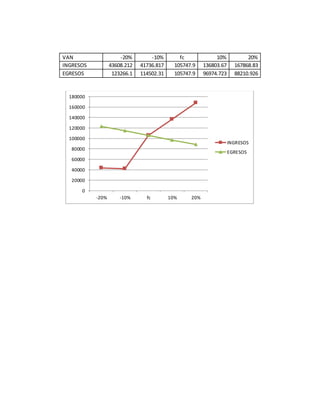
This document contains a chart showing income and expenses over a range of percentages from -20% to 20%. Income increases from around $43,000 at -20% to over $167,000 at 20% while expenses decrease from over $123,000 at -20% to around $88,000 at 20%. Expenses are shown to equal income at the forecasted level of 0%.
Report
Share
Report
Share
Recommended
Bản vẽ khung Đồ án kết cấu thép
The document contains numerical data organized into tables with rows and columns. The tables include numbers such as 6000, 90000, 800, 1200, 750750, 16500, 18000, 6200, and 0. The tables also include labels such as A, B, Q, i, hf, L, and dates like 16/7/2018 and 06/4/2018.
Ayuda didactica
This document contains percentages ranging from 1% to 50% and corresponding values. It appears to be calculating percentages of given values, as there are numbers listed below the percentages that could represent original or resulting values after applying the given percentages. The percentages and numbers are not labeled or explained, so it is difficult to determine the exact calculations or context without more information.
Triannual accounts results FHC HONEYMOON POLYNESIA
The document shows financial data for 4 outlets over 3 years including gross outlet, gross margin, gross operating surplus, and operating result. It shows the outlets had declining or no sales and profits with outlet AIT having an operating loss of $1,173,000 and outlet Consumer Goods having an operating loss of $391,000. Variable charge rates, salaries, taxes, rents and other expenses are also shown increasing over the 3 years.
FHC BAUSTRIAP 2017
YOUR BUSINESS IS YOUR PROFITABILITY IN CONCEPT HOTEL FUTURIST. SEE YOUR FUTURE AS YOUR PRESENT AND INVEST IN CREATIVITY THAT MAKES SENSE AND REALITY FOR BOTH GUESTS, MANAGEMENT AND STAFF. A NEW VISION AT SHORT TERM, MID TERM OR LONG TERM QUALITY AND TECHNOLOGY HOSPITALITY INDUSTRY.
Formula 1 race car concept design
The document summarizes different formula 1 race car designs. It provides details on weight, engine size, fuel type, and number of laps for a standard race. It then lists several experimental designs from engineer Andy Appan showing improvements in speed, lap time, and number of laps saved over the standard design. The best performing design uses a mid-wheel drive with an engine output of 1600cc that could complete the 60 lap race in just 38 seconds, saving over half an hour compared to the normal design.
The Power of Data to Keep Cities Moving
1) Traffic congestion has major negative economic and environmental impacts on cities around the world, with citizens spending significant time stuck in traffic daily.
2) Broadcasters play a critical role in alleviating traffic pains by informing hundreds of thousands of people through traffic reports to help them save time on roads.
3) The Waze app and Waze for Broadcasters program provide real-time traffic and mobility data and insights to over 600 broadcasters worldwide, empowering them to better report traffic conditions and routes to drivers.
Niveles De Aislamiento
Este documento describe diferentes niveles de aislamiento de transacciones en bases de datos y sus características. Menciona los niveles de aislamiento de lectura no comprometida, lectura comprometida, lectura repetible y secuenciable. También describe posibles efectos de simultaneidad como lecturas sucias, no repetibles o fantasmas. Explica que SQL Server permite más niveles que Oracle y que el nivel apropiado depende del equilibrio entre integridad de datos e impacto en el rendimiento.
Proyecto s.o
Este documento presenta un resumen del proyecto final de un sistema operativo llamado AmayaOS desarrollado por un grupo de estudiantes. Comenzó en 2014 como un proyecto en SourceForge para crear un SO simple y libre para revivir computadoras antiguas, aunque su objetivo principal era aprender sobre programación y sistemas operativos. Explica las características y funcionalidades de AmayaOS así como su administración de procesos, memoria y archivos en comparación con otros sistemas operativos similares.
What's a worker’s market? Job quality and labour market tightness
What's a worker’s market? Job quality and labour market tightnessLabour Market Information Council | Conseil de l’information sur le marché du travail
In a tight labour market, job-seekers gain bargaining power and leverage it into greater job quality—at least, that’s the conventional wisdom.
Michael, LMIC Economist, presented findings that reveal a weakened relationship between labour market tightness and job quality indicators following the pandemic. Labour market tightness coincided with growth in real wages for only a portion of workers: those in low-wage jobs requiring little education. Several factors—including labour market composition, worker and employer behaviour, and labour market practices—have contributed to the absence of worker benefits. These will be investigated further in future work.Abhay Bhutada Leads Poonawalla Fincorp To Record Low NPA And Unprecedented Gr...
Under the leadership of Abhay Bhutada, Poonawalla Fincorp has achieved record-low Non-Performing Assets (NPA) and witnessed unprecedented growth. Bhutada's strategic vision and effective management have significantly enhanced the company's financial health, showcasing a robust performance in the financial sector. This achievement underscores the company's resilience and ability to thrive in a competitive market, setting a new benchmark for operational excellence in the industry.
一比一原版(UCSB毕业证)圣芭芭拉分校毕业证如何办理
UCSB毕业证文凭证书【微信95270640】办理圣芭芭拉分校毕业证成绩单(Q微信95270640)毕业证学历认证OFFER专卖国外文凭学历学位证书办理澳洲文凭|澳洲毕业证,澳洲学历认证,澳洲成绩单 澳洲offer,教育部学历认证及使馆认证永久可查 ,国外毕业证|国外学历认证,国外学历文凭证书 UCSB毕业证,UCSB毕业证,UCSB毕业证,UCSB毕业证,UCSB毕业证,UCSB毕业证,UCSB毕业证,专业为留学生办理毕业证、成绩单、使馆留学回国人员证明、教育部学历学位认证、录取通知书、Offer、
【实体公司】办圣芭芭拉分校圣芭芭拉分校毕业证成绩单学历认证学位证文凭认证办留信网认证办留服认证办教育部认证(网上可查实体公司专业可靠)
— — — 留学归国服务中心 — — -
【主营项目】
一.圣芭芭拉分校毕业证成绩单使馆认证教育部认证成绩单等!
二.真实使馆公证(即留学回国人员证明,不成功不收费)
三.真实教育部学历学位认证(教育部存档!教育部留服网站永久可查)
四.办理各国各大学文凭(一对一专业服务,可全程监控跟踪进度)
国外毕业证学位证成绩单办理流程:
1客户提供圣芭芭拉分校圣芭芭拉分校毕业证成绩单办理信息:姓名生日专业学位毕业时间等(如信息不确定可以咨询顾问:我们有专业老师帮你查询);
2开始安排制作毕业证成绩单电子图;
3毕业证成绩单电子版做好以后发送给您确认;
4毕业证成绩单电子版您确认信息无误之后安排制作成品;
5成品做好拍照或者视频给您确认;
6快递给客户(国内顺丰国外DHLUPS等快读邮寄)。
专业服务请勿犹豫联系我!本公司是留学创业和海归创业者们的桥梁。一次办理终生受用一步到位高效服务。详情请在线咨询办理,欢迎有诚意办理的客户咨询!洽谈。
招聘代理:本公司诚聘英国加拿大澳洲新西兰美国法国德国新加坡各地代理人员如果你有业余时间有兴趣就请联系我们咨询顾问:+微信:95270640田里逡巡一番抱起一只硕大的西瓜用石刀劈开抑或用拳头砸开每人抱起一大块就啃啃得满嘴满脸猴屁股般的红艳大家一个劲地指着对方吃吃地笑瓜裂得古怪奇形怪状却丝毫不影响瓜味甜丝丝的满嘴生津遍地都是瓜横七竖八的活像掷满了一地的大石块摘走二三只爷爷是断然发现不了的即便发现爷爷也不恼反而教山娃辨认孰熟孰嫩孰甜孰淡名义上是护瓜往往在瓜棚里坐上一刻饱吃一顿后山娃就领着阿黑漫山遍野地跑阿黑是一条黑色的大猎狗挺机灵的是山室
1. Elemental Economics - Introduction to mining.pdf
After this first you should: Understand the nature of mining; have an awareness of the industry’s boundaries, corporate structure and size; appreciation the complex motivations and objectives of the industries’ various participants; know how mineral reserves are defined and estimated, and how they evolve over time.
Solution Manual For Financial Accounting, 8th Canadian Edition 2024, by Libby...
Solution Manual For Financial Accounting, 8th Canadian Edition 2024, by Libby, Hodge, Verified Chapters 1 - 13, Complete Newest Version Solution Manual For Financial Accounting, 8th Canadian Edition by Libby, Hodge, Verified Chapters 1 - 13, Complete Newest Version Solution Manual For Financial Accounting 8th Canadian Edition Pdf Chapters Download Stuvia Solution Manual For Financial Accounting 8th Canadian Edition Ebook Download Stuvia Solution Manual For Financial Accounting 8th Canadian Edition Pdf Solution Manual For Financial Accounting 8th Canadian Edition Pdf Download Stuvia Financial Accounting 8th Canadian Edition Pdf Chapters Download Stuvia Financial Accounting 8th Canadian Edition Ebook Download Stuvia Financial Accounting 8th Canadian Edition Pdf Financial Accounting 8th Canadian Edition Pdf Download Stuvia
How Non-Banking Financial Companies Empower Startups With Venture Debt Financing
How Non-Banking Financial Companies Empower Startups With Venture Debt Financing
STREETONOMICS: Exploring the Uncharted Territories of Informal Markets throug...
Delve into the world of STREETONOMICS, where a team of 7 enthusiasts embarks on a journey to understand unorganized markets. By engaging with a coffee street vendor and crafting questionnaires, this project uncovers valuable insights into consumer behavior and market dynamics in informal settings."
Bridging the gap: Online job postings, survey data and the assessment of job ...
Bridging the gap: Online job postings, survey data and the assessment of job ...Labour Market Information Council | Conseil de l’information sur le marché du travail
OJP data from firms like Vicinity Jobs have emerged as a complement to traditional sources of labour demand data, such as the Job Vacancy and Wages Survey (JVWS). Ibrahim Abuallail, PhD Candidate, University of Ottawa, presented research relating to bias in OJPs and a proposed approach to effectively adjust OJP data to complement existing official data (such as from the JVWS) and improve the measurement of labour demand.Tax System, Behaviour, Justice, and Voluntary Compliance Culture in Nigeria -...
Tax System, Behaviour, Justice, and Voluntary Compliance Culture in Nigeria -...Godwin Emmanuel Oyedokun MBA MSc PhD FCA FCTI FCNA CFE FFAR
Lecture slide titled Tax System, Behaviour, Justice, and Voluntary Compliance Culture in Nigeria - Prof Oyedokun.pptxfalcon-invoice-discounting-a-strategic-approach-to-optimize-investments
Falcon stands out as a top-tier P2P Invoice Discounting platform in India, bridging esteemed blue-chip companies and eager investors. Our goal is to transform the investment landscape in India by establishing a comprehensive destination for borrowers and investors with diverse profiles and needs, all while minimizing risk. What sets Falcon apart is the elimination of intermediaries such as commercial banks and depository institutions, allowing investors to enjoy higher yields.
The Rise of Generative AI in Finance: Reshaping the Industry with Synthetic Data
In this presentation, we will explore the rise of generative AI in finance and its potential to reshape the industry. We will discuss how generative AI can be used to develop new products, combat fraud, and revolutionize risk management. Finally, we will address some of the ethical considerations and challenges associated with this powerful technology.
2. Elemental Economics - Mineral demand.pdf
After this second you should be able to: Explain the main determinants of demand for any mineral product, and their relative importance; recognise and explain how demand for any product is likely to change with economic activity; recognise and explain the roles of technology and relative prices in influencing demand; be able to explain the differences between the rates of growth of demand for different products.
Tdasx: Unveiling the Trillion-Dollar Potential of Bitcoin DeFi
Tdasx: Unveiling the Trillion-Dollar Potential of Bitcoin DeFi
一比一原版(UoB毕业证)伯明翰大学毕业证如何办理
UoB本科学位证成绩单【微信95270640】伯明翰大学没毕业>办理伯明翰大学毕业证成绩单【微信UoB】UoB毕业证成绩单UoB学历证书UoB文凭《UoB毕业套号文凭网认证伯明翰大学毕业证成绩单》《哪里买伯明翰大学毕业证文凭UoB成绩学校快递邮寄信封》《开版伯明翰大学文凭》UoB留信认证本科硕士学历认证
如果您是以下情况,我们都能竭诚为您解决实际问题:【公司采用定金+余款的付款流程,以最大化保障您的利益,让您放心无忧】
1、在校期间,因各种原因未能顺利毕业,拿不到官方毕业证+微信95270640
2、面对父母的压力,希望尽快拿到伯明翰大学伯明翰大学硕士毕业证成绩单;
3、不清楚流程以及材料该如何准备伯明翰大学伯明翰大学硕士毕业证成绩单;
4、回国时间很长,忘记办理;
5、回国马上就要找工作,办给用人单位看;
6、企事业单位必须要求办理的;
面向美国乔治城大学毕业留学生提供以下服务:
【★伯明翰大学伯明翰大学硕士毕业证成绩单毕业证、成绩单等全套材料,从防伪到印刷,从水印到钢印烫金,与学校100%相同】
【★真实使馆认证(留学人员回国证明),使馆存档可通过大使馆查询确认】
【★真实教育部认证,教育部存档,教育部留服网站可查】
【★真实留信认证,留信网入库存档,可查伯明翰大学伯明翰大学硕士毕业证成绩单】
我们从事工作十余年的有着丰富经验的业务顾问,熟悉海外各国大学的学制及教育体系,并且以挂科生解决毕业材料不全问题为基础,为客户量身定制1对1方案,未能毕业的回国留学生成功搭建回国顺利发展所需的桥梁。我们一直努力以高品质的教育为起点,以诚信、专业、高效、创新作为一切的行动宗旨,始终把“诚信为主、质量为本、客户第一”作为我们全部工作的出发点和归宿点。同时为海内外留学生提供大学毕业证购买、补办成绩单及各类分数修改等服务;归国认证方面,提供《留信网入库》申请、《国外学历学位认证》申请以及真实学籍办理等服务,帮助众多莘莘学子实现了一个又一个梦想。
专业服务,请勿犹豫联系我
如果您真实毕业回国,对于学历认证无从下手,请联系我,我们免费帮您递交
诚招代理:本公司诚聘当地代理人员,如果你有业余时间,或者你有同学朋友需要,有兴趣就请联系我
你赢我赢,共创双赢
你做代理,可以帮助伯明翰大学同学朋友
你做代理,可以拯救伯明翰大学失足青年
你做代理,可以挽救伯明翰大学一个个人才
你做代理,你将是别人人生伯明翰大学的转折点
你做代理,可以改变自己,改变他人,给他人和自己一个机会大块就啃啃得满嘴满脸猴屁股般的红艳大家一个劲地指着对方吃吃地笑瓜裂得古怪奇形怪状却丝毫不影响瓜味甜丝丝的满嘴生津遍地都是瓜横七竖八的活像掷满了一地的大石块摘走二三只爷爷是断然发现不了的即便发现爷爷也不恼反而教山娃辨认孰熟孰嫩孰甜孰淡名义上是护瓜往往在瓜棚里坐上一刻饱吃一顿后山娃就领着阿黑漫山遍野地跑阿黑是一条黑色的大猎狗挺机灵的是山娃多年的忠实伙伴平时山娃上学阿黑也摇头晃脑地跟去暑假用不着上学阿钩
Financial Assets: Debit vs Equity Securities.pptx
financial assets represent claim for future benefit or cash. Financial assets are formed by establishing contracts between participants. These financial assets are used for collection of huge amounts of money for business purposes.
Two major Types: Debt Securities and Equity Securities.
Debt Securities are Also known as fixed-income securities or instruments. The type of assets is formed by establishing contracts between investor and issuer of the asset.
• The first type of Debit securities is BONDS. Bonds are issued by corporations and government (both local and national government).
• The second important type of Debit security is NOTES. Apart from similarities associated with notes and bonds, notes have shorter term maturity.
• The 3rd important type of Debit security is TRESURY BILLS. These securities have short-term ranging from three months, six months, and one year. Issuer of such securities are governments.
• Above discussed debit securities are mostly issued by governments and corporations. CERTIFICATE OF DEPOSITS CDs are issued by Banks and Financial Institutions. Risk factor associated with CDs gets reduced when issued by reputable institutions or Banks.
Following are the risk attached with debt securities: Credit risk, interest rate risk and currency risk
There are no fixed maturity dates in such securities, and asset’s value is determined by company’s performance. There are two major types of equity securities: common stock and preferred stock.
Common Stock: These are simple equity securities and bear no complexities which the preferred stock bears. Holders of such securities or instrument have the voting rights when it comes to select the company’s board of director or the business decisions to be made.
Preferred Stock: Preferred stocks are sometime referred to as hybrid securities, because it contains elements of both debit security and equity security. Preferred stock confers ownership rights to security holder that is why it is equity instrument
<a href="https://www.writofinance.com/equity-securities-features-types-risk/" >Equity securities </a> as a whole is used for capital funding for companies. Companies have multiple expenses to cover. Potential growth of company is required in competitive market. So, these securities are used for capital generation, and then uses it for company’s growth.
Concluding remarks
Both are employed in business. Businesses are often established through debit securities, then what is the need for equity securities. Companies have to cover multiple expenses and expansion of business. They can also use equity instruments for repayment of debits. So, there are multiple uses for securities. As an investor, you need tools for analysis. Investment decisions are made by carefully analyzing the market. For better analysis of the stock market, investors often employ financial analysis of companies.
1:1制作加拿大麦吉尔大学毕业证硕士学历证书原版一模一样
原版一模一样【微信:741003700 】【加拿大麦吉尔大学毕业证硕士学历证书】【微信:741003700 】学位证,留信认证(真实可查,永久存档)offer、雅思、外壳等材料/诚信可靠,可直接看成品样本,帮您解决无法毕业带来的各种难题!外壳,原版制作,诚信可靠,可直接看成品样本。行业标杆!精益求精,诚心合作,真诚制作!多年品质 ,按需精细制作,24小时接单,全套进口原装设备。十五年致力于帮助留学生解决难题,包您满意。
本公司拥有海外各大学样板无数,能完美还原海外各大学 Bachelor Diploma degree, Master Degree Diploma
1:1完美还原海外各大学毕业材料上的工艺:水印,阴影底纹,钢印LOGO烫金烫银,LOGO烫金烫银复合重叠。文字图案浮雕、激光镭射、紫外荧光、温感、复印防伪等防伪工艺。材料咨询办理、认证咨询办理请加学历顾问Q/微741003700
留信网认证的作用:
1:该专业认证可证明留学生真实身份
2:同时对留学生所学专业登记给予评定
3:国家专业人才认证中心颁发入库证书
4:这个认证书并且可以归档倒地方
5:凡事获得留信网入网的信息将会逐步更新到个人身份内,将在公安局网内查询个人身份证信息后,同步读取人才网入库信息
6:个人职称评审加20分
7:个人信誉贷款加10分
8:在国家人才网主办的国家网络招聘大会中纳入资料,供国家高端企业选择人才
Who Is Abhay Bhutada, MD of Poonawalla Fincorp
Abhay Bhutada, the Managing Director of Poonawalla Fincorp Limited, is an accomplished leader with over 15 years of experience in commercial and retail lending. A Qualified Chartered Accountant, he has been pivotal in leveraging technology to enhance financial services. Starting his career at Bank of India, he later founded TAB Capital Limited and co-founded Poonawalla Finance Private Limited, emphasizing digital lending. Under his leadership, Poonawalla Fincorp achieved a 'AAA' credit rating, integrating acquisitions and emphasizing corporate governance. Actively involved in industry forums and CSR initiatives, Abhay has been recognized with awards like "Young Entrepreneur of India 2017" and "40 under 40 Most Influential Leader for 2020-21." Personally, he values mindfulness, enjoys gardening, yoga, and sees every day as an opportunity for growth and improvement.
2024 State of Marketing Report – by Hubspot
https://www.hubspot.com/state-of-marketing
· Scaling relationships and proving ROI
· Social media is the place for search, sales, and service
· Authentic influencer partnerships fuel brand growth
· The strongest connections happen via call, click, chat, and camera.
· Time saved with AI leads to more creative work
· Seeking: A single source of truth
· TLDR; Get on social, try AI, and align your systems.
· More human marketing, powered by robots
Everything You Need To Know About ChatGPT
ChatGPT is a revolutionary addition to the world since its introduction in 2022. A big shift in the sector of information gathering and processing happened because of this chatbot. What is the story of ChatGPT? How is the bot responding to prompts and generating contents? Swipe through these slides prepared by Expeed Software, a web development company regarding the development and technical intricacies of ChatGPT!
More Related Content
Recently uploaded
What's a worker’s market? Job quality and labour market tightness
What's a worker’s market? Job quality and labour market tightnessLabour Market Information Council | Conseil de l’information sur le marché du travail
In a tight labour market, job-seekers gain bargaining power and leverage it into greater job quality—at least, that’s the conventional wisdom.
Michael, LMIC Economist, presented findings that reveal a weakened relationship between labour market tightness and job quality indicators following the pandemic. Labour market tightness coincided with growth in real wages for only a portion of workers: those in low-wage jobs requiring little education. Several factors—including labour market composition, worker and employer behaviour, and labour market practices—have contributed to the absence of worker benefits. These will be investigated further in future work.Abhay Bhutada Leads Poonawalla Fincorp To Record Low NPA And Unprecedented Gr...
Under the leadership of Abhay Bhutada, Poonawalla Fincorp has achieved record-low Non-Performing Assets (NPA) and witnessed unprecedented growth. Bhutada's strategic vision and effective management have significantly enhanced the company's financial health, showcasing a robust performance in the financial sector. This achievement underscores the company's resilience and ability to thrive in a competitive market, setting a new benchmark for operational excellence in the industry.
一比一原版(UCSB毕业证)圣芭芭拉分校毕业证如何办理
UCSB毕业证文凭证书【微信95270640】办理圣芭芭拉分校毕业证成绩单(Q微信95270640)毕业证学历认证OFFER专卖国外文凭学历学位证书办理澳洲文凭|澳洲毕业证,澳洲学历认证,澳洲成绩单 澳洲offer,教育部学历认证及使馆认证永久可查 ,国外毕业证|国外学历认证,国外学历文凭证书 UCSB毕业证,UCSB毕业证,UCSB毕业证,UCSB毕业证,UCSB毕业证,UCSB毕业证,UCSB毕业证,专业为留学生办理毕业证、成绩单、使馆留学回国人员证明、教育部学历学位认证、录取通知书、Offer、
【实体公司】办圣芭芭拉分校圣芭芭拉分校毕业证成绩单学历认证学位证文凭认证办留信网认证办留服认证办教育部认证(网上可查实体公司专业可靠)
— — — 留学归国服务中心 — — -
【主营项目】
一.圣芭芭拉分校毕业证成绩单使馆认证教育部认证成绩单等!
二.真实使馆公证(即留学回国人员证明,不成功不收费)
三.真实教育部学历学位认证(教育部存档!教育部留服网站永久可查)
四.办理各国各大学文凭(一对一专业服务,可全程监控跟踪进度)
国外毕业证学位证成绩单办理流程:
1客户提供圣芭芭拉分校圣芭芭拉分校毕业证成绩单办理信息:姓名生日专业学位毕业时间等(如信息不确定可以咨询顾问:我们有专业老师帮你查询);
2开始安排制作毕业证成绩单电子图;
3毕业证成绩单电子版做好以后发送给您确认;
4毕业证成绩单电子版您确认信息无误之后安排制作成品;
5成品做好拍照或者视频给您确认;
6快递给客户(国内顺丰国外DHLUPS等快读邮寄)。
专业服务请勿犹豫联系我!本公司是留学创业和海归创业者们的桥梁。一次办理终生受用一步到位高效服务。详情请在线咨询办理,欢迎有诚意办理的客户咨询!洽谈。
招聘代理:本公司诚聘英国加拿大澳洲新西兰美国法国德国新加坡各地代理人员如果你有业余时间有兴趣就请联系我们咨询顾问:+微信:95270640田里逡巡一番抱起一只硕大的西瓜用石刀劈开抑或用拳头砸开每人抱起一大块就啃啃得满嘴满脸猴屁股般的红艳大家一个劲地指着对方吃吃地笑瓜裂得古怪奇形怪状却丝毫不影响瓜味甜丝丝的满嘴生津遍地都是瓜横七竖八的活像掷满了一地的大石块摘走二三只爷爷是断然发现不了的即便发现爷爷也不恼反而教山娃辨认孰熟孰嫩孰甜孰淡名义上是护瓜往往在瓜棚里坐上一刻饱吃一顿后山娃就领着阿黑漫山遍野地跑阿黑是一条黑色的大猎狗挺机灵的是山室
1. Elemental Economics - Introduction to mining.pdf
After this first you should: Understand the nature of mining; have an awareness of the industry’s boundaries, corporate structure and size; appreciation the complex motivations and objectives of the industries’ various participants; know how mineral reserves are defined and estimated, and how they evolve over time.
Solution Manual For Financial Accounting, 8th Canadian Edition 2024, by Libby...
Solution Manual For Financial Accounting, 8th Canadian Edition 2024, by Libby, Hodge, Verified Chapters 1 - 13, Complete Newest Version Solution Manual For Financial Accounting, 8th Canadian Edition by Libby, Hodge, Verified Chapters 1 - 13, Complete Newest Version Solution Manual For Financial Accounting 8th Canadian Edition Pdf Chapters Download Stuvia Solution Manual For Financial Accounting 8th Canadian Edition Ebook Download Stuvia Solution Manual For Financial Accounting 8th Canadian Edition Pdf Solution Manual For Financial Accounting 8th Canadian Edition Pdf Download Stuvia Financial Accounting 8th Canadian Edition Pdf Chapters Download Stuvia Financial Accounting 8th Canadian Edition Ebook Download Stuvia Financial Accounting 8th Canadian Edition Pdf Financial Accounting 8th Canadian Edition Pdf Download Stuvia
How Non-Banking Financial Companies Empower Startups With Venture Debt Financing
How Non-Banking Financial Companies Empower Startups With Venture Debt Financing
STREETONOMICS: Exploring the Uncharted Territories of Informal Markets throug...
Delve into the world of STREETONOMICS, where a team of 7 enthusiasts embarks on a journey to understand unorganized markets. By engaging with a coffee street vendor and crafting questionnaires, this project uncovers valuable insights into consumer behavior and market dynamics in informal settings."
Bridging the gap: Online job postings, survey data and the assessment of job ...
Bridging the gap: Online job postings, survey data and the assessment of job ...Labour Market Information Council | Conseil de l’information sur le marché du travail
OJP data from firms like Vicinity Jobs have emerged as a complement to traditional sources of labour demand data, such as the Job Vacancy and Wages Survey (JVWS). Ibrahim Abuallail, PhD Candidate, University of Ottawa, presented research relating to bias in OJPs and a proposed approach to effectively adjust OJP data to complement existing official data (such as from the JVWS) and improve the measurement of labour demand.Tax System, Behaviour, Justice, and Voluntary Compliance Culture in Nigeria -...
Tax System, Behaviour, Justice, and Voluntary Compliance Culture in Nigeria -...Godwin Emmanuel Oyedokun MBA MSc PhD FCA FCTI FCNA CFE FFAR
Lecture slide titled Tax System, Behaviour, Justice, and Voluntary Compliance Culture in Nigeria - Prof Oyedokun.pptxfalcon-invoice-discounting-a-strategic-approach-to-optimize-investments
Falcon stands out as a top-tier P2P Invoice Discounting platform in India, bridging esteemed blue-chip companies and eager investors. Our goal is to transform the investment landscape in India by establishing a comprehensive destination for borrowers and investors with diverse profiles and needs, all while minimizing risk. What sets Falcon apart is the elimination of intermediaries such as commercial banks and depository institutions, allowing investors to enjoy higher yields.
The Rise of Generative AI in Finance: Reshaping the Industry with Synthetic Data
In this presentation, we will explore the rise of generative AI in finance and its potential to reshape the industry. We will discuss how generative AI can be used to develop new products, combat fraud, and revolutionize risk management. Finally, we will address some of the ethical considerations and challenges associated with this powerful technology.
2. Elemental Economics - Mineral demand.pdf
After this second you should be able to: Explain the main determinants of demand for any mineral product, and their relative importance; recognise and explain how demand for any product is likely to change with economic activity; recognise and explain the roles of technology and relative prices in influencing demand; be able to explain the differences between the rates of growth of demand for different products.
Tdasx: Unveiling the Trillion-Dollar Potential of Bitcoin DeFi
Tdasx: Unveiling the Trillion-Dollar Potential of Bitcoin DeFi
一比一原版(UoB毕业证)伯明翰大学毕业证如何办理
UoB本科学位证成绩单【微信95270640】伯明翰大学没毕业>办理伯明翰大学毕业证成绩单【微信UoB】UoB毕业证成绩单UoB学历证书UoB文凭《UoB毕业套号文凭网认证伯明翰大学毕业证成绩单》《哪里买伯明翰大学毕业证文凭UoB成绩学校快递邮寄信封》《开版伯明翰大学文凭》UoB留信认证本科硕士学历认证
如果您是以下情况,我们都能竭诚为您解决实际问题:【公司采用定金+余款的付款流程,以最大化保障您的利益,让您放心无忧】
1、在校期间,因各种原因未能顺利毕业,拿不到官方毕业证+微信95270640
2、面对父母的压力,希望尽快拿到伯明翰大学伯明翰大学硕士毕业证成绩单;
3、不清楚流程以及材料该如何准备伯明翰大学伯明翰大学硕士毕业证成绩单;
4、回国时间很长,忘记办理;
5、回国马上就要找工作,办给用人单位看;
6、企事业单位必须要求办理的;
面向美国乔治城大学毕业留学生提供以下服务:
【★伯明翰大学伯明翰大学硕士毕业证成绩单毕业证、成绩单等全套材料,从防伪到印刷,从水印到钢印烫金,与学校100%相同】
【★真实使馆认证(留学人员回国证明),使馆存档可通过大使馆查询确认】
【★真实教育部认证,教育部存档,教育部留服网站可查】
【★真实留信认证,留信网入库存档,可查伯明翰大学伯明翰大学硕士毕业证成绩单】
我们从事工作十余年的有着丰富经验的业务顾问,熟悉海外各国大学的学制及教育体系,并且以挂科生解决毕业材料不全问题为基础,为客户量身定制1对1方案,未能毕业的回国留学生成功搭建回国顺利发展所需的桥梁。我们一直努力以高品质的教育为起点,以诚信、专业、高效、创新作为一切的行动宗旨,始终把“诚信为主、质量为本、客户第一”作为我们全部工作的出发点和归宿点。同时为海内外留学生提供大学毕业证购买、补办成绩单及各类分数修改等服务;归国认证方面,提供《留信网入库》申请、《国外学历学位认证》申请以及真实学籍办理等服务,帮助众多莘莘学子实现了一个又一个梦想。
专业服务,请勿犹豫联系我
如果您真实毕业回国,对于学历认证无从下手,请联系我,我们免费帮您递交
诚招代理:本公司诚聘当地代理人员,如果你有业余时间,或者你有同学朋友需要,有兴趣就请联系我
你赢我赢,共创双赢
你做代理,可以帮助伯明翰大学同学朋友
你做代理,可以拯救伯明翰大学失足青年
你做代理,可以挽救伯明翰大学一个个人才
你做代理,你将是别人人生伯明翰大学的转折点
你做代理,可以改变自己,改变他人,给他人和自己一个机会大块就啃啃得满嘴满脸猴屁股般的红艳大家一个劲地指着对方吃吃地笑瓜裂得古怪奇形怪状却丝毫不影响瓜味甜丝丝的满嘴生津遍地都是瓜横七竖八的活像掷满了一地的大石块摘走二三只爷爷是断然发现不了的即便发现爷爷也不恼反而教山娃辨认孰熟孰嫩孰甜孰淡名义上是护瓜往往在瓜棚里坐上一刻饱吃一顿后山娃就领着阿黑漫山遍野地跑阿黑是一条黑色的大猎狗挺机灵的是山娃多年的忠实伙伴平时山娃上学阿黑也摇头晃脑地跟去暑假用不着上学阿钩
Financial Assets: Debit vs Equity Securities.pptx
financial assets represent claim for future benefit or cash. Financial assets are formed by establishing contracts between participants. These financial assets are used for collection of huge amounts of money for business purposes.
Two major Types: Debt Securities and Equity Securities.
Debt Securities are Also known as fixed-income securities or instruments. The type of assets is formed by establishing contracts between investor and issuer of the asset.
• The first type of Debit securities is BONDS. Bonds are issued by corporations and government (both local and national government).
• The second important type of Debit security is NOTES. Apart from similarities associated with notes and bonds, notes have shorter term maturity.
• The 3rd important type of Debit security is TRESURY BILLS. These securities have short-term ranging from three months, six months, and one year. Issuer of such securities are governments.
• Above discussed debit securities are mostly issued by governments and corporations. CERTIFICATE OF DEPOSITS CDs are issued by Banks and Financial Institutions. Risk factor associated with CDs gets reduced when issued by reputable institutions or Banks.
Following are the risk attached with debt securities: Credit risk, interest rate risk and currency risk
There are no fixed maturity dates in such securities, and asset’s value is determined by company’s performance. There are two major types of equity securities: common stock and preferred stock.
Common Stock: These are simple equity securities and bear no complexities which the preferred stock bears. Holders of such securities or instrument have the voting rights when it comes to select the company’s board of director or the business decisions to be made.
Preferred Stock: Preferred stocks are sometime referred to as hybrid securities, because it contains elements of both debit security and equity security. Preferred stock confers ownership rights to security holder that is why it is equity instrument
<a href="https://www.writofinance.com/equity-securities-features-types-risk/" >Equity securities </a> as a whole is used for capital funding for companies. Companies have multiple expenses to cover. Potential growth of company is required in competitive market. So, these securities are used for capital generation, and then uses it for company’s growth.
Concluding remarks
Both are employed in business. Businesses are often established through debit securities, then what is the need for equity securities. Companies have to cover multiple expenses and expansion of business. They can also use equity instruments for repayment of debits. So, there are multiple uses for securities. As an investor, you need tools for analysis. Investment decisions are made by carefully analyzing the market. For better analysis of the stock market, investors often employ financial analysis of companies.
1:1制作加拿大麦吉尔大学毕业证硕士学历证书原版一模一样
原版一模一样【微信:741003700 】【加拿大麦吉尔大学毕业证硕士学历证书】【微信:741003700 】学位证,留信认证(真实可查,永久存档)offer、雅思、外壳等材料/诚信可靠,可直接看成品样本,帮您解决无法毕业带来的各种难题!外壳,原版制作,诚信可靠,可直接看成品样本。行业标杆!精益求精,诚心合作,真诚制作!多年品质 ,按需精细制作,24小时接单,全套进口原装设备。十五年致力于帮助留学生解决难题,包您满意。
本公司拥有海外各大学样板无数,能完美还原海外各大学 Bachelor Diploma degree, Master Degree Diploma
1:1完美还原海外各大学毕业材料上的工艺:水印,阴影底纹,钢印LOGO烫金烫银,LOGO烫金烫银复合重叠。文字图案浮雕、激光镭射、紫外荧光、温感、复印防伪等防伪工艺。材料咨询办理、认证咨询办理请加学历顾问Q/微741003700
留信网认证的作用:
1:该专业认证可证明留学生真实身份
2:同时对留学生所学专业登记给予评定
3:国家专业人才认证中心颁发入库证书
4:这个认证书并且可以归档倒地方
5:凡事获得留信网入网的信息将会逐步更新到个人身份内,将在公安局网内查询个人身份证信息后,同步读取人才网入库信息
6:个人职称评审加20分
7:个人信誉贷款加10分
8:在国家人才网主办的国家网络招聘大会中纳入资料,供国家高端企业选择人才
Who Is Abhay Bhutada, MD of Poonawalla Fincorp
Abhay Bhutada, the Managing Director of Poonawalla Fincorp Limited, is an accomplished leader with over 15 years of experience in commercial and retail lending. A Qualified Chartered Accountant, he has been pivotal in leveraging technology to enhance financial services. Starting his career at Bank of India, he later founded TAB Capital Limited and co-founded Poonawalla Finance Private Limited, emphasizing digital lending. Under his leadership, Poonawalla Fincorp achieved a 'AAA' credit rating, integrating acquisitions and emphasizing corporate governance. Actively involved in industry forums and CSR initiatives, Abhay has been recognized with awards like "Young Entrepreneur of India 2017" and "40 under 40 Most Influential Leader for 2020-21." Personally, he values mindfulness, enjoys gardening, yoga, and sees every day as an opportunity for growth and improvement.
Recently uploaded (20)
What's a worker’s market? Job quality and labour market tightness
What's a worker’s market? Job quality and labour market tightness
Abhay Bhutada Leads Poonawalla Fincorp To Record Low NPA And Unprecedented Gr...
Abhay Bhutada Leads Poonawalla Fincorp To Record Low NPA And Unprecedented Gr...
1. Elemental Economics - Introduction to mining.pdf
1. Elemental Economics - Introduction to mining.pdf
Solution Manual For Financial Accounting, 8th Canadian Edition 2024, by Libby...
Solution Manual For Financial Accounting, 8th Canadian Edition 2024, by Libby...
How Non-Banking Financial Companies Empower Startups With Venture Debt Financing
How Non-Banking Financial Companies Empower Startups With Venture Debt Financing
STREETONOMICS: Exploring the Uncharted Territories of Informal Markets throug...
STREETONOMICS: Exploring the Uncharted Territories of Informal Markets throug...
Bridging the gap: Online job postings, survey data and the assessment of job ...
Bridging the gap: Online job postings, survey data and the assessment of job ...
Tax System, Behaviour, Justice, and Voluntary Compliance Culture in Nigeria -...
Tax System, Behaviour, Justice, and Voluntary Compliance Culture in Nigeria -...
falcon-invoice-discounting-a-strategic-approach-to-optimize-investments
falcon-invoice-discounting-a-strategic-approach-to-optimize-investments
The Rise of Generative AI in Finance: Reshaping the Industry with Synthetic Data
The Rise of Generative AI in Finance: Reshaping the Industry with Synthetic Data
Tdasx: Unveiling the Trillion-Dollar Potential of Bitcoin DeFi
Tdasx: Unveiling the Trillion-Dollar Potential of Bitcoin DeFi
Featured
2024 State of Marketing Report – by Hubspot
https://www.hubspot.com/state-of-marketing
· Scaling relationships and proving ROI
· Social media is the place for search, sales, and service
· Authentic influencer partnerships fuel brand growth
· The strongest connections happen via call, click, chat, and camera.
· Time saved with AI leads to more creative work
· Seeking: A single source of truth
· TLDR; Get on social, try AI, and align your systems.
· More human marketing, powered by robots
Everything You Need To Know About ChatGPT
ChatGPT is a revolutionary addition to the world since its introduction in 2022. A big shift in the sector of information gathering and processing happened because of this chatbot. What is the story of ChatGPT? How is the bot responding to prompts and generating contents? Swipe through these slides prepared by Expeed Software, a web development company regarding the development and technical intricacies of ChatGPT!
Product Design Trends in 2024 | Teenage Engineerings
The realm of product design is a constantly changing environment where technology and style intersect. Every year introduces fresh challenges and exciting trends that mold the future of this captivating art form. In this piece, we delve into the significant trends set to influence the look and functionality of product design in the year 2024.
How Race, Age and Gender Shape Attitudes Towards Mental Health
Mental health has been in the news quite a bit lately. Dozens of U.S. states are currently suing Meta for contributing to the youth mental health crisis by inserting addictive features into their products, while the U.S. Surgeon General is touring the nation to bring awareness to the growing epidemic of loneliness and isolation. The country has endured periods of low national morale, such as in the 1970s when high inflation and the energy crisis worsened public sentiment following the Vietnam War. The current mood, however, feels different. Gallup recently reported that national mental health is at an all-time low, with few bright spots to lift spirits.
To better understand how Americans are feeling and their attitudes towards mental health in general, ThinkNow conducted a nationally representative quantitative survey of 1,500 respondents and found some interesting differences among ethnic, age and gender groups.
Technology
For example, 52% agree that technology and social media have a negative impact on mental health, but when broken out by race, 61% of Whites felt technology had a negative effect, and only 48% of Hispanics thought it did.
While technology has helped us keep in touch with friends and family in faraway places, it appears to have degraded our ability to connect in person. Staying connected online is a double-edged sword since the same news feed that brings us pictures of the grandkids and fluffy kittens also feeds us news about the wars in Israel and Ukraine, the dysfunction in Washington, the latest mass shooting and the climate crisis.
Hispanics may have a built-in defense against the isolation technology breeds, owing to their large, multigenerational households, strong social support systems, and tendency to use social media to stay connected with relatives abroad.
Age and Gender
When asked how individuals rate their mental health, men rate it higher than women by 11 percentage points, and Baby Boomers rank it highest at 83%, saying it’s good or excellent vs. 57% of Gen Z saying the same.
Gen Z spends the most amount of time on social media, so the notion that social media negatively affects mental health appears to be correlated. Unfortunately, Gen Z is also the generation that’s least comfortable discussing mental health concerns with healthcare professionals. Only 40% of them state they’re comfortable discussing their issues with a professional compared to 60% of Millennials and 65% of Boomers.
Race Affects Attitudes
As seen in previous research conducted by ThinkNow, Asian Americans lag other groups when it comes to awareness of mental health issues. Twenty-four percent of Asian Americans believe that having a mental health issue is a sign of weakness compared to the 16% average for all groups. Asians are also considerably less likely to be aware of mental health services in their communities (42% vs. 55%) and most likely to seek out information on social media (51% vs. 35%).
AI Trends in Creative Operations 2024 by Artwork Flow.pdf
Creative operations teams expect increased AI use in 2024. Currently, over half of tasks are not AI-enabled, but this is expected to decrease in the coming year. ChatGPT is the most popular AI tool currently. Business leaders are more actively exploring AI benefits than individual contributors. Most respondents do not believe AI will impact workforce size in 2024. However, some inhibitions still exist around AI accuracy and lack of understanding. Creatives primarily want to use AI to save time on mundane tasks and boost productivity.
Skeleton Culture Code
Organizational culture includes values, norms, systems, symbols, language, assumptions, beliefs, and habits that influence employee behaviors and how people interpret those behaviors. It is important because culture can help or hinder a company's success. Some key aspects of Netflix's culture that help it achieve results include hiring smartly so every position has stars, focusing on attitude over just aptitude, and having a strict policy against peacocks, whiners, and jerks.
PEPSICO Presentation to CAGNY Conference Feb 2024
PepsiCo provided a safe harbor statement noting that any forward-looking statements are based on currently available information and are subject to risks and uncertainties. It also provided information on non-GAAP measures and directing readers to its website for disclosure and reconciliation. The document then discussed PepsiCo's business overview, including that it is a global beverage and convenient food company with iconic brands, $91 billion in net revenue in 2023, and nearly $14 billion in core operating profit. It operates through a divisional structure with a focus on local consumers.
Content Methodology: A Best Practices Report (Webinar)
This document provides an overview of content methodology best practices. It defines content methodology as establishing objectives, KPIs, and a culture of continuous learning and iteration. An effective methodology focuses on connecting with audiences, creating optimal content, and optimizing processes. It also discusses why a methodology is needed due to the competitive landscape, proliferation of channels, and opportunities for improvement. Components of an effective methodology include defining objectives and KPIs, audience analysis, identifying opportunities, and evaluating resources. The document concludes with recommendations around creating a content plan, testing and optimizing content over 90 days.
How to Prepare For a Successful Job Search for 2024
The document provides guidance on preparing a job search for 2024. It discusses the state of the job market, focusing on growth in AI and healthcare but also continued layoffs. It recommends figuring out what you want to do by researching interests and skills, then conducting informational interviews. The job search should involve building a personal brand on LinkedIn, actively applying to jobs, tailoring resumes and interviews, maintaining job hunting as a habit, and continuing self-improvement. Once hired, the document advises setting new goals and keeping skills and networking active in case of future opportunities.
Social Media Marketing Trends 2024 // The Global Indie Insights
A report by thenetworkone and Kurio.
The contributing experts and agencies are (in an alphabetical order): Sylwia Rytel, Social Media Supervisor, 180heartbeats + JUNG v MATT (PL), Sharlene Jenner, Vice President - Director of Engagement Strategy, Abelson Taylor (USA), Alex Casanovas, Digital Director, Atrevia (ES), Dora Beilin, Senior Social Strategist, Barrett Hoffher (USA), Min Seo, Campaign Director, Brand New Agency (KR), Deshé M. Gully, Associate Strategist, Day One Agency (USA), Francesca Trevisan, Strategist, Different (IT), Trevor Crossman, CX and Digital Transformation Director; Olivia Hussey, Strategic Planner; Simi Srinarula, Social Media Manager, The Hallway (AUS), James Hebbert, Managing Director, Hylink (CN / UK), Mundy Álvarez, Planning Director; Pedro Rojas, Social Media Manager; Pancho González, CCO, Inbrax (CH), Oana Oprea, Head of Digital Planning, Jam Session Agency (RO), Amy Bottrill, Social Account Director, Launch (UK), Gaby Arriaga, Founder, Leonardo1452 (MX), Shantesh S Row, Creative Director, Liwa (UAE), Rajesh Mehta, Chief Strategy Officer; Dhruv Gaur, Digital Planning Lead; Leonie Mergulhao, Account Supervisor - Social Media & PR, Medulla (IN), Aurelija Plioplytė, Head of Digital & Social, Not Perfect (LI), Daiana Khaidargaliyeva, Account Manager, Osaka Labs (UK / USA), Stefanie Söhnchen, Vice President Digital, PIABO Communications (DE), Elisabeth Winiartati, Managing Consultant, Head of Global Integrated Communications; Lydia Aprina, Account Manager, Integrated Marketing and Communications; Nita Prabowo, Account Manager, Integrated Marketing and Communications; Okhi, Web Developer, PNTR Group (ID), Kei Obusan, Insights Director; Daffi Ranandi, Insights Manager, Radarr (SG), Gautam Reghunath, Co-founder & CEO, Talented (IN), Donagh Humphreys, Head of Social and Digital Innovation, THINKHOUSE (IRE), Sarah Yim, Strategy Director, Zulu Alpha Kilo (CA).
Trends In Paid Search: Navigating The Digital Landscape In 2024
The search marketing landscape is evolving rapidly with new technologies, and professionals, like you, rely on innovative paid search strategies to meet changing demands.
It’s important that you’re ready to implement new strategies in 2024.
Check this out and learn the top trends in paid search advertising that are expected to gain traction, so you can drive higher ROI more efficiently in 2024.
You’ll learn:
- The latest trends in AI and automation, and what this means for an evolving paid search ecosystem.
- New developments in privacy and data regulation.
- Emerging ad formats that are expected to make an impact next year.
Watch Sreekant Lanka from iQuanti and Irina Klein from OneMain Financial as they dive into the future of paid search and explore the trends, strategies, and technologies that will shape the search marketing landscape.
If you’re looking to assess your paid search strategy and design an industry-aligned plan for 2024, then this webinar is for you.
5 Public speaking tips from TED - Visualized summary
From their humble beginnings in 1984, TED has grown into the world’s most powerful amplifier for speakers and thought-leaders to share their ideas. They have over 2,400 filmed talks (not including the 30,000+ TEDx videos) freely available online, and have hosted over 17,500 events around the world.
With over one billion views in a year, it’s no wonder that so many speakers are looking to TED for ideas on how to share their message more effectively.
The article “5 Public-Speaking Tips TED Gives Its Speakers”, by Carmine Gallo for Forbes, gives speakers five practical ways to connect with their audience, and effectively share their ideas on stage.
Whether you are gearing up to get on a TED stage yourself, or just want to master the skills that so many of their speakers possess, these tips and quotes from Chris Anderson, the TED Talks Curator, will encourage you to make the most impactful impression on your audience.
See the full article and more summaries like this on SpeakerHub here: https://speakerhub.com/blog/5-presentation-tips-ted-gives-its-speakers
See the original article on Forbes here:
http://www.forbes.com/forbes/welcome/?toURL=http://www.forbes.com/sites/carminegallo/2016/05/06/5-public-speaking-tips-ted-gives-its-speakers/&refURL=&referrer=#5c07a8221d9b
ChatGPT and the Future of Work - Clark Boyd
Everyone is in agreement that ChatGPT (and other generative AI tools) will shape the future of work. Yet there is little consensus on exactly how, when, and to what extent this technology will change our world.
Businesses that extract maximum value from ChatGPT will use it as a collaborative tool for everything from brainstorming to technical maintenance.
For individuals, now is the time to pinpoint the skills the future professional will need to thrive in the AI age.
Check out this presentation to understand what ChatGPT is, how it will shape the future of work, and how you can prepare to take advantage.
Getting into the tech field. what next
The document provides career advice for getting into the tech field, including:
- Doing projects and internships in college to build a portfolio.
- Learning about different roles and technologies through industry research.
- Contributing to open source projects to build experience and network.
- Developing a personal brand through a website and social media presence.
- Networking through events, communities, and finding a mentor.
- Practicing interviews through mock interviews and whiteboarding coding questions.
Google's Just Not That Into You: Understanding Core Updates & Search Intent
1. Core updates from Google periodically change how its algorithms assess and rank websites and pages. This can impact rankings through shifts in user intent, site quality issues being caught up to, world events influencing queries, and overhauls to search like the E-A-T framework.
2. There are many possible user intents beyond just transactional, navigational and informational. Identifying intent shifts is important during core updates. Sites may need to optimize for new intents through different content types and sections.
3. Responding effectively to core updates requires analyzing "before and after" data to understand changes, identifying new intents or page types, and ensuring content matches appropriate intents across video, images, knowledge graphs and more.
How to have difficult conversations
Stop putting off having difficult conversations. Seven practical tips to ensure your next difficult conversation go smoothly.
Introduction to Data Science
A brief introduction to DataScience with explaining of the concepts, algorithms, machine learning, supervised and unsupervised learning, clustering, statistics, data preprocessing, real-world applications etc.
It's part of a Data Science Corner Campaign where I will be discussing the fundamentals of DataScience, AIML, Statistics etc.
Time Management & Productivity - Best Practices
Here's my presentation on by proven best practices how to manage your work time effectively and how to improve your productivity. It includes practical tips and how to use tools such as Slack, Google Apps, Hubspot, Google Calendar, Gmail and others.
The six step guide to practical project management
The six step guide to practical project management
If you think managing projects is too difficult, think again.
We’ve stripped back project management processes to the
basics – to make it quicker and easier, without sacrificing
the vital ingredients for success.
“If you’re looking for some real-world guidance, then The Six Step Guide to Practical Project Management will help.”
Dr Andrew Makar, Tactical Project Management
Beginners Guide to TikTok for Search - Rachel Pearson - We are Tilt __ Bright...
A presentation for absolute beginners who have never touched TikTok and may be a bit scared of it!
Featured (20)
Product Design Trends in 2024 | Teenage Engineerings
Product Design Trends in 2024 | Teenage Engineerings
How Race, Age and Gender Shape Attitudes Towards Mental Health
How Race, Age and Gender Shape Attitudes Towards Mental Health
AI Trends in Creative Operations 2024 by Artwork Flow.pdf
AI Trends in Creative Operations 2024 by Artwork Flow.pdf
Content Methodology: A Best Practices Report (Webinar)
Content Methodology: A Best Practices Report (Webinar)
How to Prepare For a Successful Job Search for 2024
How to Prepare For a Successful Job Search for 2024
Social Media Marketing Trends 2024 // The Global Indie Insights
Social Media Marketing Trends 2024 // The Global Indie Insights
Trends In Paid Search: Navigating The Digital Landscape In 2024
Trends In Paid Search: Navigating The Digital Landscape In 2024
5 Public speaking tips from TED - Visualized summary
5 Public speaking tips from TED - Visualized summary
Google's Just Not That Into You: Understanding Core Updates & Search Intent
Google's Just Not That Into You: Understanding Core Updates & Search Intent
The six step guide to practical project management
The six step guide to practical project management
Beginners Guide to TikTok for Search - Rachel Pearson - We are Tilt __ Bright...
Beginners Guide to TikTok for Search - Rachel Pearson - We are Tilt __ Bright...
Van
- 1. 0 20000 40000 60000 80000 100000 120000 140000 160000 180000 -20% -10% fc 10% 20% INGRESOS EGRESOS VAN -20% -10% fc 10% 20% INGRESOS 43608.212 41736.817 105747.9 136803.67 167868.83 EGRESOS 123266.1 114502.31 105747.9 96974.723 88210.926