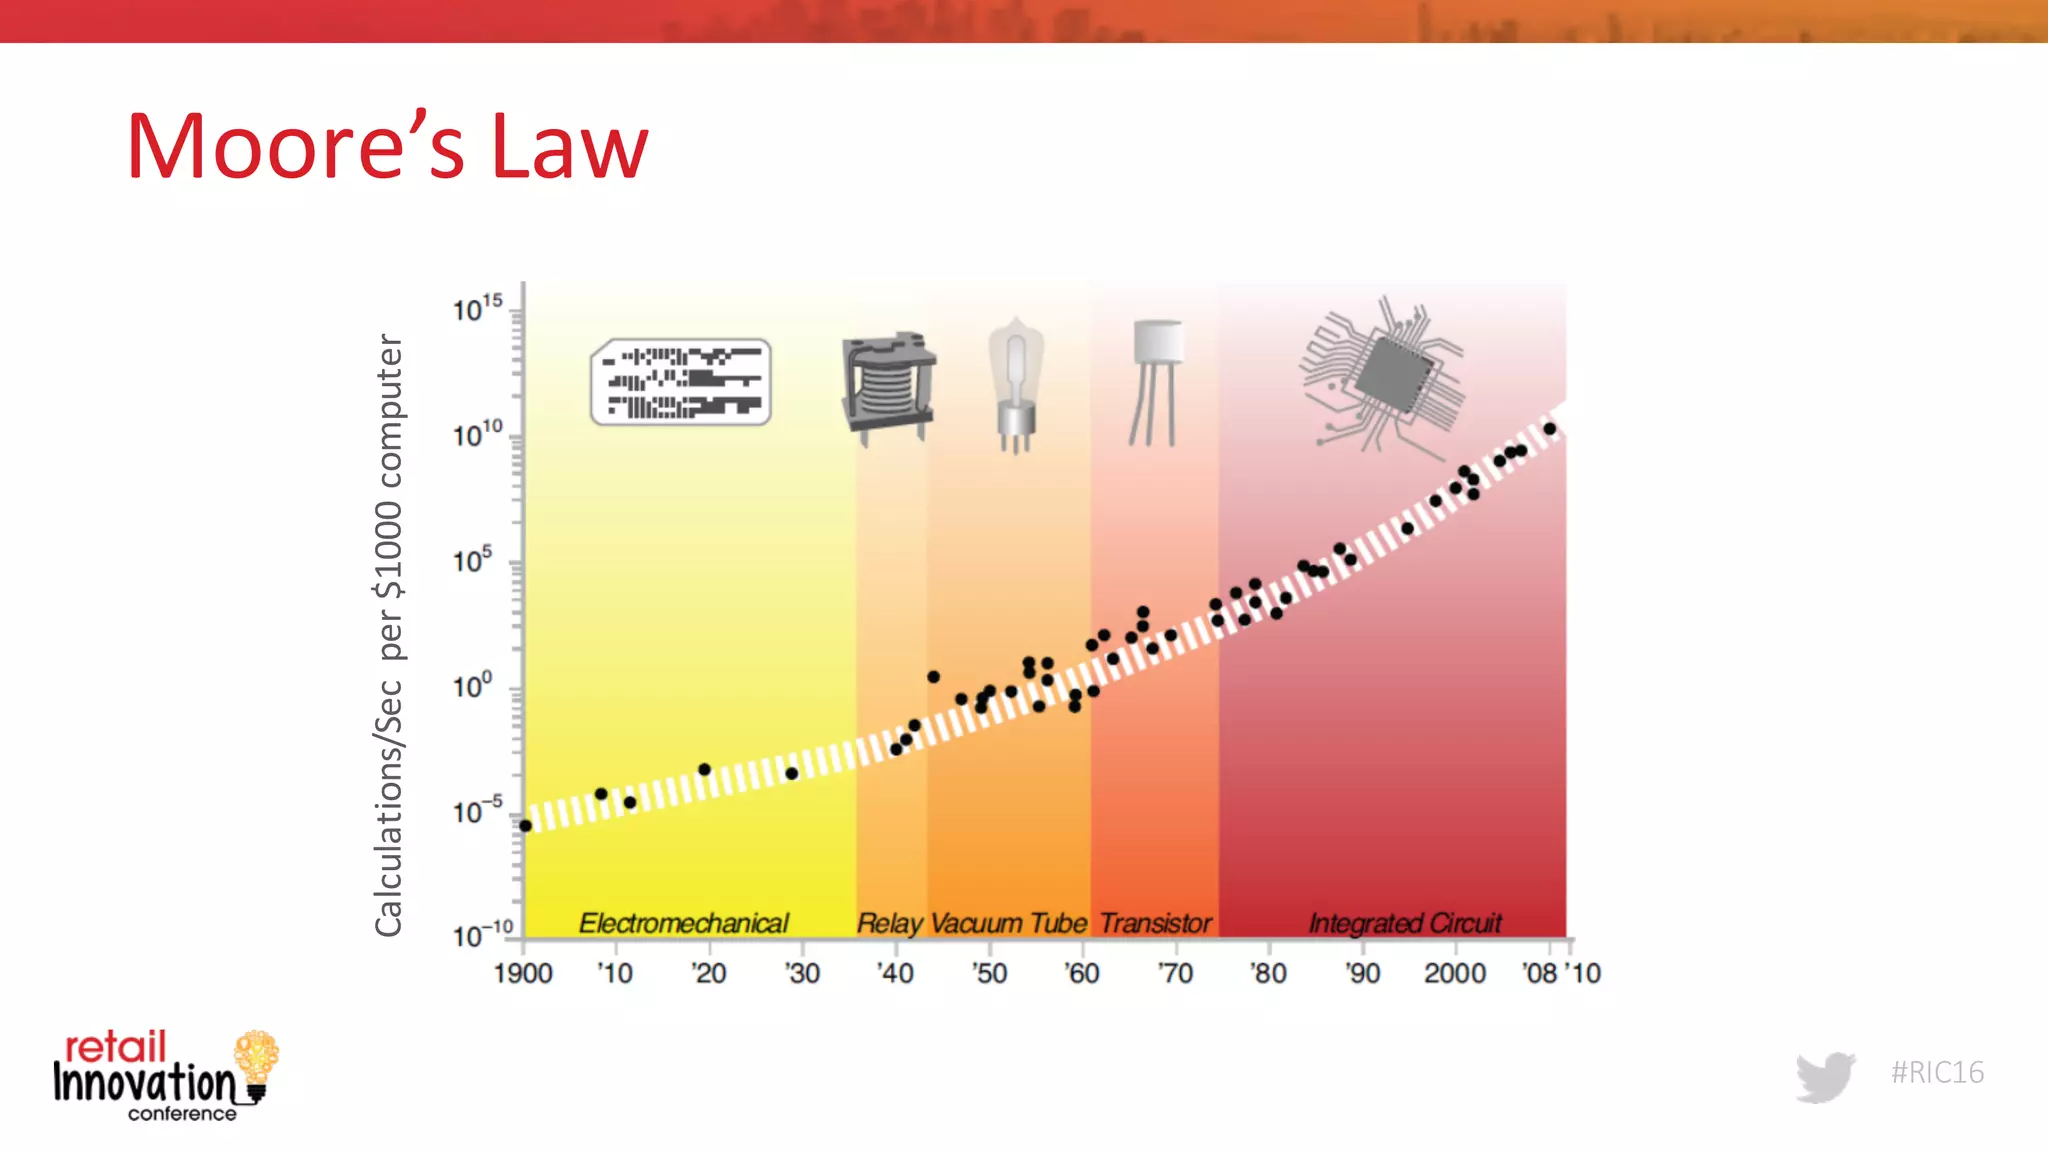
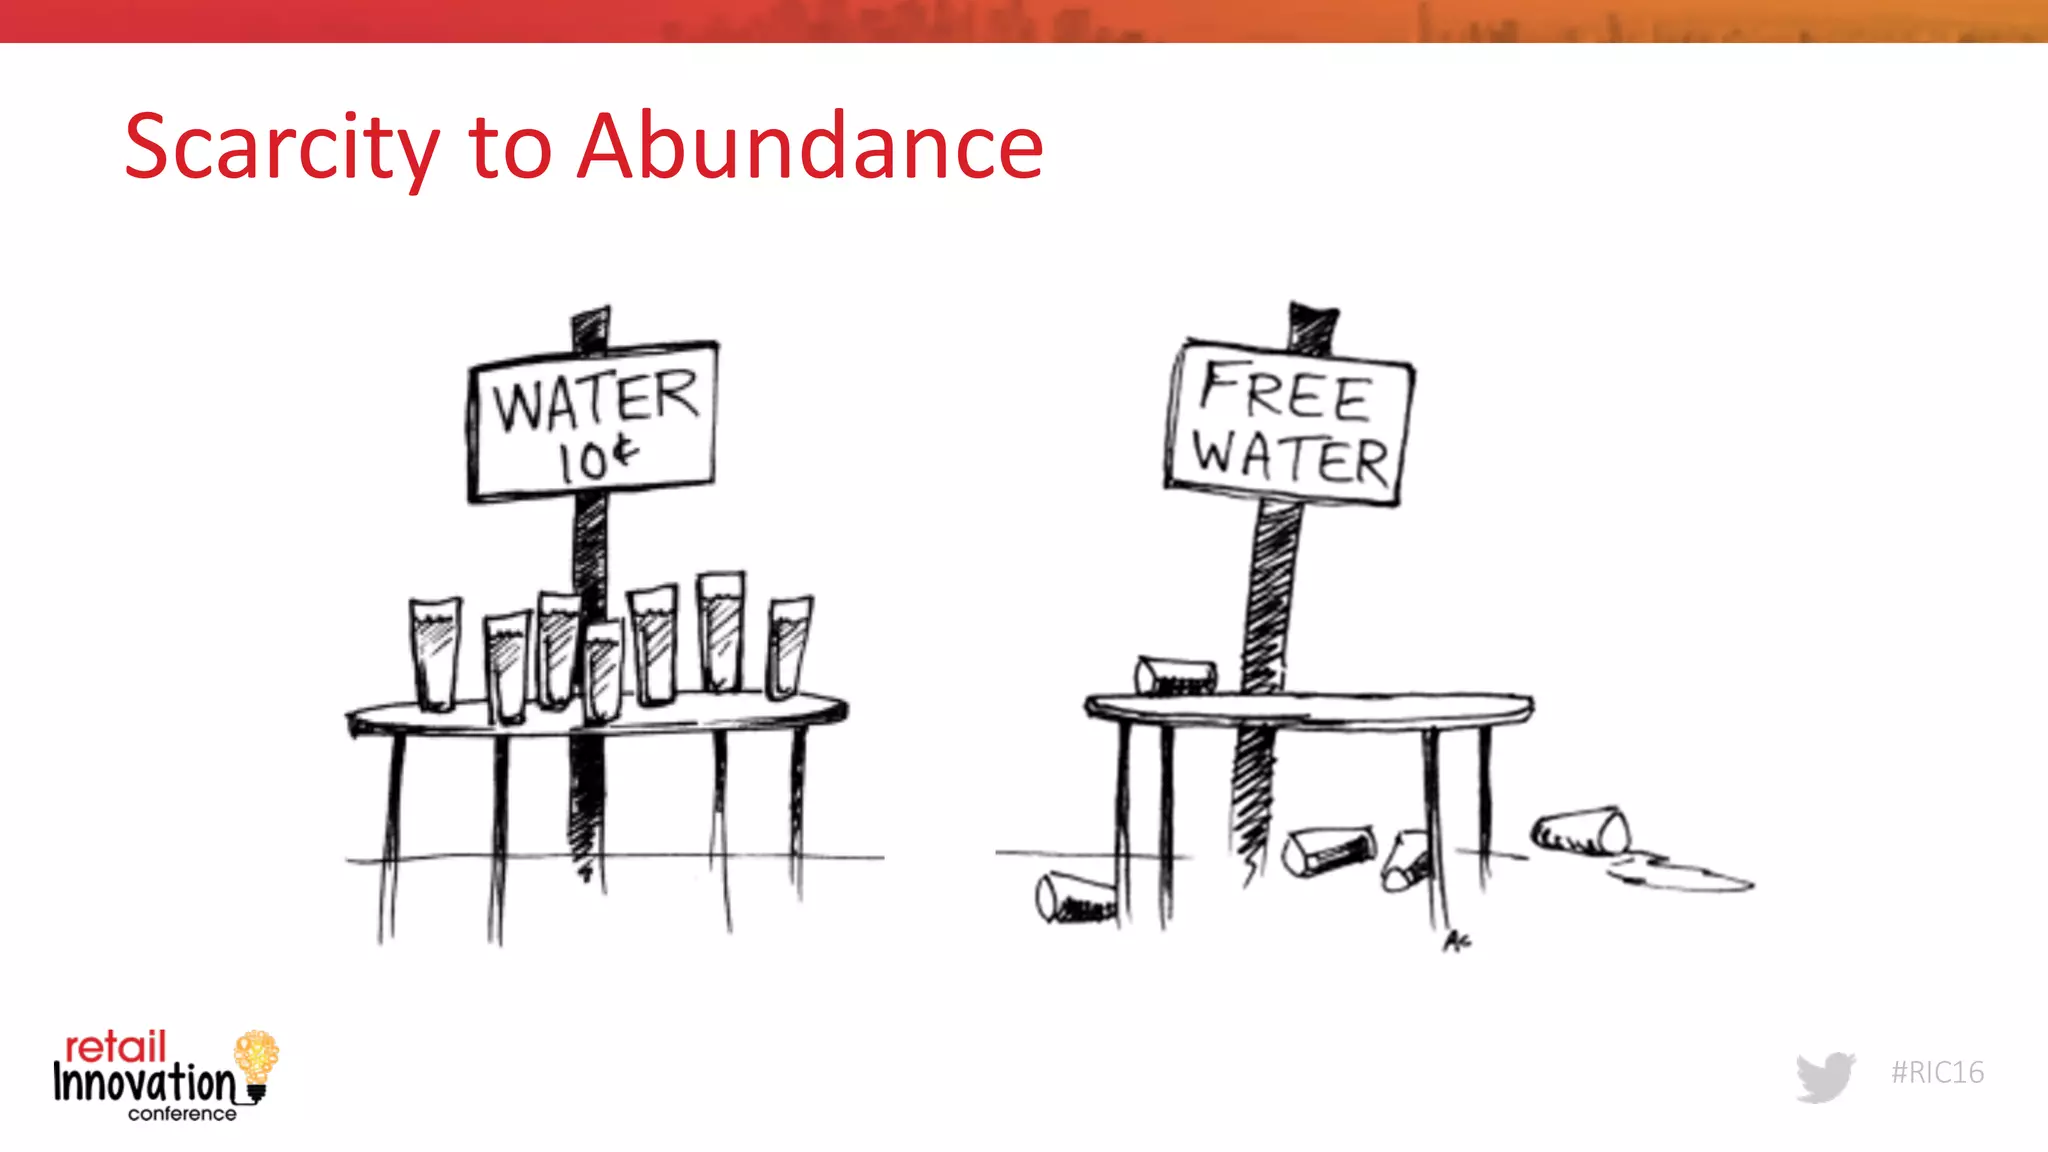
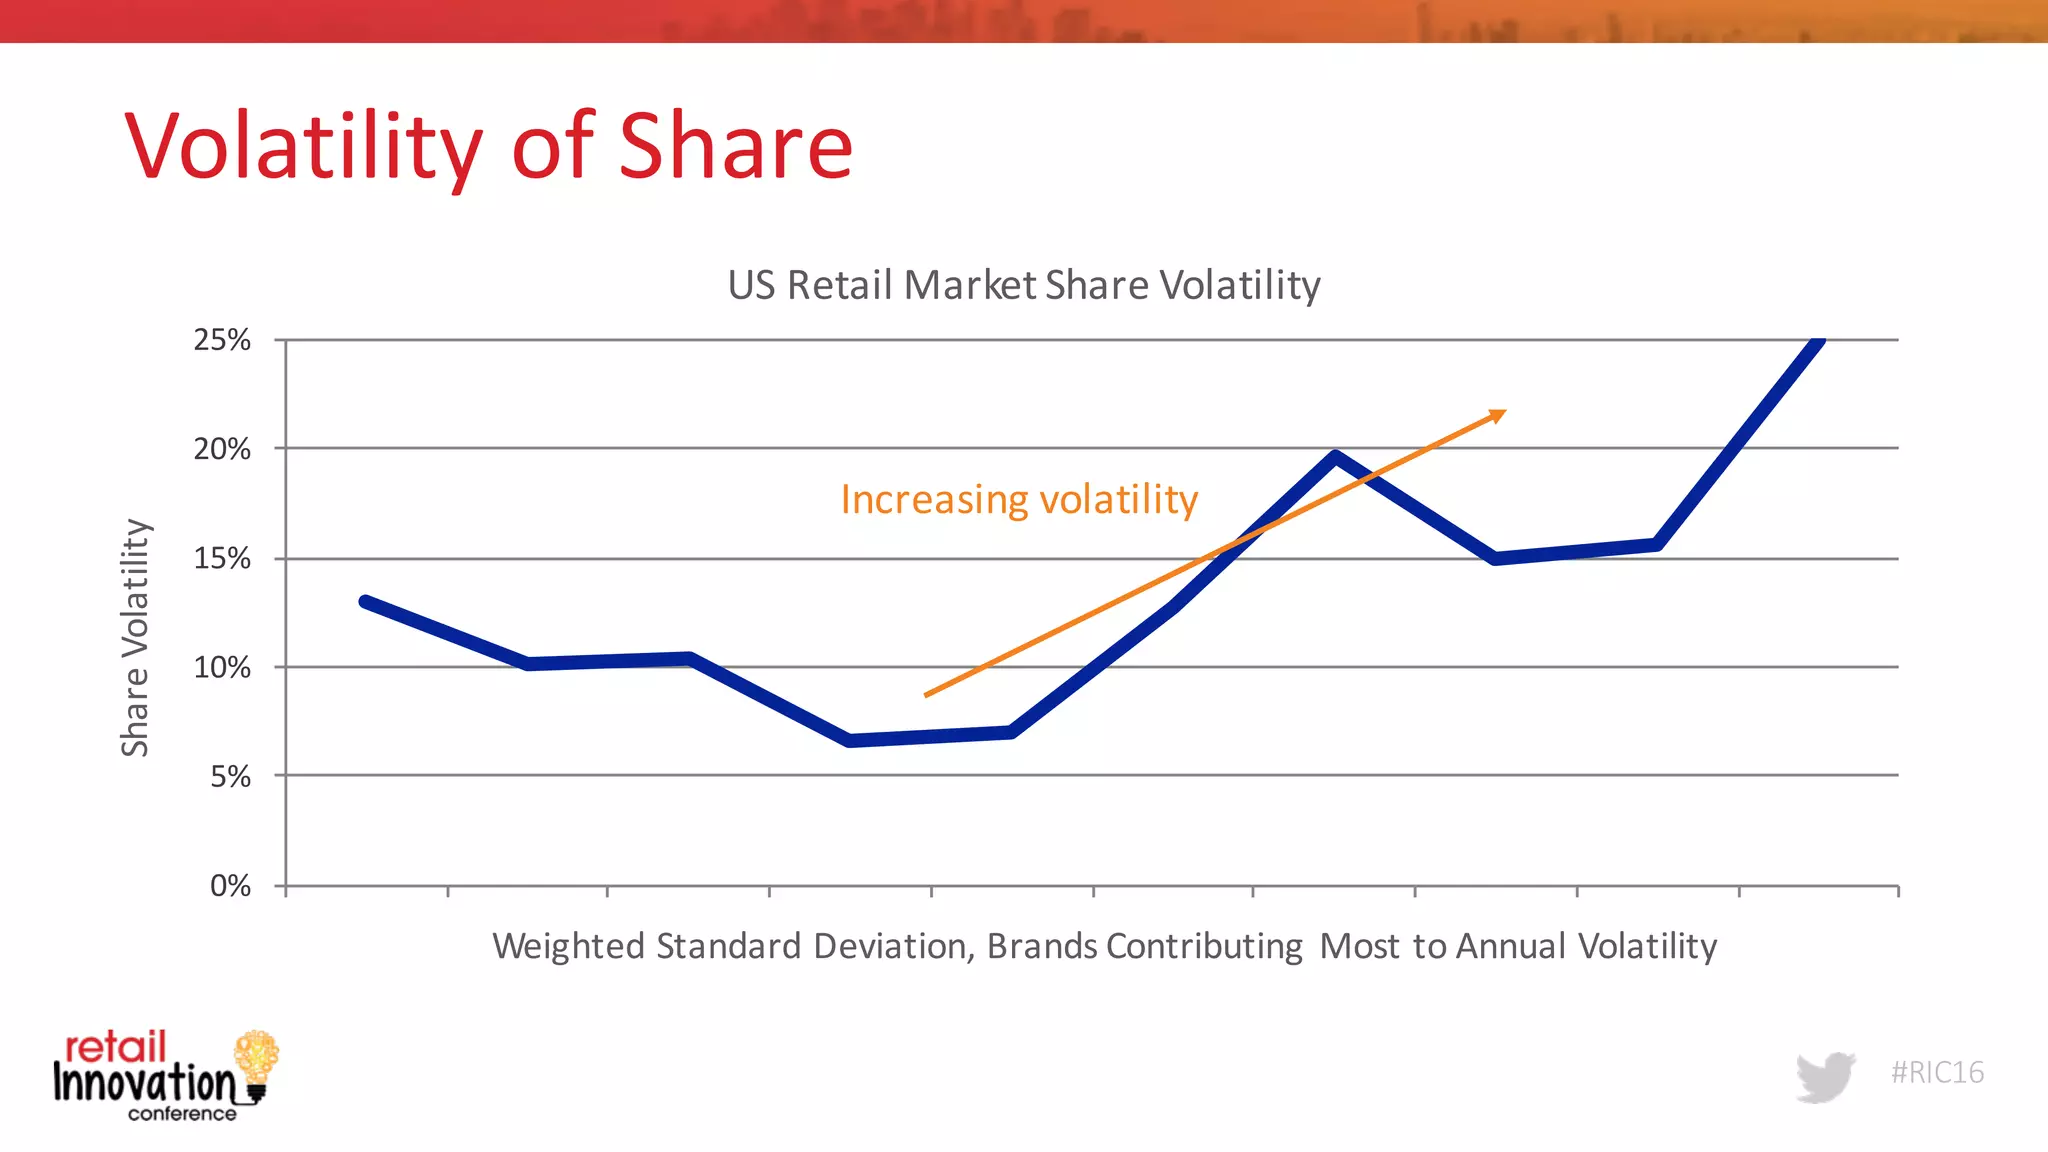
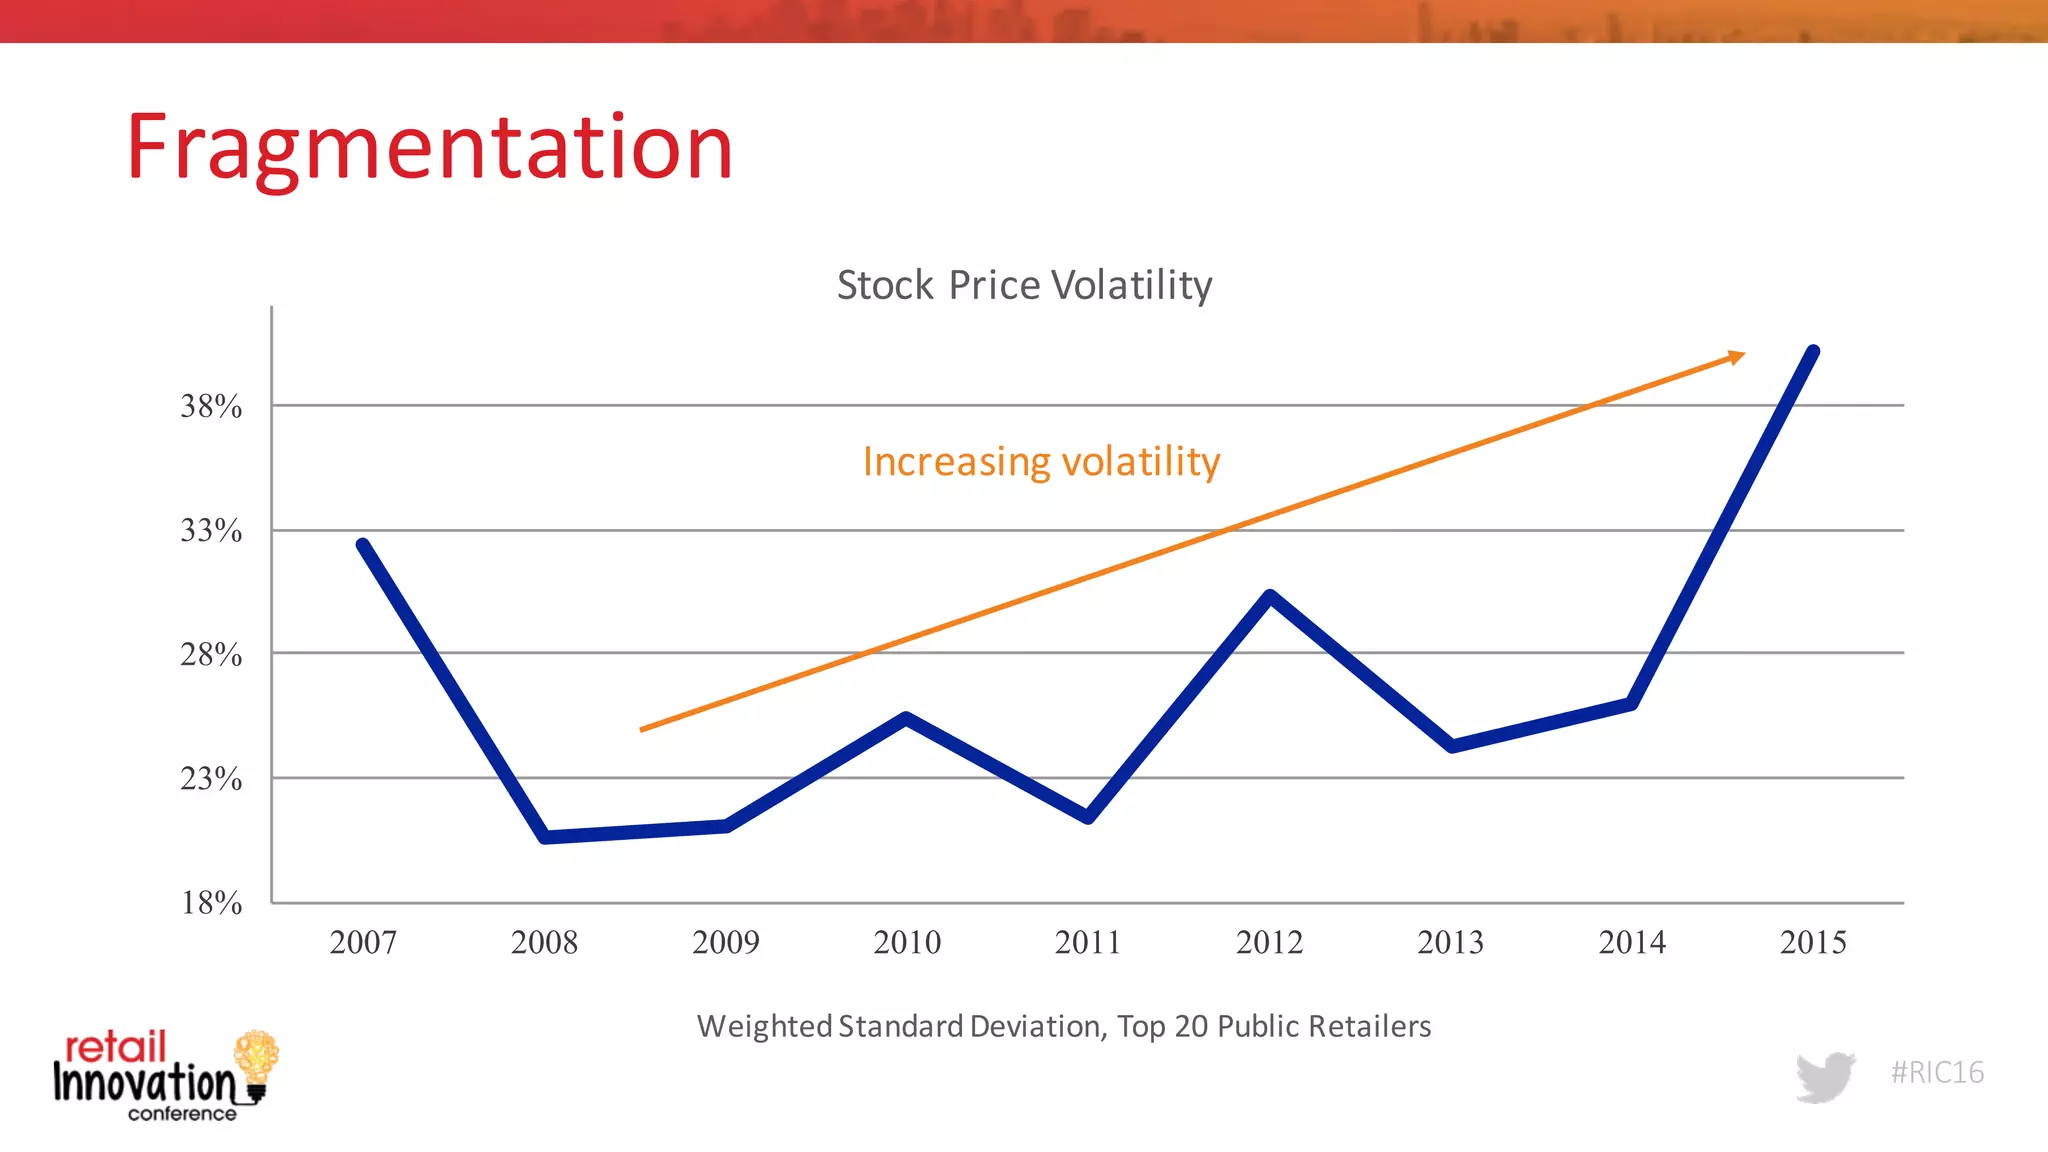
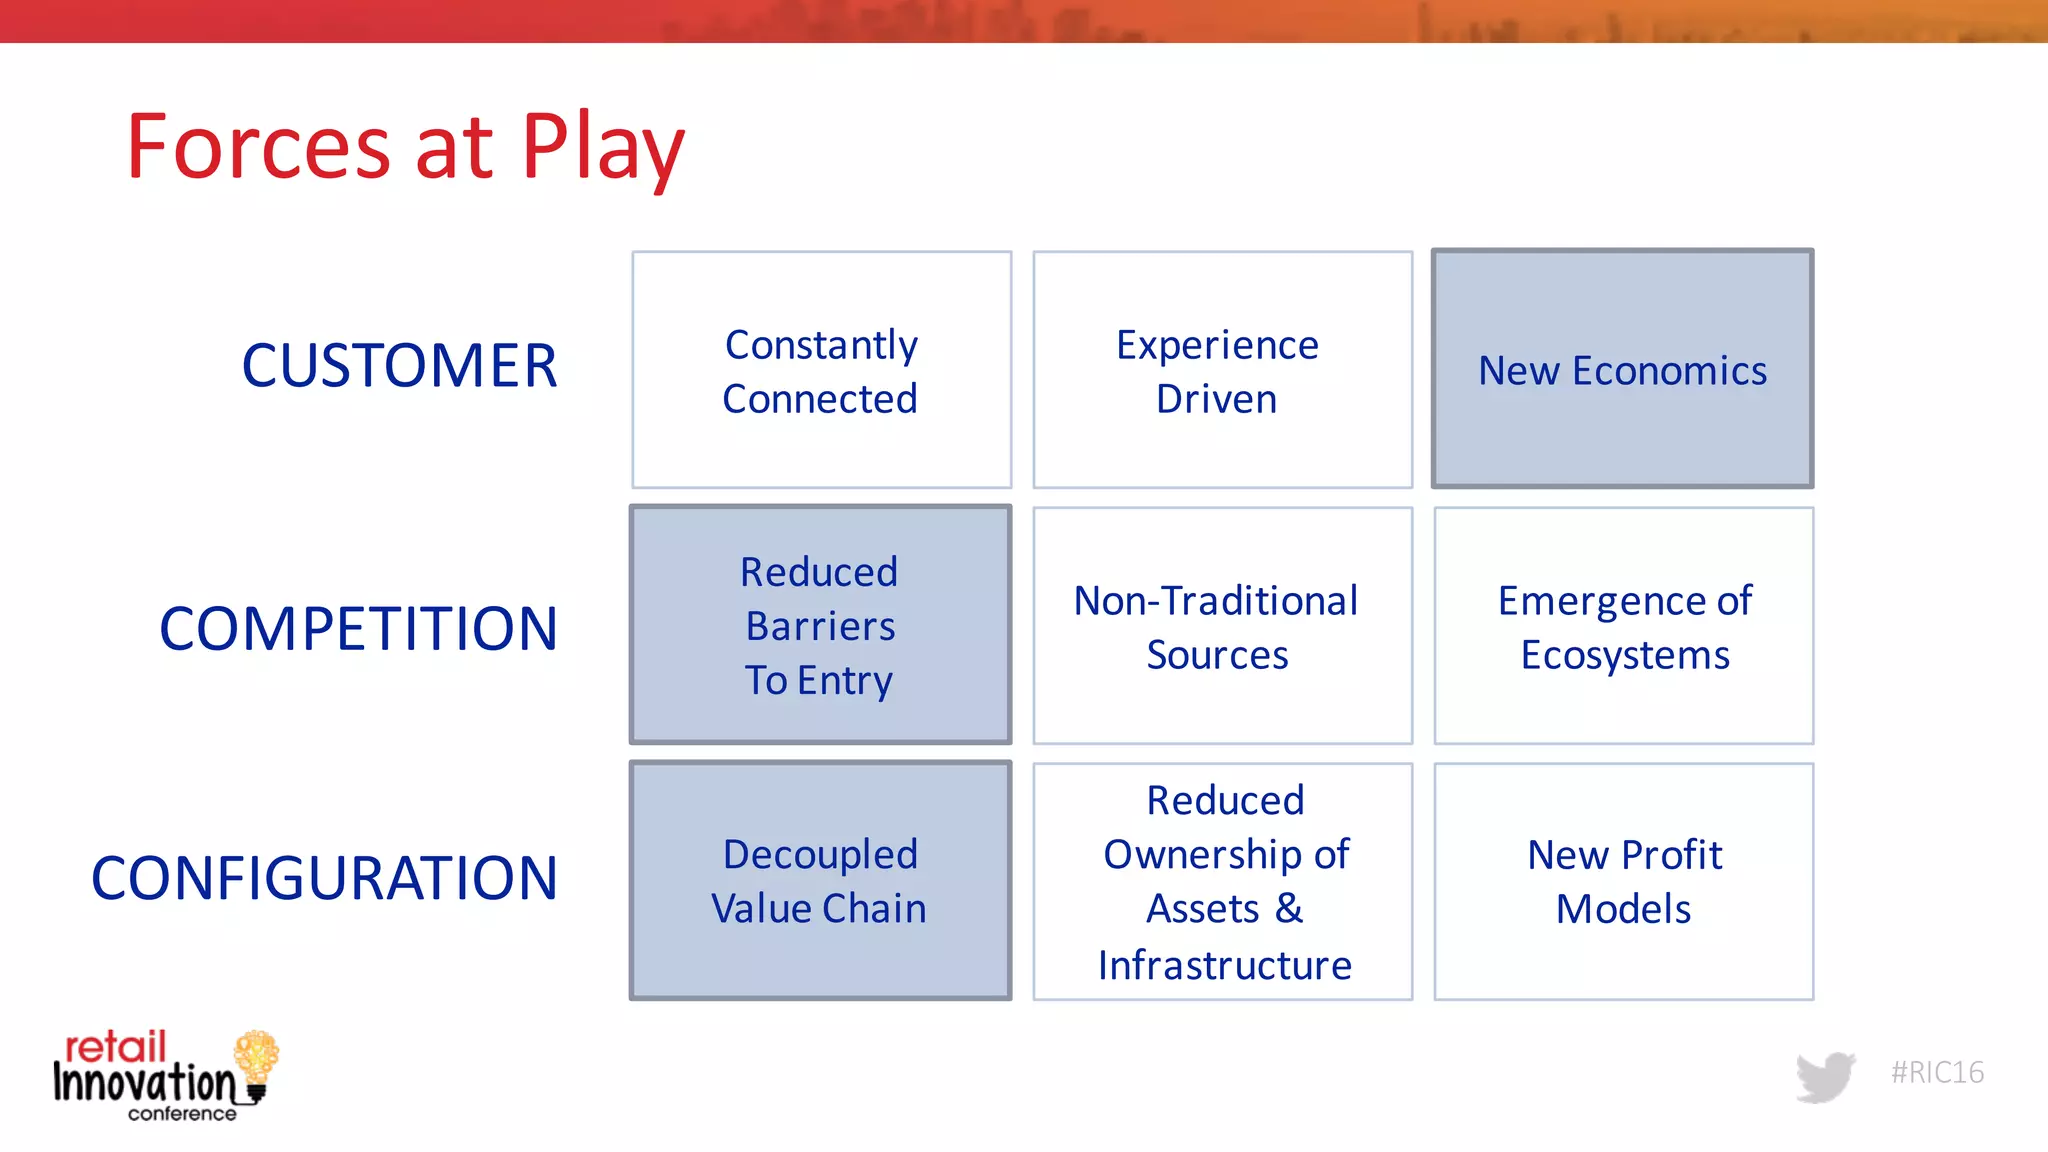
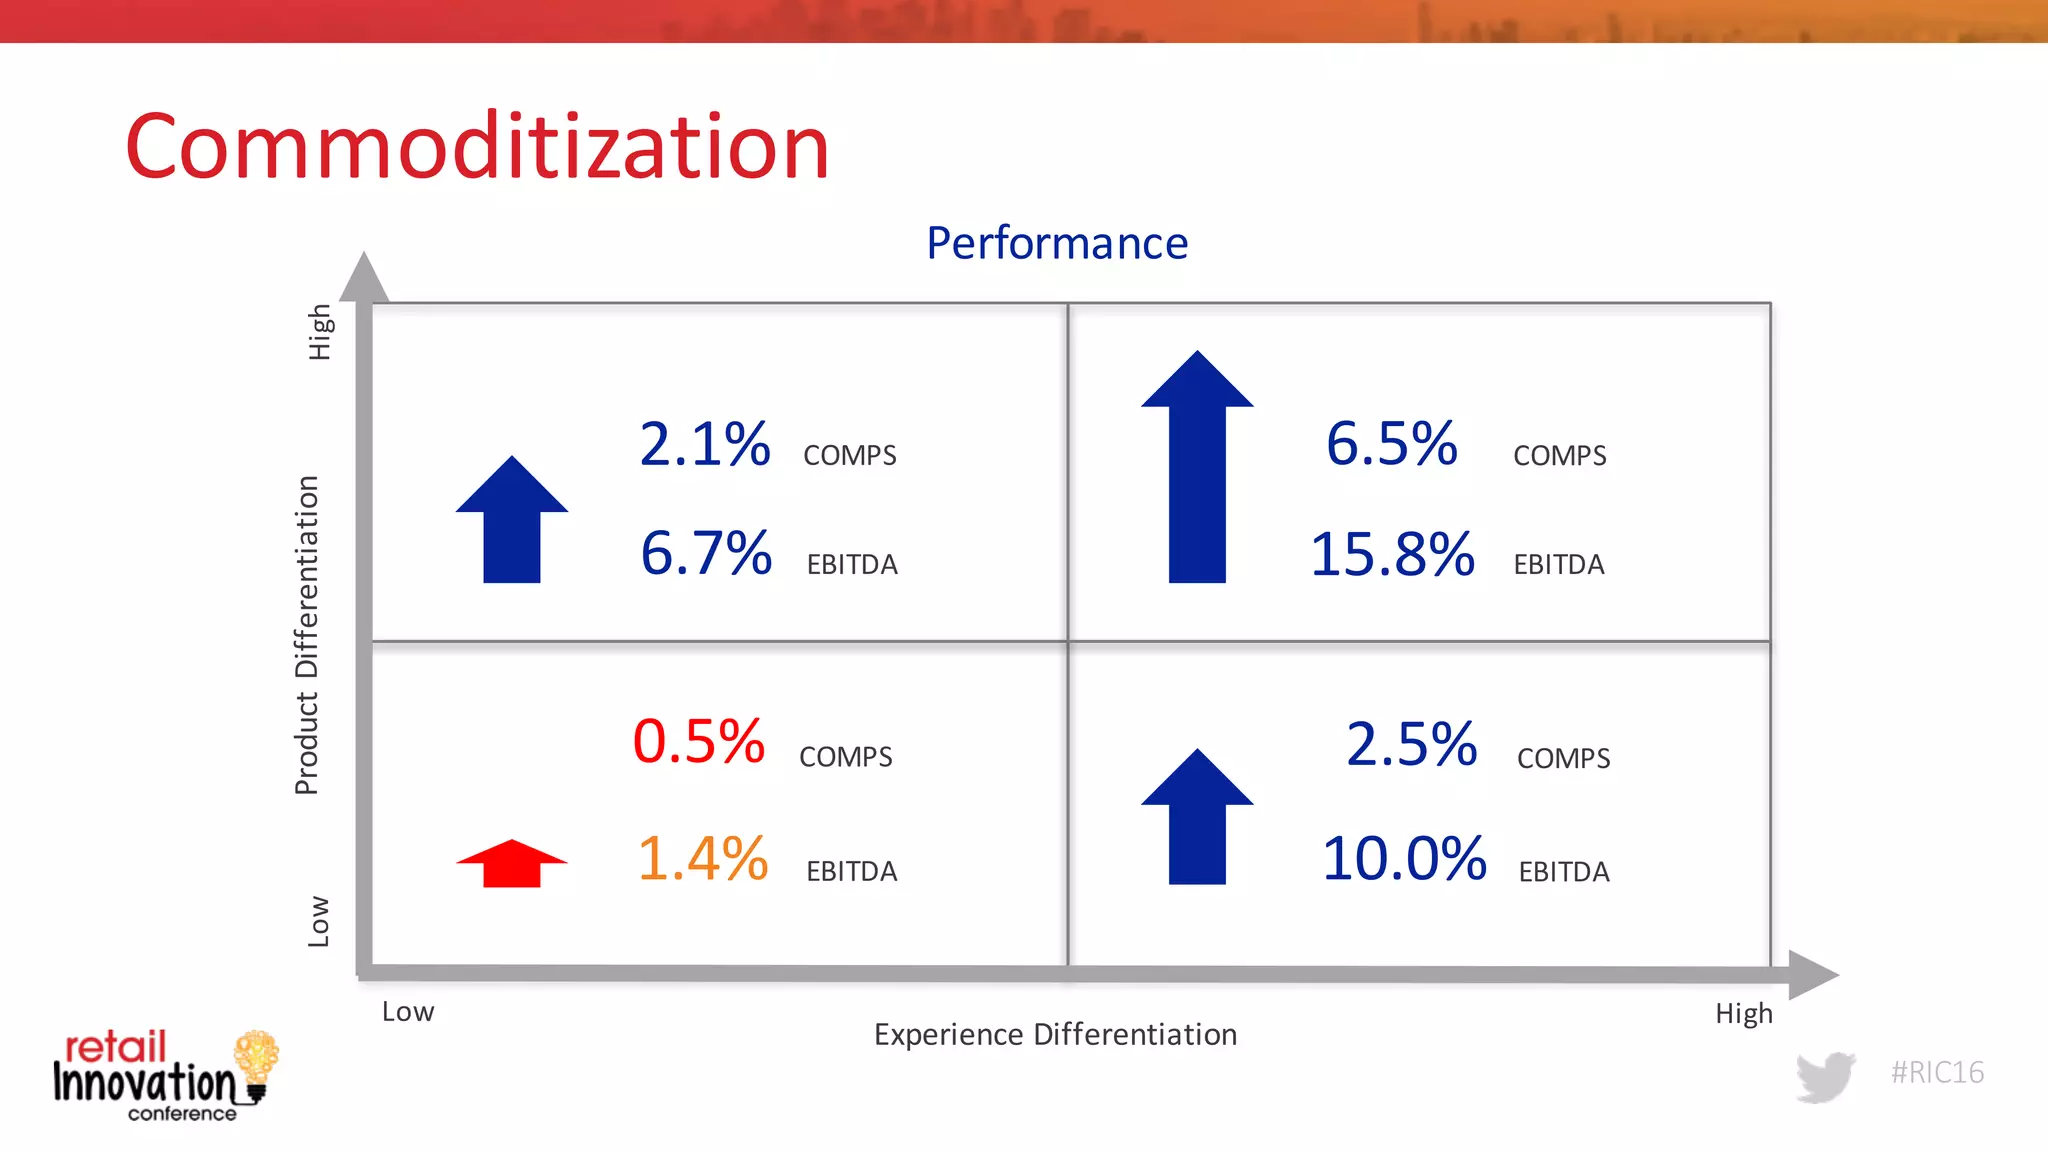
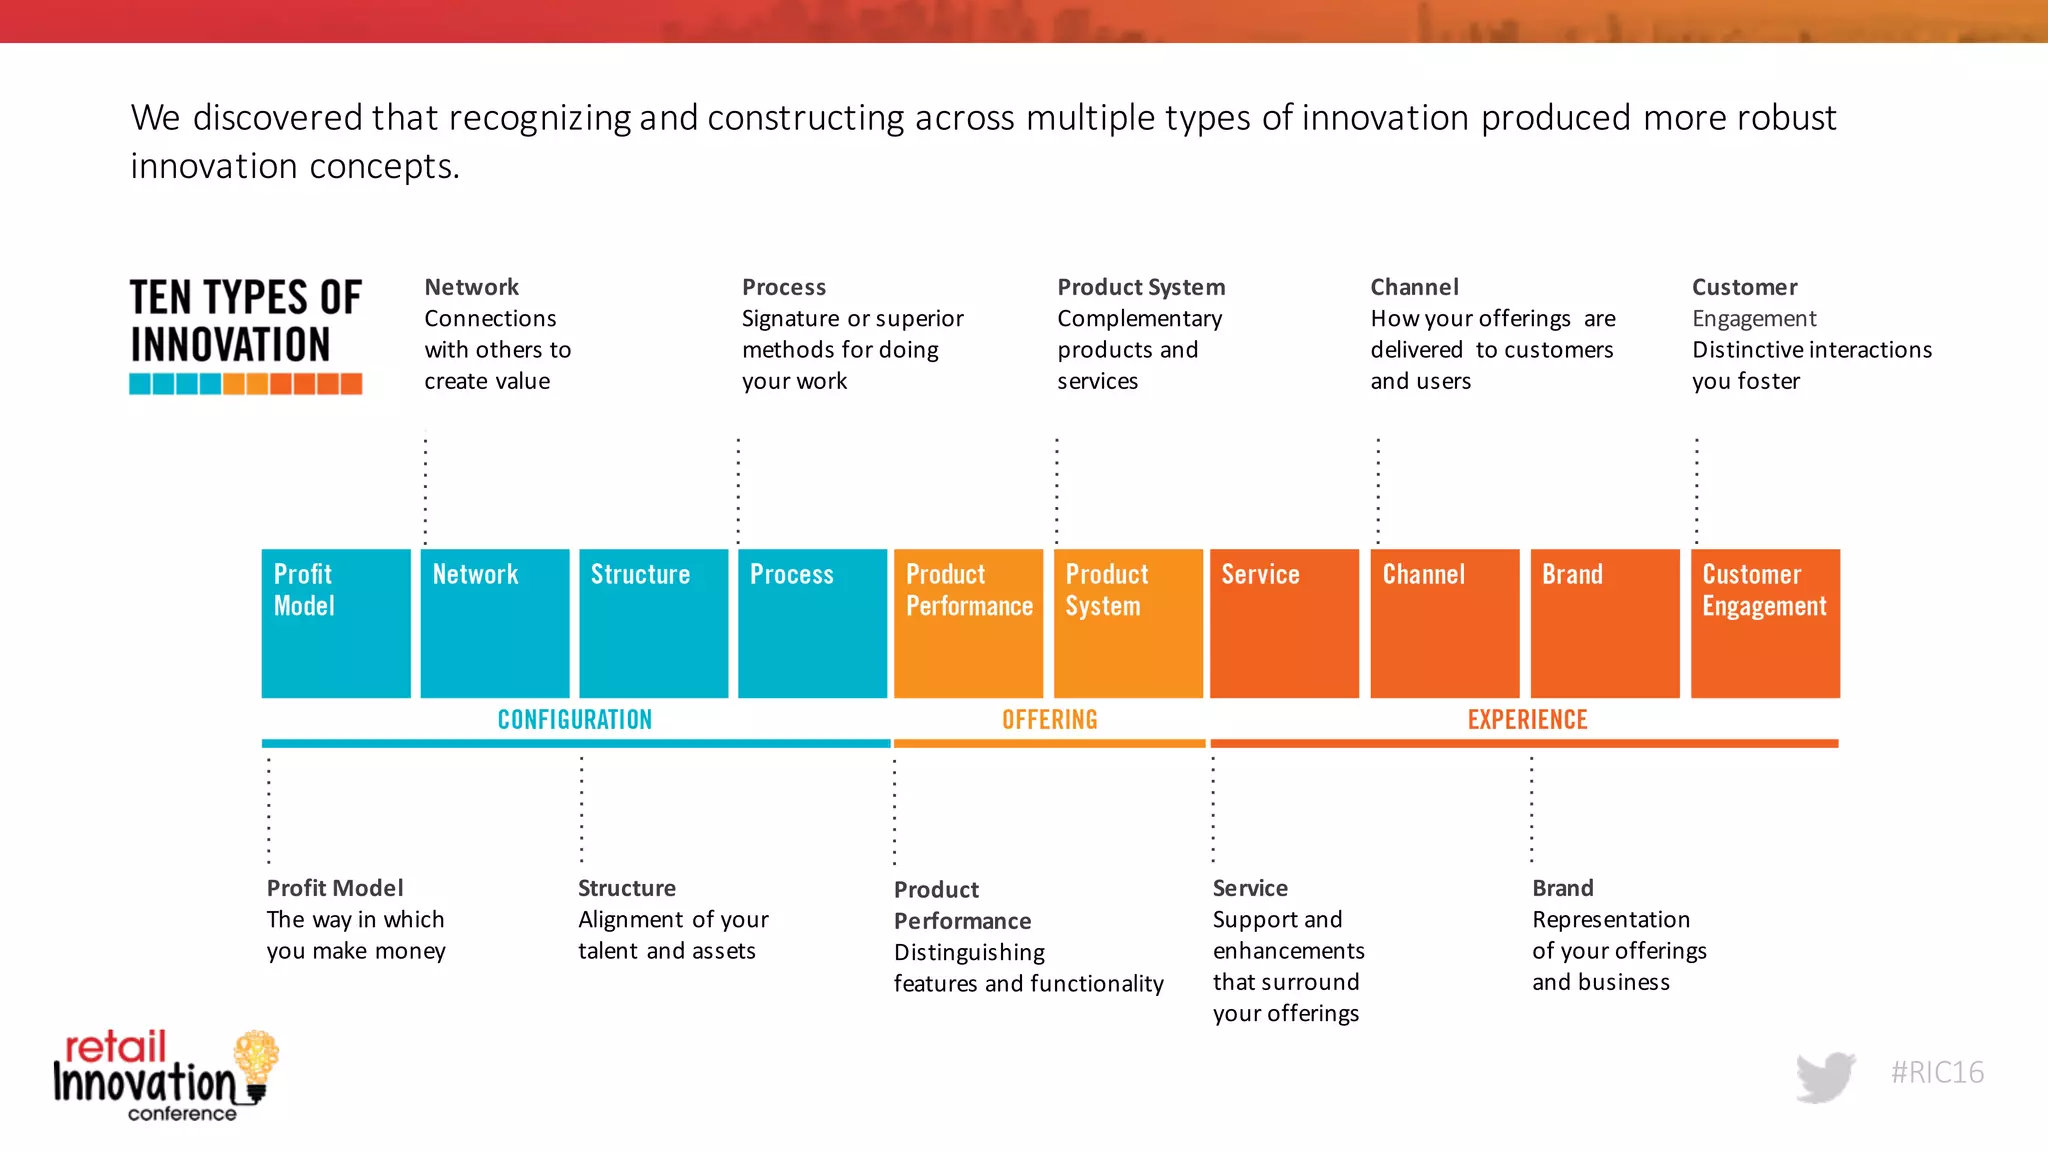
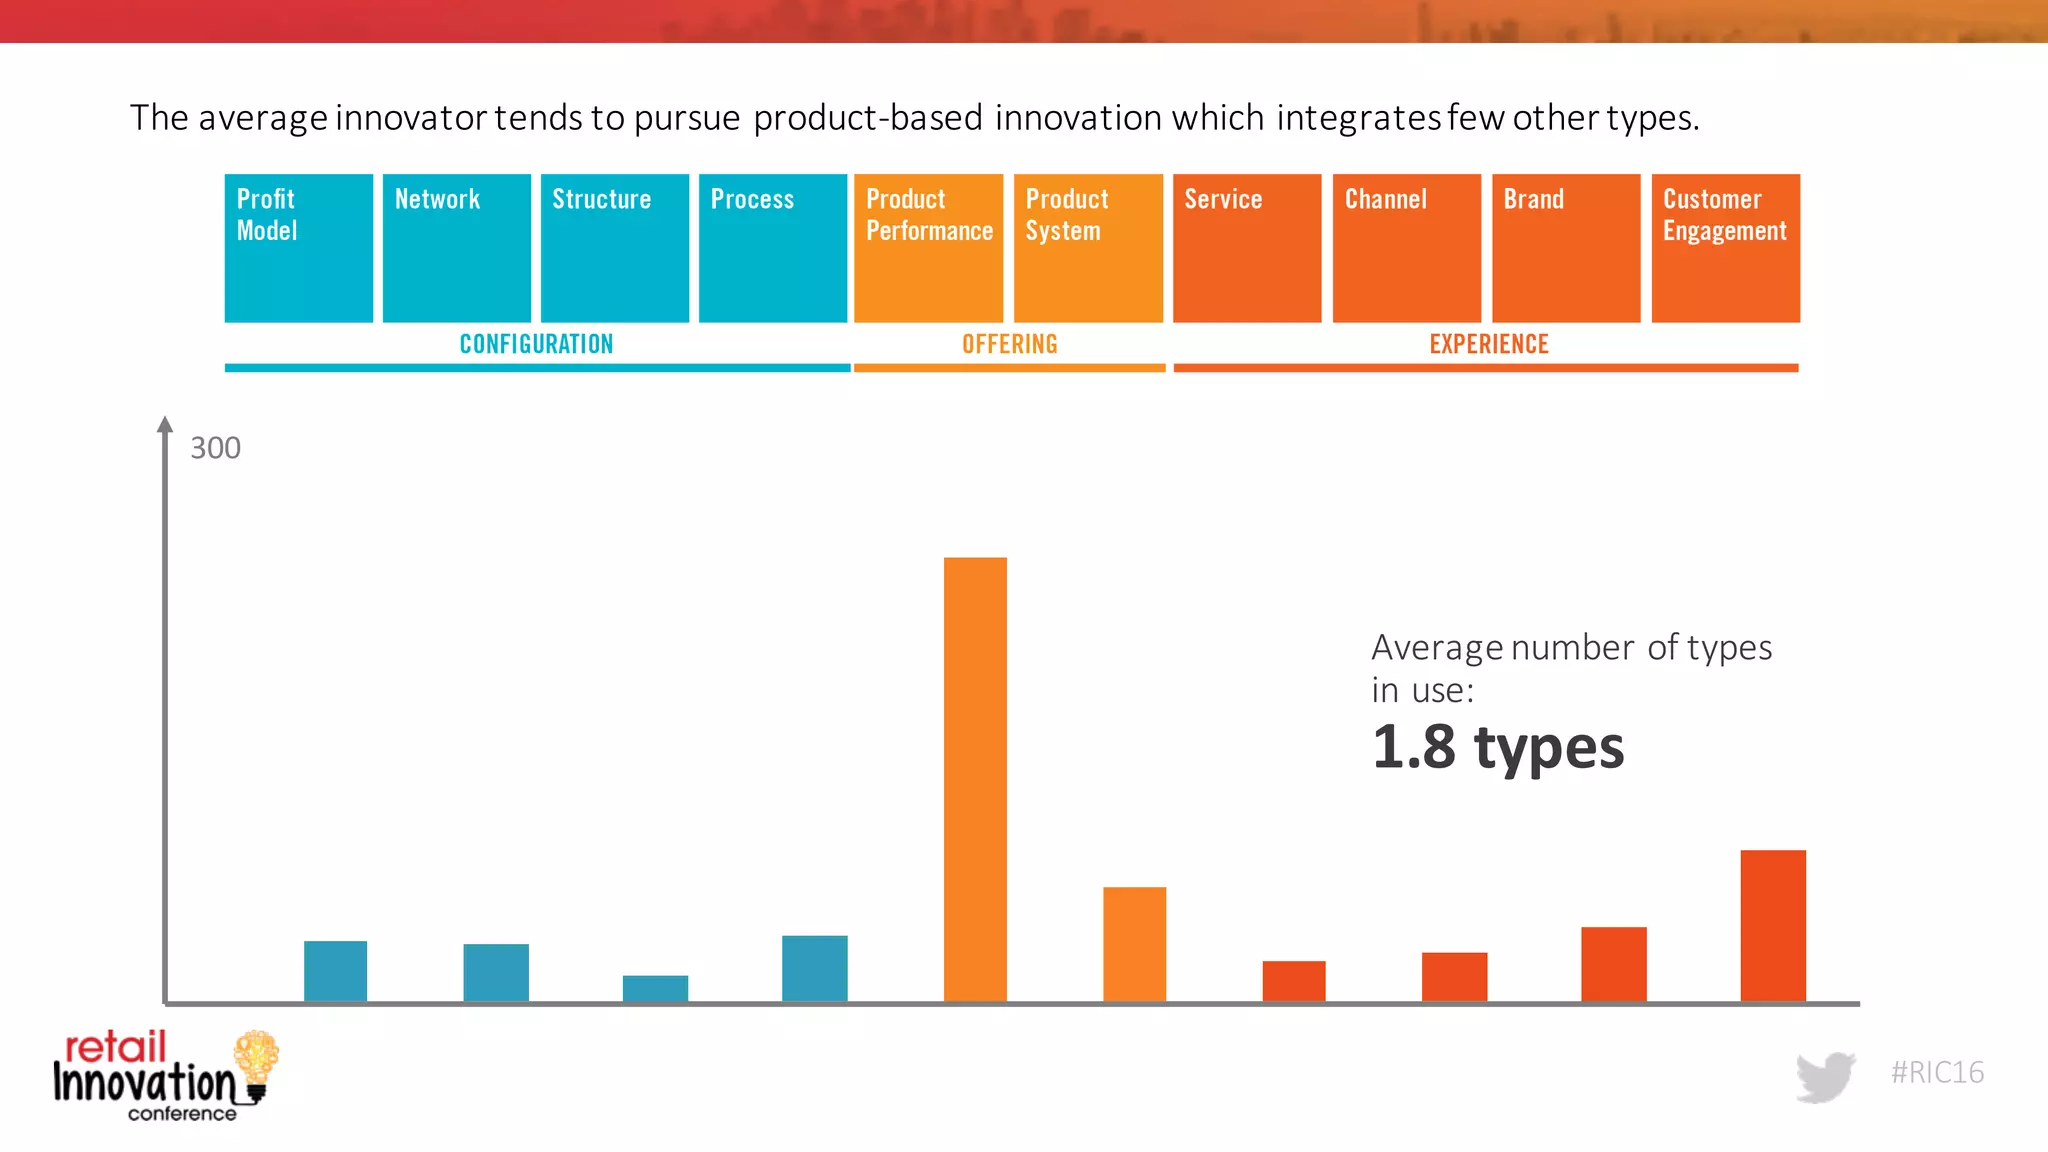
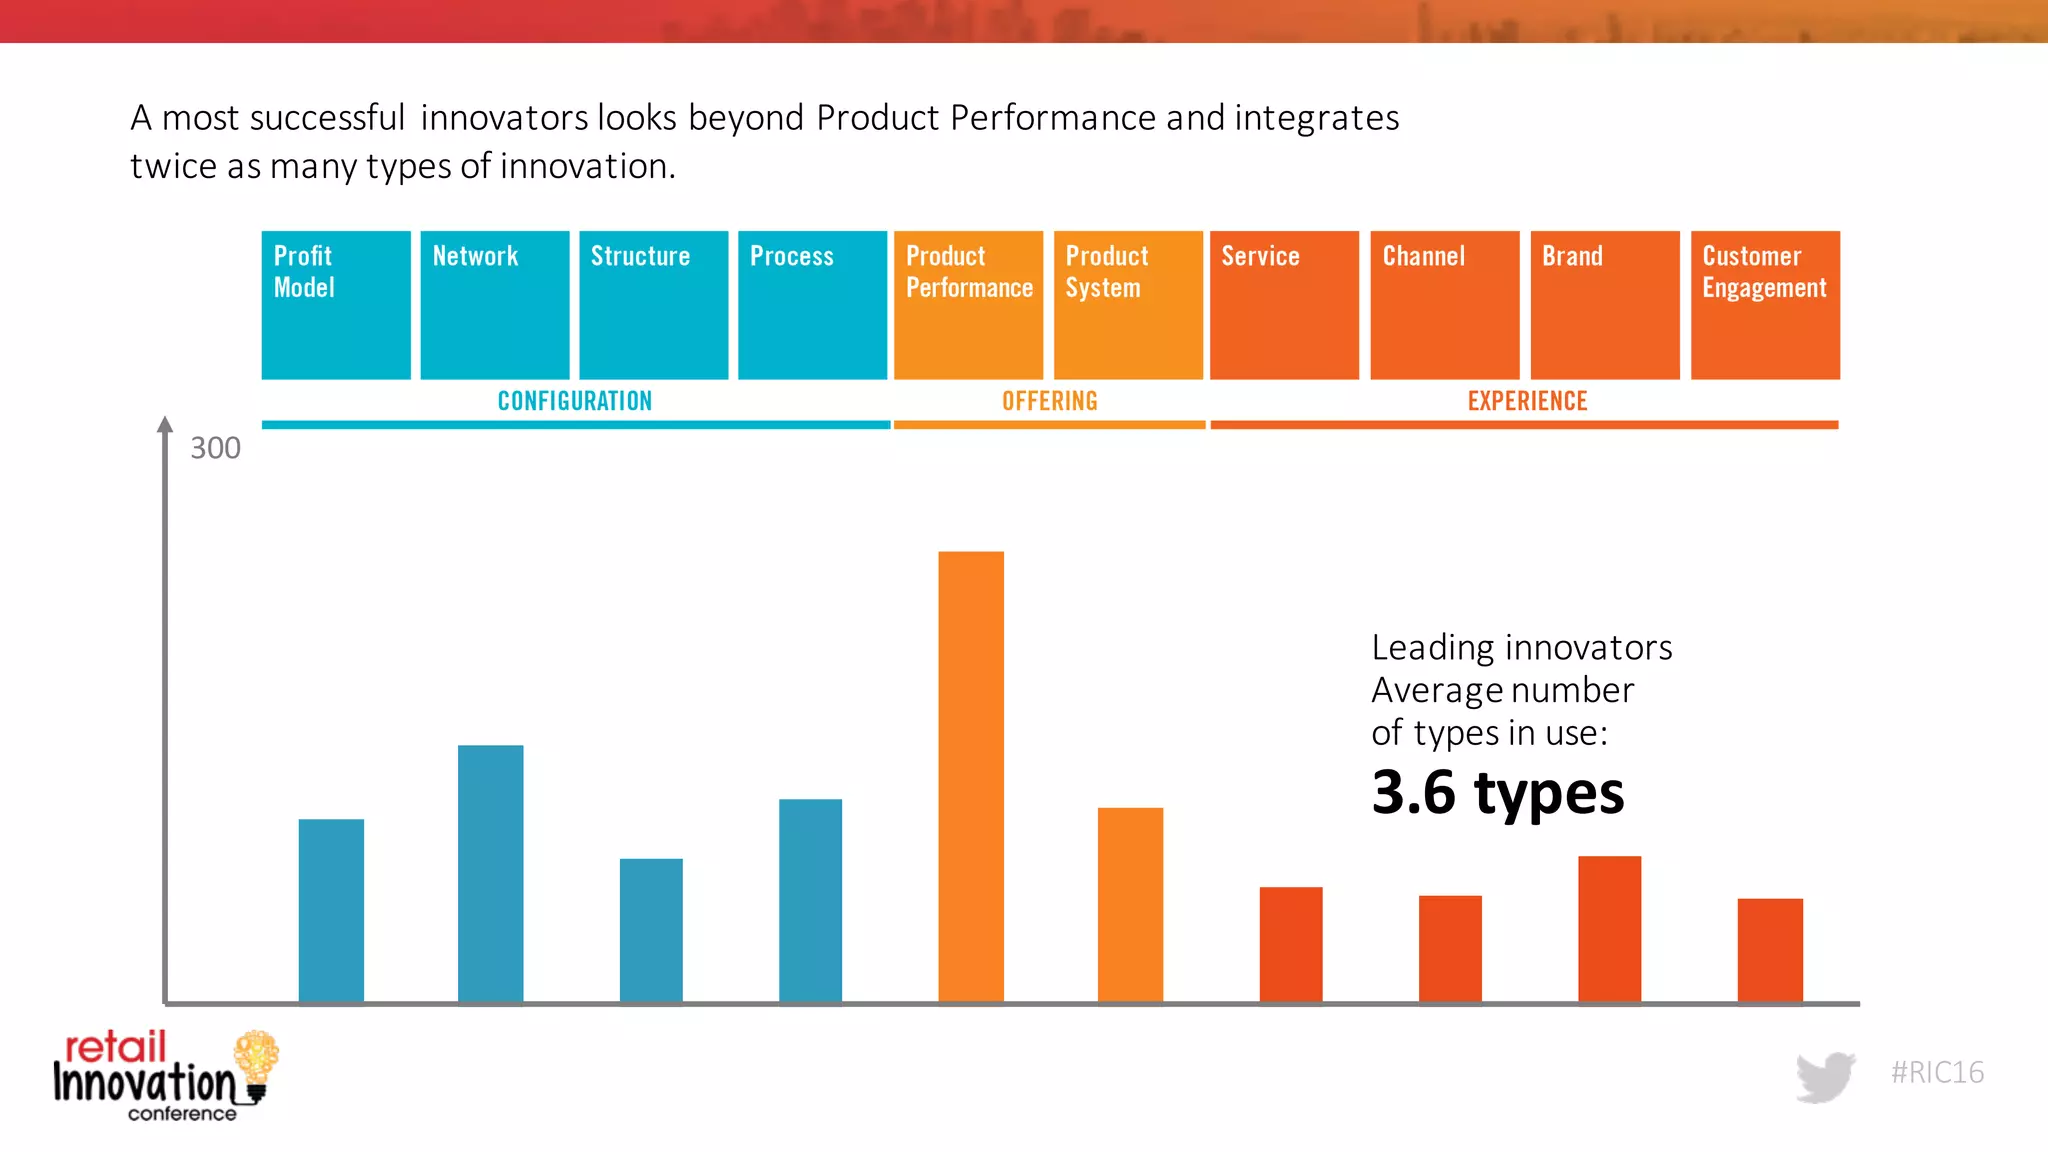
#RIC16
Retail	
  Disrupted:	
  Using	
  Empirical	
  
Market	
  Share	
  Data	
  To	
  Measure	
  
Industry	
  Disruption
Kasey	
  Lobaugh,	
  Chief	
  Retail	
  Innovation	
  Officer,	
  Deloitte	
  
Consulting
Lance	
  Thornswood,	
  Senior	
  Director,	
  Omnichannel,	
  JCPenney
Scott	
  Moore,	
  former	
  SVP,	
  Marketing	
  Best	
  Buy
#RIC16
Moore’s	
  Law
Calculations/Sec	
  per	
  $1000	
  computer
#RIC16
Scarcity	
  to	
  Abundance
#RIC16
#RIC16
Volatility	
  of	
  Share
0%
5%
10%
15%
20%
25%
06-­‐07 07-­‐08 08-­‐09 09-­‐10 10-­‐11 11-­‐12 12-­‐13 13-­‐14 14-­‐15 15-­‐16
Weighted	
  Standard	
  Deviation,	
  Brands	
  Contributing	
  Most	
  to	
  Annual	
  Volatility
Increasing	
  volatility
Share	
  Volatility
US	
  Retail	
  Market	
  Share	
  Volatility
#RIC16
0.69
0.70
0.71
0.72
2009 2010 2011 2012 2013 2014 2015
Relative Mean…
Fragmentation
US	
  Concentration	
  of	
  Share
Decreasing	
  Concentration
1. Gini	
  coefficient,	
  with	
  0	
  being	
  complete	
  share	
  equality	
  and	
  1	
  being	
  monopoly.	
  Measured	
  based	
  on	
  top	
  140	
  retailers*.	
  
* Top	
  US	
  retailers	
  are	
  defined	
  by	
  revenue	
  size	
  within	
  the	
  largest	
  250	
  Global	
  Retailers	
  as	
  tracked	
  by	
  Planet	
  Retail.	
  Due	
  to	
  M&A	
  and banners	
  
moving	
  in/out	
  of	
  the	
  Global	
  250	
  list,	
  the	
  number	
  of	
  Top	
  US	
  retailers	
  within	
  this	
  global	
  list	
  varies	
  by	
  year,	
  between	
  143-­‐158
#RIC16
18%
23%
28%
33%
38%
2007 2008 2009 2010 2011 2012 2013 2014 2015
Fragmentation
Stock	
  Price	
  Volatility
Increasing	
  volatility
Weighted	
  Standard	
  Deviation,	
  Top	
  20	
  Public	
  Retailers
#RIC16
Forces	
  at	
  Play
COMPETITION
CONFIGURATION
CUSTOMER
Reduced	
  Barriers
To	
  Entry
Decoupled	
  
Value	
  Chain
Non-­‐Traditional
Sources
Emergence	
  of
Ecosystems
Reduced	
  
Ownership	
  of
Assets	
  &	
  
Infrastructure
Constantly
Connected
Experience
Driven
New	
  Economics
New	
  Profit	
  
Models
New	
  Economics
Reduced
Barriers
To	
  Entry
Decoupled	
  
Value	
  Chain
#RIC16
Commoditization
Experience	
  Differentiation
Product	
  Differentiation
HighLow
HighLow
Performance
2.1% COMPS
6.7% EBITDA
6.5% COMPS
15.8% EBITDA
0.5% COMPS
1.4% EBITDA
2.5% COMPS
10.0% EBITDA
#RIC16
Network
Connections	
  
with	
  others	
  to	
  
create	
  value
Process
Signature	
  or	
  superior	
  
methods	
  for	
  doing	
  
your	
  work
Product System
Complementary	
  
products	
  and	
  
services
Channel
How	
  your	
  offerings	
  	
  are	
  
delivered	
   to	
  customers	
  
and	
  users
Customer
Engagement
Distinctive	
  interactions	
  
you	
  foster
Profit	
  Model
The	
  way	
  in	
  which	
  
you	
  make	
  money
Structure
Alignment	
  of	
  your	
  
talent	
  and	
  assets
Product	
  
Performance
Distinguishing	
  
features	
  and	
  functionality
Service
Support	
  and	
  
enhancements	
  
that	
  surround	
  
your	
  offerings
Brand
Representation	
  
of	
  your	
  offerings
and	
  business
We	
  discovered	
  that	
  recognizing	
  and	
  constructing	
  across	
  multiple	
  types	
  of	
  innovation	
  produced	
  more	
  robust	
  
innovation	
  concepts.
#RIC16
The	
  average	
  innovator	
  tends	
  to	
  pursue	
  product-­‐based	
  innovation	
  which	
  integrates	
  few	
  other	
  types.
Average	
  number	
  of	
  types	
  
in	
  use:
1.8	
  types
300
#RIC16
A	
  most	
  successful	
  innovators	
  looks	
  beyond	
  Product	
  Performance	
  and	
  integrates	
  
twice	
  as	
  many	
  types	
  of	
  innovation.
Leading	
  innovators	
  
Average	
  number	
  
of	
  types	
  in	
  use:
3.6	
  types
300
#RIC16
“It	
  is	
  not	
  the	
  strongest	
  of	
  the	
  
species	
  that	
  survives,	
  but	
  the	
  one	
  
most	
  adaptable	
  to	
  change.”
Charles	
  Darwin
#RIC16
Kasey	
  Lobaugh
Chief	
  Retail	
  Innovation	
  Officer
Deloitte	
  Digital
(913)	
  219	
  5073
klobaugh@deloitte.com
@klobaugh
#RIC16

Using Empirical Market Share Data To Measure Industry Disruption

  • 1.
    #RIC16 Retail  Disrupted:  Using  Empirical   Market  Share  Data  To  Measure   Industry  Disruption Kasey  Lobaugh,  Chief  Retail  Innovation  Officer,  Deloitte   Consulting Lance  Thornswood,  Senior  Director,  Omnichannel,  JCPenney Scott  Moore,  former  SVP,  Marketing  Best  Buy
  • 2.
  • 3.
  • 4.
  • 5.
    #RIC16 Volatility  of  Share 0% 5% 10% 15% 20% 25% 06-­‐0707-­‐08 08-­‐09 09-­‐10 10-­‐11 11-­‐12 12-­‐13 13-­‐14 14-­‐15 15-­‐16 Weighted  Standard  Deviation,  Brands  Contributing  Most  to  Annual  Volatility Increasing  volatility Share  Volatility US  Retail  Market  Share  Volatility
  • 6.
    #RIC16 0.69 0.70 0.71 0.72 2009 2010 20112012 2013 2014 2015 Relative Mean… Fragmentation US  Concentration  of  Share Decreasing  Concentration 1. Gini  coefficient,  with  0  being  complete  share  equality  and  1  being  monopoly.  Measured  based  on  top  140  retailers*.   * Top  US  retailers  are  defined  by  revenue  size  within  the  largest  250  Global  Retailers  as  tracked  by  Planet  Retail.  Due  to  M&A  and banners   moving  in/out  of  the  Global  250  list,  the  number  of  Top  US  retailers  within  this  global  list  varies  by  year,  between  143-­‐158
  • 7.
    #RIC16 18% 23% 28% 33% 38% 2007 2008 20092010 2011 2012 2013 2014 2015 Fragmentation Stock  Price  Volatility Increasing  volatility Weighted  Standard  Deviation,  Top  20  Public  Retailers
  • 8.
    #RIC16 Forces  at  Play COMPETITION CONFIGURATION CUSTOMER Reduced  Barriers To  Entry Decoupled   Value  Chain Non-­‐Traditional Sources Emergence  of Ecosystems Reduced   Ownership  of Assets  &   Infrastructure Constantly Connected Experience Driven New  Economics New  Profit   Models New  Economics Reduced Barriers To  Entry Decoupled   Value  Chain
  • 9.
    #RIC16 Commoditization Experience  Differentiation Product  Differentiation HighLow HighLow Performance 2.1%COMPS 6.7% EBITDA 6.5% COMPS 15.8% EBITDA 0.5% COMPS 1.4% EBITDA 2.5% COMPS 10.0% EBITDA
  • 10.
    #RIC16 Network Connections   with  others  to   create  value Process Signature  or  superior   methods  for  doing   your  work Product System Complementary   products  and   services Channel How  your  offerings    are   delivered   to  customers   and  users Customer Engagement Distinctive  interactions   you  foster Profit  Model The  way  in  which   you  make  money Structure Alignment  of  your   talent  and  assets Product   Performance Distinguishing   features  and  functionality Service Support  and   enhancements   that  surround   your  offerings Brand Representation   of  your  offerings and  business We  discovered  that  recognizing  and  constructing  across  multiple  types  of  innovation  produced  more  robust   innovation  concepts.
  • 11.
    #RIC16 The  average  innovator  tends  to  pursue  product-­‐based  innovation  which  integrates  few  other  types. Average  number  of  types   in  use: 1.8  types 300
  • 12.
    #RIC16 A  most  successful  innovators  looks  beyond  Product  Performance  and  integrates   twice  as  many  types  of  innovation. Leading  innovators   Average  number   of  types  in  use: 3.6  types 300
  • 13.
    #RIC16 “It  is  not  the  strongest  of  the   species  that  survives,  but  the  one   most  adaptable  to  change.” Charles  Darwin
  • 14.
    #RIC16 Kasey  Lobaugh Chief  Retail  Innovation  Officer Deloitte  Digital (913)  219  5073 klobaugh@deloitte.com @klobaugh
  • 15.