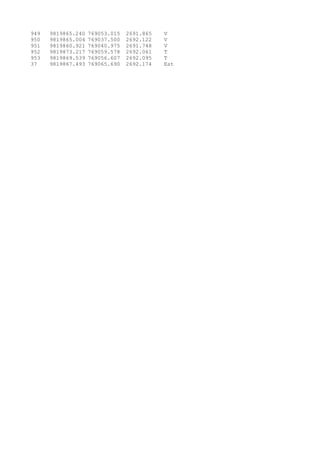
The document contains 392 data points consisting of x, y, z coordinate values measured by different methods (Cam, T, Cnl, etc.). The points appear to represent positions in 3D space tracked over time, as the values change incrementally with each new point.
This document appears to contain numeric data recorded in 30 second intervals that includes x and y coordinates and a z value. There are a total of 159 data points recorded over the course of 8,000 seconds.
The document appears to be a table containing stock price and valuation data for multiple companies. It includes columns for stock price, estimated fair price, percentage difference between current and fair price, and other valuation metrics. The table contains data for over 100 stock ticker symbols.
The document contains two tables providing future value interest factors for one dollar and one dollar annuities compounded at various interest rates over different periods of time. Table A-1 shows the future value of $1 invested at rates from 1% to 30% over periods from 1 to 30 years. Table A-2 shows the future value of a $1 annuity invested at the same rates and periods. The tables allow users to determine the future values of single investments and annuities based on the interest rate and time horizon.
The document appears to contain numerical data in a table format with percentages listed across the top and increasing whole numbers down the left side. The interior of the table contains increasing decimal values with up to 4 decimal places.
This document contains a weight chart for hexagon bolts and nuts in various sizes from Dinstock Ltd, a fastener supplier based in the UK. It lists the nominal diameter in millimeters and weights in kilograms for bolt and nut sizes from M12 to M39 over lengths ranging from 60 to 800 millimeters. The chart provides information on the standard weights for common metric bolt and nut sizes.
The document provides information on Turkey's economy and advantages for trade and investment. Some key points:
- Turkey has the 16th largest economy in the world and 6th largest in Europe. It has a large youth population and is a major steel producer.
- Turkish Airlines is one of the fastest growing and best airlines in Europe, carrying over 29 million passengers in 2010. Turkish airports see over 100 million passengers annually.
- The document lists Turkey as a major reason to invest, citing its strategic location and market size and growth potential.
This document provides information on the key aspects of developing a mountain resort, including:
- The resort would be located 2-6 hours from Montreal, Boston, and New York.
- It would include 620 skiable acres with an average annual snowfall of 300 inches.
- The total estimated budget for development is $100.68 million, which would cover costs for lifts, ski runs, buildings, parking, snowmaking infrastructure, grooming equipment and more.
- The resort would target a mix of beginner (22%), intermediate (70%), and advanced (8%) skiers with 50 named ski trails.
The document appears to be statistics on exam scores from the 106th academic year for unspecified subjects. It provides data on the number and percentage of students who scored within given ranges, cumulatively from the highest to lowest scores. For example, it shows that for scores from 100-100.99, 1 student scored in that range, making up 0% of the total 45,290 students.
This document provides preliminary election results from the October 23, 2011 general elections in Argentina. It shows the results for each province as well as the overall national results. The results show that FPV received the most votes nationally at 54.11%, followed by FAP at 16.8% and UDESO at 11.14%. A total of 22,955,070 votes were counted across the country.
The document provides steps to calculate unbalanced 3-phase power loads. It gives the formulas to calculate line-to-neutral voltage, phase loads, and total load based on line-to-line voltage, phase currents, and power factor. It then provides power consumption details in a table with machine numbers, currents, voltages, phase loads, and total loads. The total loading of various machines and processes are calculated.
The document contains a code that should be copied into two text files named AccionesBonosUSA.txt. The code provides daily stock price and other financial data for various US companies and indices from 1987 to 1987. It lists dates, company ticker symbols, and corresponding price values.
This document contains data on exam scores from the 105th academic year for unspecified subjects. It shows the number and percentage of students who scored within given ranges, cumulatively from highest to lowest scores and vice versa. For example, 1 student scored 100, and 47859 students took the exam, meaning 100% scored below 100. The majority of students scored between 50-60, with over 19000 students scoring between 51-52. Similar data is provided for Chinese scores.
The document is an Erlang B traffic table that shows the maximum offered traffic load versus blocking probability (B) and number of lines (N). It provides traffic load values for various combinations of B (ranging from 0.01 to 40%) and N (ranging from 1 to 77 lines). The higher the traffic load, the higher the blocking probability will be for a given number of lines.
This document shows statistics on vehicle fatalities and major injuries in the United States from 2001 to 2013. The number of fatalities decreased from 446 in 2001 to 317 in 2013 while the fatality rate per 100 million vehicle miles traveled decreased from 1.46 to 1.01 over the same period. Major injuries initially decreased from 2,368 in 2001 to 1,537 in 2013 and the major injury rate also saw a decline from 7.77 to 4.87 per 100 million VMT during these years. Five-year rolling averages are also shown to account for year-to-year fluctuations.
This document contains a table with percentiles for the chi-squared distribution across various degrees of freedom (g.l.) and significance levels. It shows the critical value needed to reject the null hypothesis for different sample sizes and confidence levels in chi-squared tests of independence and goodness of fit.
The document contains measurements of the distance and azimuth from trees to a central point in 4 different quadrants. For each tree, it lists the quadrant, tree number, distance, azimuth, radians, sine, cosine, and x and y coordinates. There are a total of 32 trees measured across the 4 quadrants.
The document contains measurements of distance, azimuth, and calculated x and y coordinates for 32 trees across 4 quadrants. The measurements are organized by quadrant, tree number, distance, azimuth, and calculated values for radians, sine, cosine, x coordinate, and y coordinate.
1) The table shows the Chi-square distribution with values of x for different degrees of freedom (g) and probabilities (p) of x being greater than the table value.
2) For a given g and p, x is the Chi-square value such that the probability of being greater than x is equal to p.
3) The table provides Chi-square values for probabilities of 0.001 to 0.999 and degrees of freedom from 0 to 100.
The document contains survey data from a road construction project including coordinates, elevations, cut depths, embankment heights, and volumes of material removed and placed at regular intervals along the road. The data is presented in a table with distance along the road in the first column and corresponding coordinate, elevation, cut, embankment and volume metrics in subsequent columns.
The document displays statistics for various NCAA Division III men's basketball teams across multiple categories like field goal percentage, turnover percentage, offensive and defensive rebounding percentages, and points scored and allowed per possession. The teams are listed along with their statistics, with an average included at the bottom to summarize the overall metrics.
This document appears to be a rank list for admission to B.Tech programs at IIITD (Indian Institute of Information Technology, Delhi) for candidates outside the Delhi region. It includes the application ID, category, scores and ranks for candidates in the qualifying examination and JEE Paper 1 and Paper 2. The total score is calculated based on a formula that assigns 40% weight to the normalized JEE Paper 1 score and 60% weight to the greater of Paper 1 or Paper 2. An overall rank and category rank is provided for each candidate.
1. This document contains the results of the first midterm exam in Chemistry I for 2009, listing student identification numbers, exam numbers, and scores.
2. The students' scores ranged from 2.4 to 5.3 out of 6 possible points.
3. Some students were absent and had pending scores.
The document shows performance metrics for various customer service representatives over a period from May 11th to June 9th, including average handle time, transfers percentage, and percentages of honored commitments. Most representatives had average handle times between 4 to 8 minutes, transfers percentages between 20-40%, and over 90% of commitments honored. However, a few outliers had higher or lower values in some metrics.
This document contains a table listing chi-square distribution values for different degrees of freedom and probability levels. The table includes:
- Degrees of freedom (ν) ranging from 1 to 100+ in the left column.
- Various probability levels (p) from 0.001 to 0.5 across the top row.
- The corresponding chi-square distribution critical values where the probability of exceeding that value is equal to the probability level.
The document shows a table of critical values for the chi-square distribution for different degrees of freedom (df) and significance levels (α). The table lists the critical values of the chi-square distribution for df ranging from 1 to 1000 and α values of 0.1, 0.05, 0.025, 0.01, 0.005, and 0.001. This table can be used to determine if a calculated chi-square value is statistically significant for a given df and α.
The monthly report summarizes delivery and growth statistics for several areas from September 26 to October 25, 2021. Total deliveries were 35,577, with 2,857 late deliveries (7.99% late rate). The area with the highest number of deliveries was Modernland Tangcity Cikokol at 38,584 deliveries and the lowest on-time delivery percentage was Nerogtog Sudimara at 60%. Overall, deliveries increased 3.91% compared to the previous month while late deliveries decreased 11.69%.
The document provides a conversion table for inches to millimeters. It lists inches in decimal and fractional increments from 0 inches to 1 inch in the left column. The corresponding millimeter measurements are listed in the right column. There are conversion values shown for 64ths of an inch up to 59/64 of an inch.
The document appears to contain coordinate data for various points labeled with codes like TR, COLG, LU. There are 191 data points listed with x,y,z coordinates and codes.
This document contains a list of 45 data points with two values each: a numeric x-value and a corresponding y-value. The x-values range from 0.7943283 to 100 in increasing order, while the y-values decrease from 102.4378 to 0.00174015 as x increases.
The document contains a table of numbers organized in rows and columns. The first column contains probability values from 0.1 to 0.005 decreasing by factors of 2. The remaining columns contain sets of numbers that decrease as the probability values decrease.
The document contains two tables providing future value interest factors for one dollar and one dollar annuities compounded at various interest rates over different periods of time. Table A-1 shows the future value of $1 invested at rates from 1% to 30% over periods from 1 to 30 years. Table A-2 shows the future value of a $1 annuity invested at the same rates and periods. The tables allow users to determine the future values of single investments and annuities based on the interest rate and time period.
The document contains two tables providing future value interest factors for present values compounded over time at given interest rates. Table A-1 gives the future value of $1 invested for a given number of periods at rates from 1% to 30%. Table A-2 gives the future value of a $1 annuity invested over the same periods and rates. Both tables allow users to determine the future value of investments based on the interest rate and length of time compounded.
The document contains two tables providing future value interest factors for present values compounded over time at given interest rates. Table A-1 gives the future value of $1 invested for a given number of periods at rates from 1% to 30%. Table A-2 gives the future value of a $1 annuity invested over the same periods and rates. The tables allow users to calculate future or present values of investments compounded at different rates over different lengths of time.
This document summarizes dairy product import data to Colombia from 1991-2011, including the kilograms and US dollar cost of imports for milk powders, evaporated milk, condensed milk, liquid milk, butter, cheeses, whey, and totals. It shows that import quantities and costs generally increased over time, with the largest imports being milk powders, liquid milk, and cheeses.
The document appears to be a table containing stock market data including closing prices and various moving average values for multiple ticker symbols. Specifically, it lists the ticker, close price, and 10 different moving average calculations including short term (20 day), medium term (50-100 day), and long term (200 day) averages. This provides a snapshot of stock performance and trends over different durations.
The document appears to be a table containing stock market data including closing prices and various moving average values for multiple ticker symbols. It includes columns for the ticker, close price, and 10 different types of moving averages including short term (20 day), medium term (50-100 day), and long term (200 day) averages. This table provides a snapshot of performance metrics for dozens of stocks.
The Future of Data Visualization on the Web. FrontEnd Con 2019.Alan Mendelevich
This document discusses the future of data visualization on the web. It notes that data visualization is becoming more common online as data sets grow larger and tools for visualizing data improve. However, current web technologies can limit complex visualization. The future may see new standards and frameworks that better support advanced visualization directly in browsers without plugins. This would make data visualization more powerful and accessible online.
The Future of Data Visualization on the Web (YGLF)Alan Mendelevich
Gone are the days when we used creative HTML table tricks to show a bar chart or resorted to saving static images from Excel. In this talk, we will cover the modern data visualization landscape and take a peek into the future.
Tabla salarial docentes decreto 2277 de 1979 historicoCarlos Estrada
This document presents salary data for Colombian teachers from 1989 to 2027 according to the 1979 Decree 2277 salary scale. It lists 14 salary grades and their salaries for each year. Salaries increased each year, with the highest grades earning the most. By 2027, Grade 1 teachers were projected to earn over $1 million Colombian pesos and Grade 14 over $3.6 million pesos.
The document contains data from 11 events measuring angle in degrees, height of water in meters, and pressure difference in Pascals. The data is arranged in a table with the measurements for each event recorded in columns and the variables labeled in rows.
The document contains a table with various hydraulic parameters including:
- K coefficient
- Angle (radians and degrees)
- Dimensionless parameters involving angle
- Differences between parameters
- Wetted area, wetted perimeter, hydraulic radius, velocity, depth, and diameter.
The table contains values for these parameters for different pipe materials with varying angles and coefficients.
The document lists American Wire Gauge (AWG) wire sizes from 36 to 2000 in both imperial and metric units, providing the wire diameter, cross-sectional area, and standard size for each listing. Wire sizes range from 0.0050 inches to 2 inches in diameter, and include common wire gauges for solid copper conductors used in electrical work.
Laporan 1 Sistem dan Signal (DFT Ms. Excel)Bayu Nurcahyo
Menganalisis gelombang suara manusia dengan merekam suara bernada diatonis pada Software Spectraplus V5.0. lalu mencari persamaan gelombang dengan bantuan pengolahan data Ms. Excel
The document contains an Erlang B traffic table that shows the maximum offered load versus B and N, where B is the blocking probability in % and N is the number of circuits. The table provides load values for different combinations of B ranging from 0.01 to 40% and N ranging from 1 to 77 circuits. The load values indicate the maximum number of external calls that can be offered to the system without exceeding the blocking probability B for a given number of circuits N.
Gone are the days when we used creative HTML table tricks to show a bar chart or resorted to saving static images from Excel. In this talk, we will cover the modern data visualization landscape and take a peek into the future.
This document provides specifications for various standard H-beam, wide flange, lip channel, and equal angle steel sections. It includes dimensions such as height, width, thickness, area, weight, moments of inertia, radii of gyration, and other geometric properties. Sections range in size from 100x100 mm to 588x300 mm for H-beams, 148x100 mm to 500x200 mm for wide flanges, 100x50x20 mm to 200x75x20 mm for lip channels, and 40x40 mm to 120x120 mm for equal angles. Properties are specified in metric units.
This document appears to contain time series data from 1952 to 1989 with annual observations of GDP, M1 money supply, inflation rate (PR), and interest rate (RS) for the United States. The data is organized by year and period (quarterly) with corresponding values listed for each economic indicator.
This tutorial offers a step-by-step guide on how to effectively use Pinterest. It covers the basics such as account creation and navigation, as well as advanced techniques including creating eye-catching pins and optimizing your profile. The tutorial also explores collaboration and networking on the platform. With visual illustrations and clear instructions, this tutorial will equip you with the skills to navigate Pinterest confidently and achieve your goals.
KALYAN MATKA | MATKA RESULT | KALYAN MATKA TIPS | SATTA MATKA | MATKA.COM | MATKA PANA JODI TODAY | BATTA SATKA | MATKA PATTI JODI NUMBER | MATKA RESULTS | MATKA CHART | MATKA JODI | SATTA COM | FULL RATE GAME | MATKA GAME | MATKA WAPKA | ALL MATKA RESULT LIVE ONLINE | MATKA RESULT | KALYAN MATKA RESULT | DPBOSS MATKA 143 | MAIN MATKA
The cherry: beauty, softness, its heart-shaped plastic has inspired artists since Antiquity. Cherries and strawberries were considered the fruits of paradise and thus represented the souls of men.
❼❷⓿❺❻❷❽❷❼❽ Dpboss Matka ! Fix Satta Matka ! Matka Result ! Matka Guessing ! Final Matka ! Matka Result ! Dpboss Matka ! Matka Guessing ! Satta Matta Matka 143 ! Kalyan Matka ! Satta Matka Fast Result ! Kalyan Matka Guessing ! Dpboss Matka Guessing ! Satta 143 ! Kalyan Chart ! Kalyan final ! Satta guessing ! Matka tips ! Matka 143 ! India Matka ! Matka 420 ! matka Mumbai ! Satta chart ! Indian Satta ! Satta King ! Satta 143 ! Satta batta ! Satta मटका ! Satta chart ! Matka 143 ! Matka Satta ! India Matka ! Indian Satta Matka ! Final ank