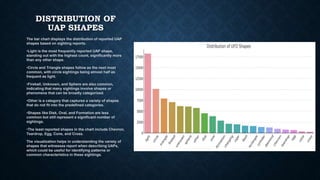
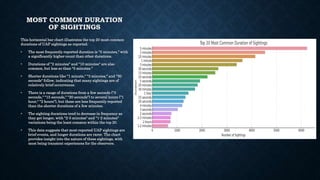
ANALYSIS OF UAP (UNIDENTIFIED AERIAL
PHENOMENA) / UFO (UNIDENTIFIED FLYING OBJECT)
RECORDED SIGHTINGS ACROSS NORTH AMERICA
Created by David Waynne
INTRODUCTION
• This presentation delves into the comprehensive analysis of recorded sightings of Unidentified Aerial Phenomena (UAP), also commonly
known as Unidentified Flying Objects (UFOs), across North America. Spanning from the year 2006 to 2018, our dataset encompasses
over 90,000 entries, providing an extensive overview of reported observations that have been meticulously logged and reported.
Understanding UAPs/UFOs:
• The terms UAP and UFO are often used interchangeably to describe aerial occurrences that cannot immediately be identified. The
designation UAP is increasingly used by professionals and within official reports to avoid the stigma often associated with the term UFO
and to encompass a broader spectrum of observed phenomena that do not necessarily imply an object with a physical structure or
origin from outside the Earth.
Purpose of Analysis:
• The objective of this analysis is to extract discernible patterns, trends, and characteristics from the reported sightings data. Our analysis
seeks to present an empirical foundation for understanding the frequency, distribution, and nature of these phenomena. By employing
rigorous data analytics methodologies, the presentation will address geographical distribution, temporal trends, and reported
characteristics of the sightings.
Professional Context:
• The analysis is intended to serve researchers, scholars, and the interested public who seek a methodical and data-driven approach to
the study of UAP/UFO sightings. The findings aim to contribute to the ongoing conversation and investigation into these occurrences
while maintaining a professional and unbiased perspective. Our presentation aims to provide a factual and comprehensive analysis of
UAP/UFO sightings across North America. It is designed to be a resource for informed discussions, further research, and a steppingstone for policy
formulation regarding airspace safety and the scientific exploration of unexplained aerial phenomena.
DISTRIBUTION OF CITY
LATITUDE/LONGITUDE
•The histogram on the left displays the
frequency of UAP sightings across different
city latitudes.
•Most sightings are concentrated around
latitudes 30°N to 50°N.
•There is a significant peak around the
latitude 40°N, which suggests a higher
number of sightings in this area
•The histogram on the right shows the
frequency of UAP sightings across city
longitudes.
•There is a notable concentration of
sightings around longitudes -120°W to -
70°W.
•The distribution suggests that a significant
number of sightings are reported in the
TOP STATES BY NUMBER
OF SIGHTINGS
This bar chart visualizes the top 20 states by the
number of UAP sightings reported.
•California (CA) stands out as the state with the
most reported sightings, with a significantly higher
count than the other states.
•Florida (FL) and Washington (WA) follow as the
states with the second and third highest sightings,
respectively.
•The remaining states show a more gradual
decrease in the number of sightings.
•States such as Texas (TX), New York (NY),
Pennsylvania (PA), and Arizona (AZ) also have a
high number of sightings, but less than half of
those reported in California.
•The least within the top 20 are South Carolina (SC)
and Indiana (IN), which still have a considerable
number of sightings relative to other states not
shown on the chart.
This distribution could be influenced by factors
such as population density, military bases, or
reporting propensity. The chart is helpful for
identifying which states may warrant further
investigation into UAP activity or public interest in
the phenomenon
DISTRIBUTION OF
UAP SHAPES
The bar chart displays the distribution of reported UAP
shapes based on sighting reports.
•Light is the most frequently reported UAP shape,
standing out with the highest count, significantly more
than any other shape.
•Circle and Triangle shapes follow as the next most
common, with circle sightings being almost half as
frequent as light.
•Fireball, Unknown, and Sphere are also common,
indicating that many sightings involve shapes or
phenomena that can be broadly categorized.
•Other is a category that captures a variety of shapes
that do not fit into the predefined categories.
•Shapes like Disk, Oval, and Formation are less
common but still represent a significant number of
sightings.
•The least reported shapes in the chart include Chevron,
Teardrop, Egg, Cone, and Cross.
The visualization helps in understanding the variety of
shapes that witnesses report when describing UAPs,
which could be useful for identifying patterns or
common characteristics in these sightings.
NUMBER OF
SIGHTINGS BY YEAR
The line graph depicts the number of UAP sightings
reported each year from 2006 through 2018.
•There is an upward trend in reports from 2006,
peaking around 2012 with the highest number of
sightings.
•Following 2012, there is a sharp decline in 2013,
showing the lowest number of reports in the
observed period.
•After 2013, there is a recovery in the number of
reports, with a steep increase up to 2014.
•A gradual decline is observed from 2014 to 2016.
•Notably, there is a significant increase once again
in the number of reports in 2018.
This graph could suggest various underlying
patterns or factors influencing the number of
reports, such as increased public interest, more
frequent occurrences, or perhaps changes in
reporting mechanisms or public awareness
campaigns. The sharp fluctuations, particularly
between consecutive years like 2012-2013 and
2017-2018, indicate that there might be specific
events or changes in reporting practices
influencing these numbers.
MOST COMMON DURATION
OF SIGHTINGS
This horizontal bar chart illustrates the top 20 most common
durations of UAP sightings as reported.
• The most frequently reported duration is "5 minutes," with
a significantly higher count than other durations.
• Durations of "2 minutes" and "10 minutes" are also
common, but less so than "5 minutes."
• Shorter durations like "1 minute," "3 minutes," and "30
seconds" follow, indicating that many sightings are of
relatively brief occurrences.
• There is a range of durations from a few seconds ("3
seconds," "15 seconds," "20 seconds") to several hours ("1
hour," "2 hours"), but these are less frequently reported
than the shorter durations of a few minutes.
• The sighting durations tend to decrease in frequency as
they get longer, with "2-3 minutes" and "1-2 minutes"
variations being the least common within the top 20.
• This data suggests that most reported UAP sightings are
brief events, and longer durations are rarer. The chart
provides insight into the nature of these sightings, with
most being transient experiences for the observers.
TOP 20 CITIES W/
MOST SIGHTINGS
This horizontal bar chart presents the top 20 cities by
the number of UAP sightings.
•New York tops the chart with the highest number of
sightings, significantly more than other cities.
•Phoenix, Las Vegas, and Portland follow, with each
having fewer sightings than New York, but still a
substantial number.
•Seattle and San Diego are also among the top cities,
with a moderately high number of sightings.
•The list includes a mix of cities spread across the
United States, indicating a widespread interest or
occurrence of UAP sightings.
•Cities like Los Angeles, Chicago, and Tucson show a
notable number of sightings, which could be related to
their large populations and urban settings.
•The chart concludes with Sacramento having the least
number of sightings among the top 20.
This visualization can be useful for identifying potential
hotspots for UAP activity or regions with higher reports,
which may be of interest to researchers or enthusiasts.
The higher incidence in major metropolitan areas could
be due to a higher number of observers or a higher
likelihood of reporting.
SIGHTINGS BY
YEAR
This bar chart illustrates the trend of reported UAP
sightings from the year 1969 to 2019. Here is an analysis
of the graph:
•Initial Observation: The first two decades show minimal
activity, with the number of reported sightings per year
staying quite low.
•Trend Change: A gradual increase in sightings begins
in the late 1980s, becoming more pronounced in the
1990s.
•Significant Growth: There is a sharp increase in reports
from the early 2000s, with the numbers rising
significantly year over year.
•Peak Activity: The chart indicates that the peak of
reported sightings occurs between 2010 and 2014, with
the highest number of sightings in this period.
•Recent Years: After the peak, there is a noticeable
decline in the number of reported sightings, though the
numbers do not fall back to the levels seen in the 20th
century.
•Possible Factors: The reasons for these patterns could
be multifaceted, including increased public interest, the
proliferation of digital cameras and smartphones, the
internet's role in sharing information, or perhaps
changes in the environment or military activity that
could be mistaken for UAPs.
SIGHTINGS BY
MONTH
The bar chart visualizes the number of UAP
sightings reported by month.
•The sightings are relatively lower at the beginning
of the year, with January and February having
fewer reports.
•A steady increase is observed from March,
peaking in July, which suggests that the summer
months may have higher UAP activity or that
people are more likely to report sightings during
this time.
•After July, there's a slight decrease in sightings,
but the numbers remain relatively high through
October.
•There is a noticeable dip in November, followed by
a slight increase in December.
This pattern may be influenced by various factors,
including weather conditions, which can affect
visibility and the likelihood of people being
outdoors to witness and report such events.
Additionally, cultural events and holidays could
also play a role in the frequency of reports. The
peak during the summer months could be due to
clearer skies and more recreational outdoor
activities during the evening when sightings are
more likely to be observed.
IN CONCLUSION
1.Geographical Insights:
1. The data revealed that UAP sightings were heavily concentrated in the United States, with California, Florida, and Washington
being the top states for reported incidents. Among cities, New York City had the highest number of reports.
2.Temporal Patterns:
1. The analysis showed fluctuations in the number of sightings over the years, with a notable peak in 2012. There were also
seasonal variations, with sightings most frequently reported during the summer months, especially in July.
3.Sighting Characteristics:
1. In terms of UAP shapes, "light" was the most frequently reported, suggesting a common visual characteristic of UAP sightings.
The most common duration for sightings was "5 minutes," indicating that most sightings were brief.
4.Data Composition:
1. The dataset consisted of over 90,000 entries from 2006 to 2018, providing a rich source of information on UAP sightings.
However, there were challenges due to missing data, particularly in geographic coordinates, which could affect certain types of
analysis.
5.Reporting Trends:
1. The data suggested certain trends in reporting, with more sightings logged during specific times, which might correlate with
periods when people are more likely to observe the sky.
In summary, the UAP sightings dataset offered a detailed look at reported incidents across the United States over a 12-year period. The
analysis revealed that sightings are not random but have discernible patterns in terms of time and location. The findings could be valuable
for enthusiasts and researchers interested in understanding the phenomena of UAP sightings and could also point to socio-cultural factors
influencing the reporting of such events. It's important to note the limitations of the dataset due to incomplete entries, which necessitates
caution when interpreting the results.

UAP REPORT

  • 1.
    ANALYSIS OF UAP(UNIDENTIFIED AERIAL PHENOMENA) / UFO (UNIDENTIFIED FLYING OBJECT) RECORDED SIGHTINGS ACROSS NORTH AMERICA Created by David Waynne
  • 2.
    INTRODUCTION • This presentationdelves into the comprehensive analysis of recorded sightings of Unidentified Aerial Phenomena (UAP), also commonly known as Unidentified Flying Objects (UFOs), across North America. Spanning from the year 2006 to 2018, our dataset encompasses over 90,000 entries, providing an extensive overview of reported observations that have been meticulously logged and reported. Understanding UAPs/UFOs: • The terms UAP and UFO are often used interchangeably to describe aerial occurrences that cannot immediately be identified. The designation UAP is increasingly used by professionals and within official reports to avoid the stigma often associated with the term UFO and to encompass a broader spectrum of observed phenomena that do not necessarily imply an object with a physical structure or origin from outside the Earth. Purpose of Analysis: • The objective of this analysis is to extract discernible patterns, trends, and characteristics from the reported sightings data. Our analysis seeks to present an empirical foundation for understanding the frequency, distribution, and nature of these phenomena. By employing rigorous data analytics methodologies, the presentation will address geographical distribution, temporal trends, and reported characteristics of the sightings. Professional Context: • The analysis is intended to serve researchers, scholars, and the interested public who seek a methodical and data-driven approach to the study of UAP/UFO sightings. The findings aim to contribute to the ongoing conversation and investigation into these occurrences while maintaining a professional and unbiased perspective. Our presentation aims to provide a factual and comprehensive analysis of UAP/UFO sightings across North America. It is designed to be a resource for informed discussions, further research, and a steppingstone for policy formulation regarding airspace safety and the scientific exploration of unexplained aerial phenomena.
  • 4.
    DISTRIBUTION OF CITY LATITUDE/LONGITUDE •Thehistogram on the left displays the frequency of UAP sightings across different city latitudes. •Most sightings are concentrated around latitudes 30°N to 50°N. •There is a significant peak around the latitude 40°N, which suggests a higher number of sightings in this area •The histogram on the right shows the frequency of UAP sightings across city longitudes. •There is a notable concentration of sightings around longitudes -120°W to - 70°W. •The distribution suggests that a significant number of sightings are reported in the
  • 6.
    TOP STATES BYNUMBER OF SIGHTINGS This bar chart visualizes the top 20 states by the number of UAP sightings reported. •California (CA) stands out as the state with the most reported sightings, with a significantly higher count than the other states. •Florida (FL) and Washington (WA) follow as the states with the second and third highest sightings, respectively. •The remaining states show a more gradual decrease in the number of sightings. •States such as Texas (TX), New York (NY), Pennsylvania (PA), and Arizona (AZ) also have a high number of sightings, but less than half of those reported in California. •The least within the top 20 are South Carolina (SC) and Indiana (IN), which still have a considerable number of sightings relative to other states not shown on the chart. This distribution could be influenced by factors such as population density, military bases, or reporting propensity. The chart is helpful for identifying which states may warrant further investigation into UAP activity or public interest in the phenomenon
  • 8.
    DISTRIBUTION OF UAP SHAPES Thebar chart displays the distribution of reported UAP shapes based on sighting reports. •Light is the most frequently reported UAP shape, standing out with the highest count, significantly more than any other shape. •Circle and Triangle shapes follow as the next most common, with circle sightings being almost half as frequent as light. •Fireball, Unknown, and Sphere are also common, indicating that many sightings involve shapes or phenomena that can be broadly categorized. •Other is a category that captures a variety of shapes that do not fit into the predefined categories. •Shapes like Disk, Oval, and Formation are less common but still represent a significant number of sightings. •The least reported shapes in the chart include Chevron, Teardrop, Egg, Cone, and Cross. The visualization helps in understanding the variety of shapes that witnesses report when describing UAPs, which could be useful for identifying patterns or common characteristics in these sightings.
  • 10.
    NUMBER OF SIGHTINGS BYYEAR The line graph depicts the number of UAP sightings reported each year from 2006 through 2018. •There is an upward trend in reports from 2006, peaking around 2012 with the highest number of sightings. •Following 2012, there is a sharp decline in 2013, showing the lowest number of reports in the observed period. •After 2013, there is a recovery in the number of reports, with a steep increase up to 2014. •A gradual decline is observed from 2014 to 2016. •Notably, there is a significant increase once again in the number of reports in 2018. This graph could suggest various underlying patterns or factors influencing the number of reports, such as increased public interest, more frequent occurrences, or perhaps changes in reporting mechanisms or public awareness campaigns. The sharp fluctuations, particularly between consecutive years like 2012-2013 and 2017-2018, indicate that there might be specific events or changes in reporting practices influencing these numbers.
  • 12.
    MOST COMMON DURATION OFSIGHTINGS This horizontal bar chart illustrates the top 20 most common durations of UAP sightings as reported. • The most frequently reported duration is "5 minutes," with a significantly higher count than other durations. • Durations of "2 minutes" and "10 minutes" are also common, but less so than "5 minutes." • Shorter durations like "1 minute," "3 minutes," and "30 seconds" follow, indicating that many sightings are of relatively brief occurrences. • There is a range of durations from a few seconds ("3 seconds," "15 seconds," "20 seconds") to several hours ("1 hour," "2 hours"), but these are less frequently reported than the shorter durations of a few minutes. • The sighting durations tend to decrease in frequency as they get longer, with "2-3 minutes" and "1-2 minutes" variations being the least common within the top 20. • This data suggests that most reported UAP sightings are brief events, and longer durations are rarer. The chart provides insight into the nature of these sightings, with most being transient experiences for the observers.
  • 14.
    TOP 20 CITIESW/ MOST SIGHTINGS This horizontal bar chart presents the top 20 cities by the number of UAP sightings. •New York tops the chart with the highest number of sightings, significantly more than other cities. •Phoenix, Las Vegas, and Portland follow, with each having fewer sightings than New York, but still a substantial number. •Seattle and San Diego are also among the top cities, with a moderately high number of sightings. •The list includes a mix of cities spread across the United States, indicating a widespread interest or occurrence of UAP sightings. •Cities like Los Angeles, Chicago, and Tucson show a notable number of sightings, which could be related to their large populations and urban settings. •The chart concludes with Sacramento having the least number of sightings among the top 20. This visualization can be useful for identifying potential hotspots for UAP activity or regions with higher reports, which may be of interest to researchers or enthusiasts. The higher incidence in major metropolitan areas could be due to a higher number of observers or a higher likelihood of reporting.
  • 16.
    SIGHTINGS BY YEAR This barchart illustrates the trend of reported UAP sightings from the year 1969 to 2019. Here is an analysis of the graph: •Initial Observation: The first two decades show minimal activity, with the number of reported sightings per year staying quite low. •Trend Change: A gradual increase in sightings begins in the late 1980s, becoming more pronounced in the 1990s. •Significant Growth: There is a sharp increase in reports from the early 2000s, with the numbers rising significantly year over year. •Peak Activity: The chart indicates that the peak of reported sightings occurs between 2010 and 2014, with the highest number of sightings in this period. •Recent Years: After the peak, there is a noticeable decline in the number of reported sightings, though the numbers do not fall back to the levels seen in the 20th century. •Possible Factors: The reasons for these patterns could be multifaceted, including increased public interest, the proliferation of digital cameras and smartphones, the internet's role in sharing information, or perhaps changes in the environment or military activity that could be mistaken for UAPs.
  • 18.
    SIGHTINGS BY MONTH The barchart visualizes the number of UAP sightings reported by month. •The sightings are relatively lower at the beginning of the year, with January and February having fewer reports. •A steady increase is observed from March, peaking in July, which suggests that the summer months may have higher UAP activity or that people are more likely to report sightings during this time. •After July, there's a slight decrease in sightings, but the numbers remain relatively high through October. •There is a noticeable dip in November, followed by a slight increase in December. This pattern may be influenced by various factors, including weather conditions, which can affect visibility and the likelihood of people being outdoors to witness and report such events. Additionally, cultural events and holidays could also play a role in the frequency of reports. The peak during the summer months could be due to clearer skies and more recreational outdoor activities during the evening when sightings are more likely to be observed.
  • 19.
    IN CONCLUSION 1.Geographical Insights: 1.The data revealed that UAP sightings were heavily concentrated in the United States, with California, Florida, and Washington being the top states for reported incidents. Among cities, New York City had the highest number of reports. 2.Temporal Patterns: 1. The analysis showed fluctuations in the number of sightings over the years, with a notable peak in 2012. There were also seasonal variations, with sightings most frequently reported during the summer months, especially in July. 3.Sighting Characteristics: 1. In terms of UAP shapes, "light" was the most frequently reported, suggesting a common visual characteristic of UAP sightings. The most common duration for sightings was "5 minutes," indicating that most sightings were brief. 4.Data Composition: 1. The dataset consisted of over 90,000 entries from 2006 to 2018, providing a rich source of information on UAP sightings. However, there were challenges due to missing data, particularly in geographic coordinates, which could affect certain types of analysis. 5.Reporting Trends: 1. The data suggested certain trends in reporting, with more sightings logged during specific times, which might correlate with periods when people are more likely to observe the sky. In summary, the UAP sightings dataset offered a detailed look at reported incidents across the United States over a 12-year period. The analysis revealed that sightings are not random but have discernible patterns in terms of time and location. The findings could be valuable for enthusiasts and researchers interested in understanding the phenomena of UAP sightings and could also point to socio-cultural factors influencing the reporting of such events. It's important to note the limitations of the dataset due to incomplete entries, which necessitates caution when interpreting the results.