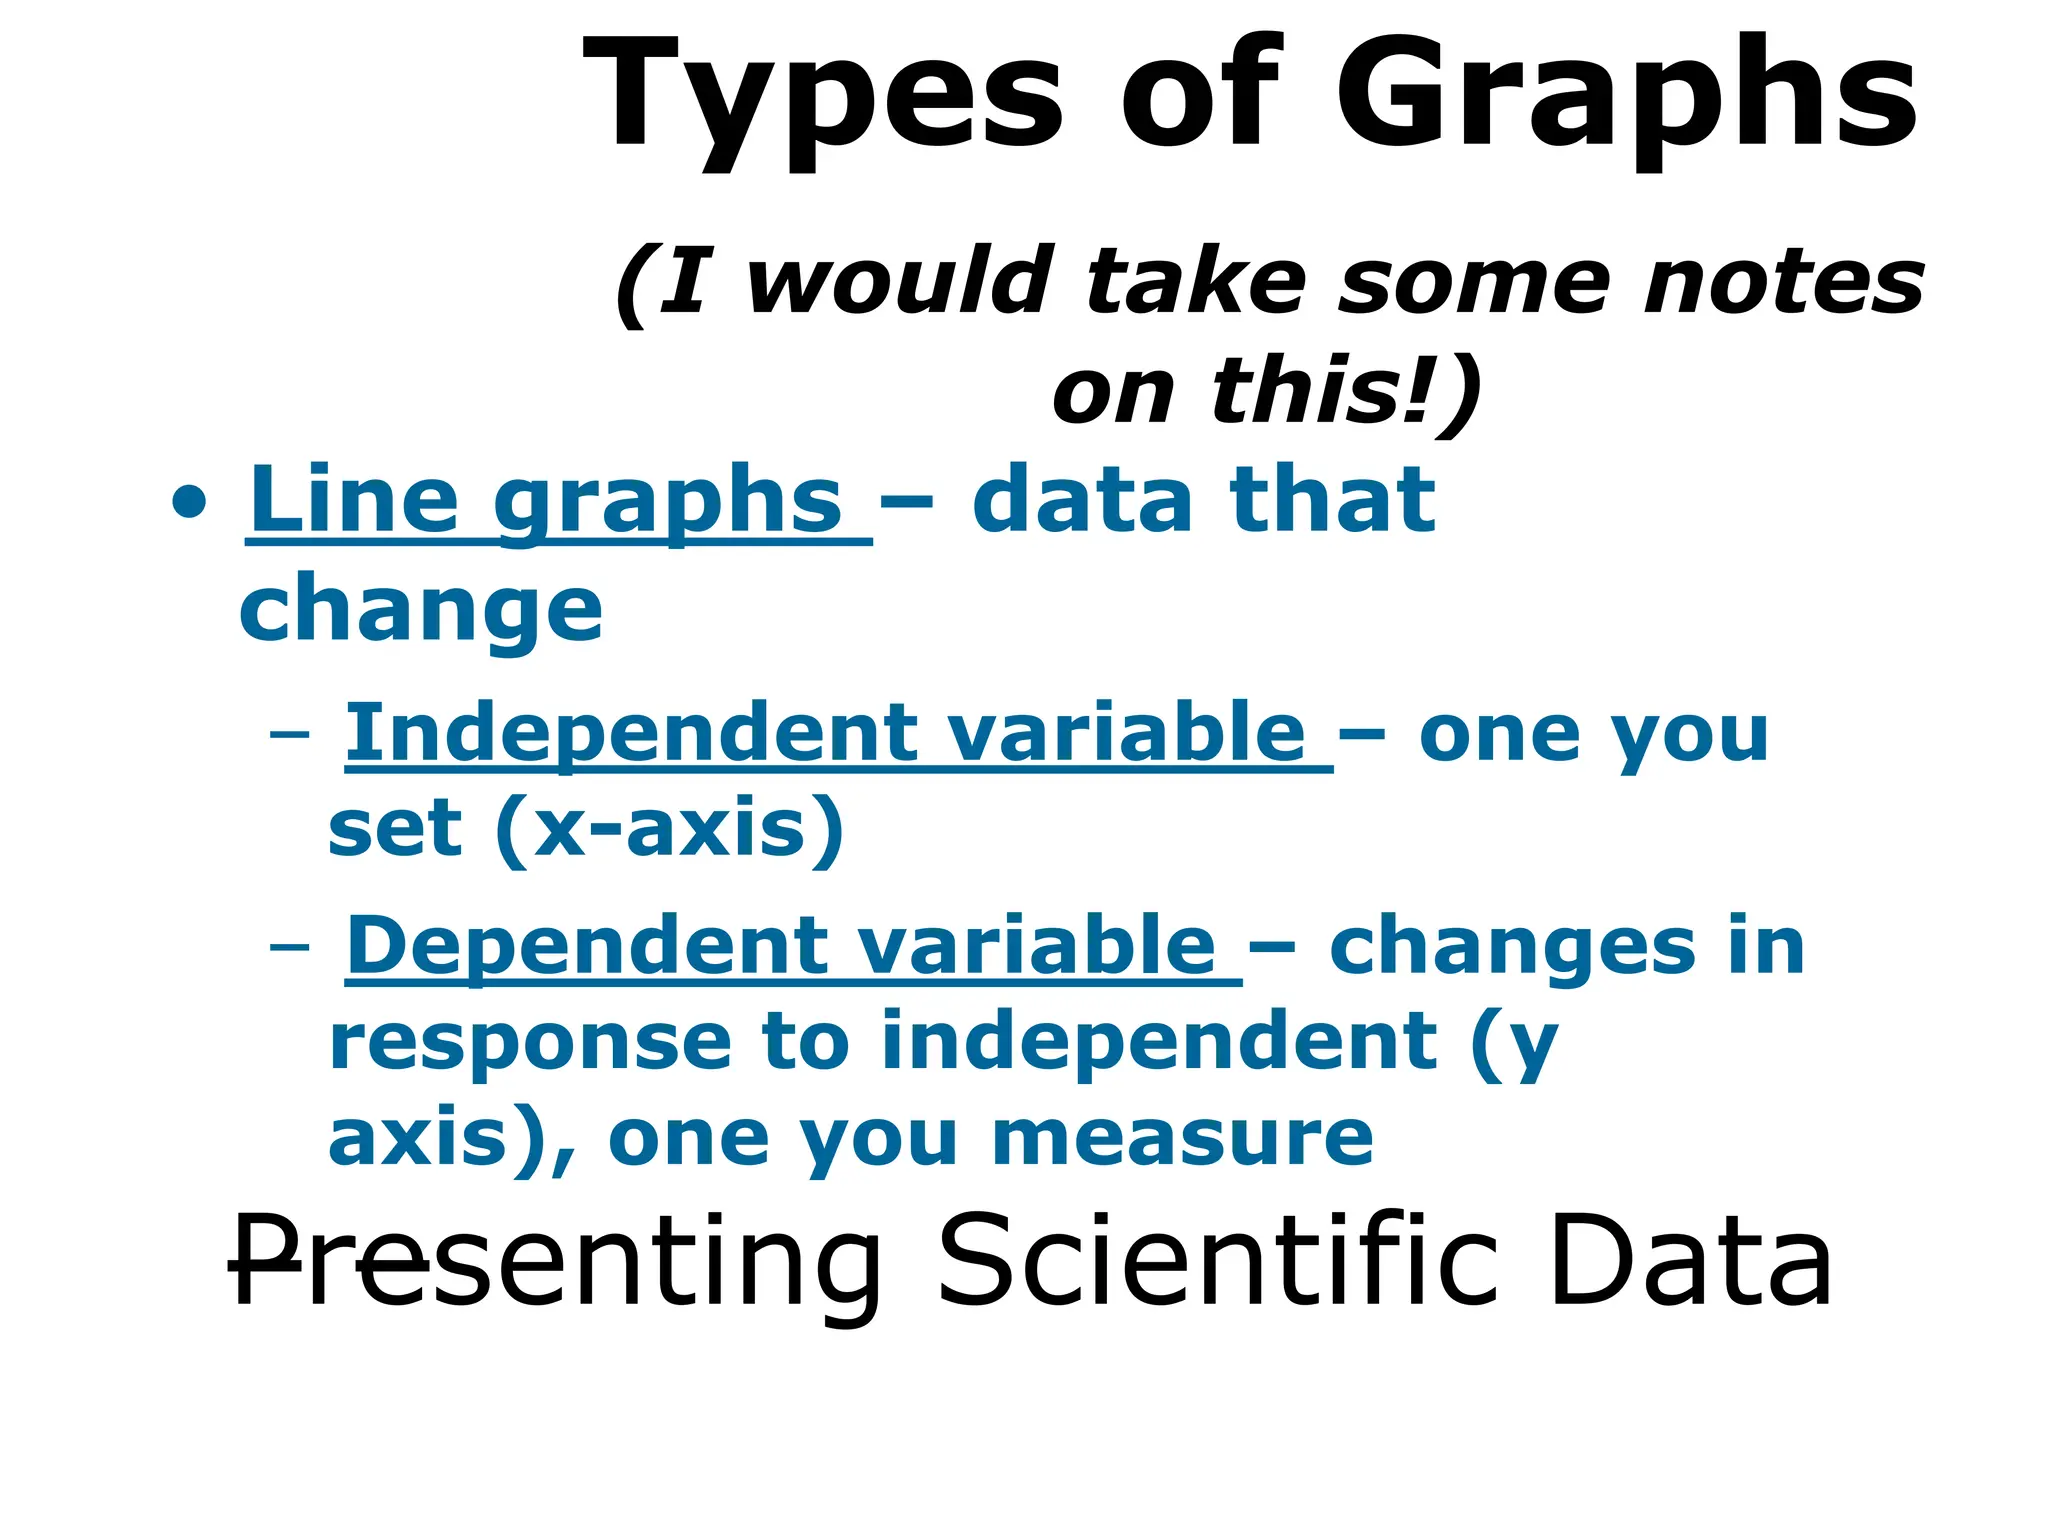
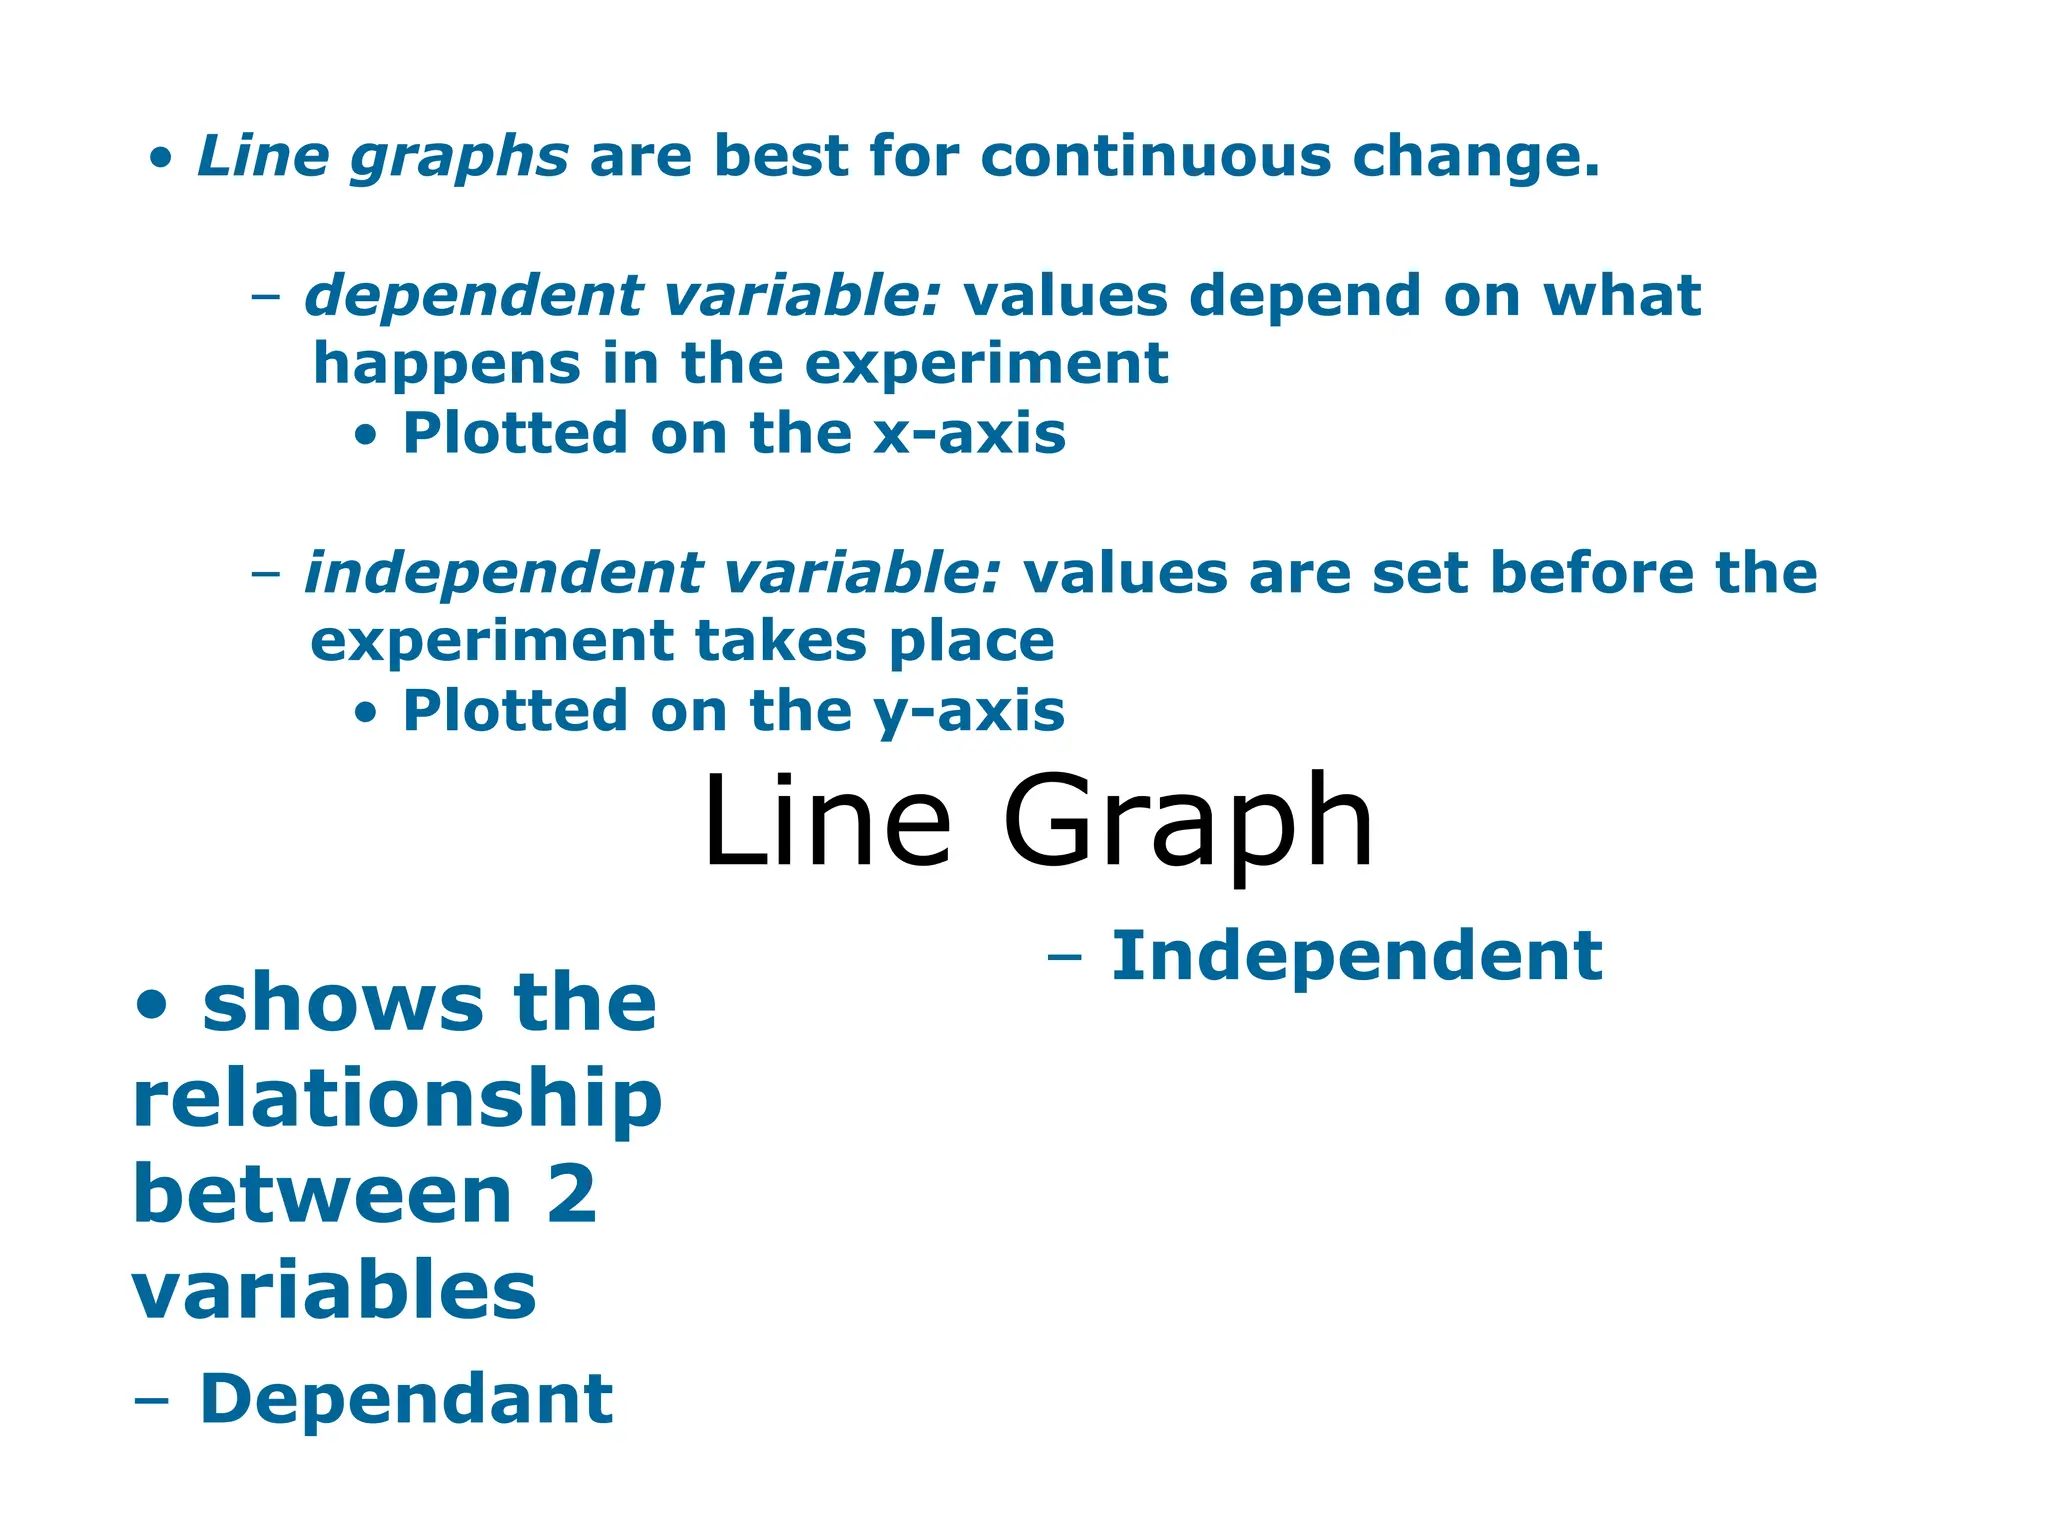
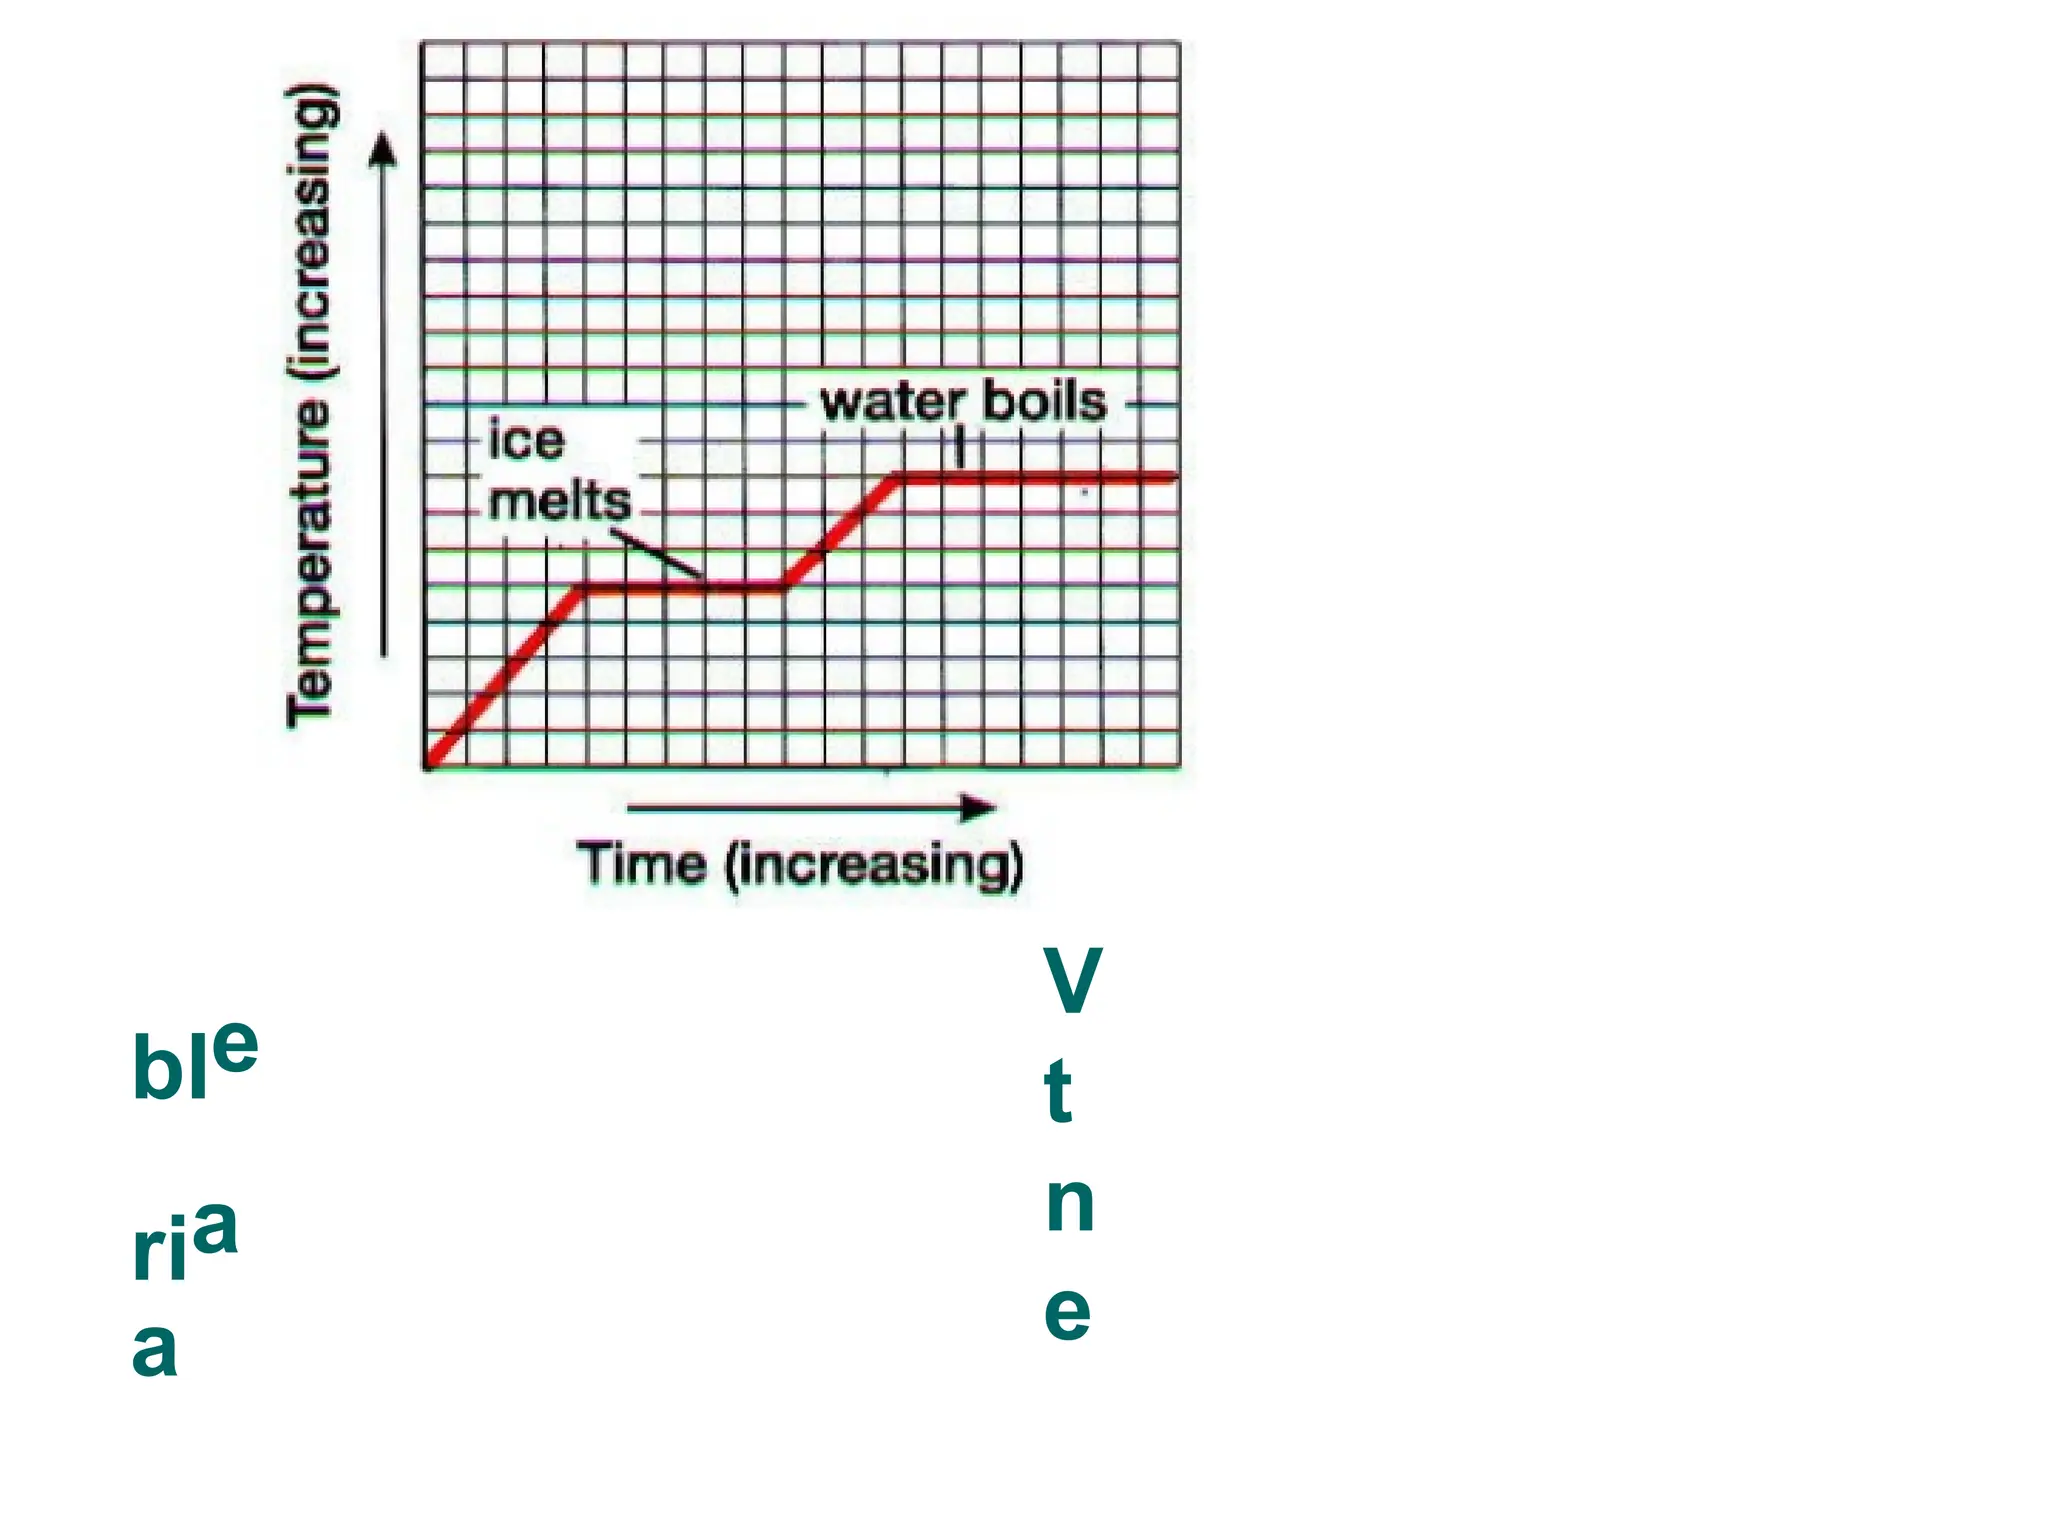
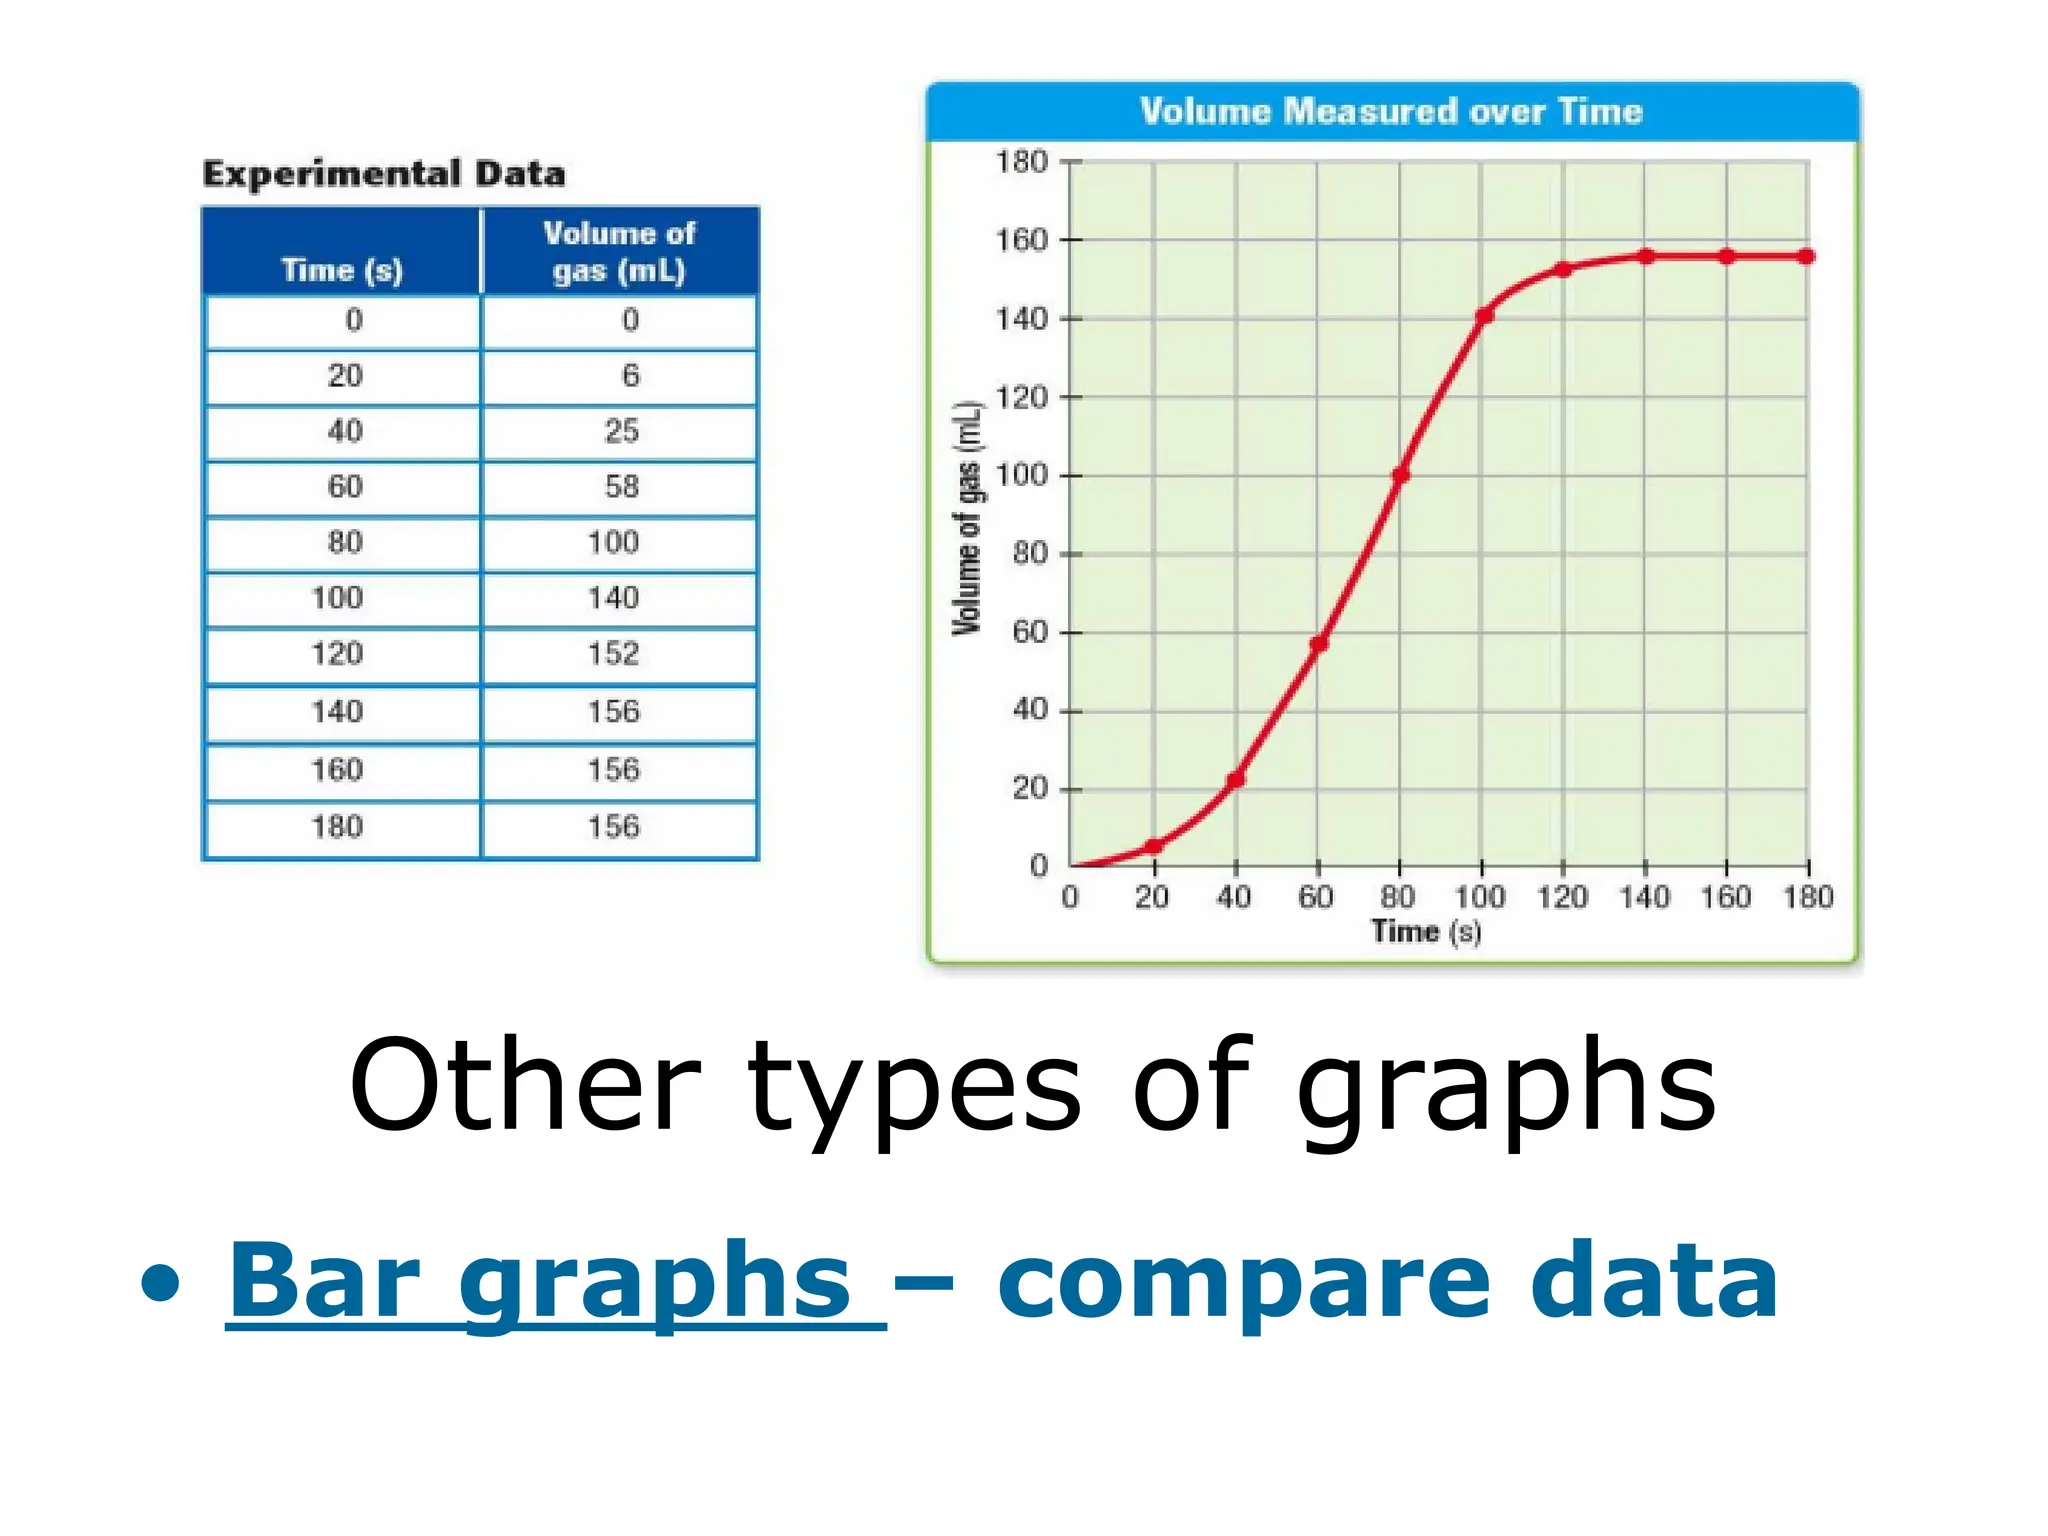
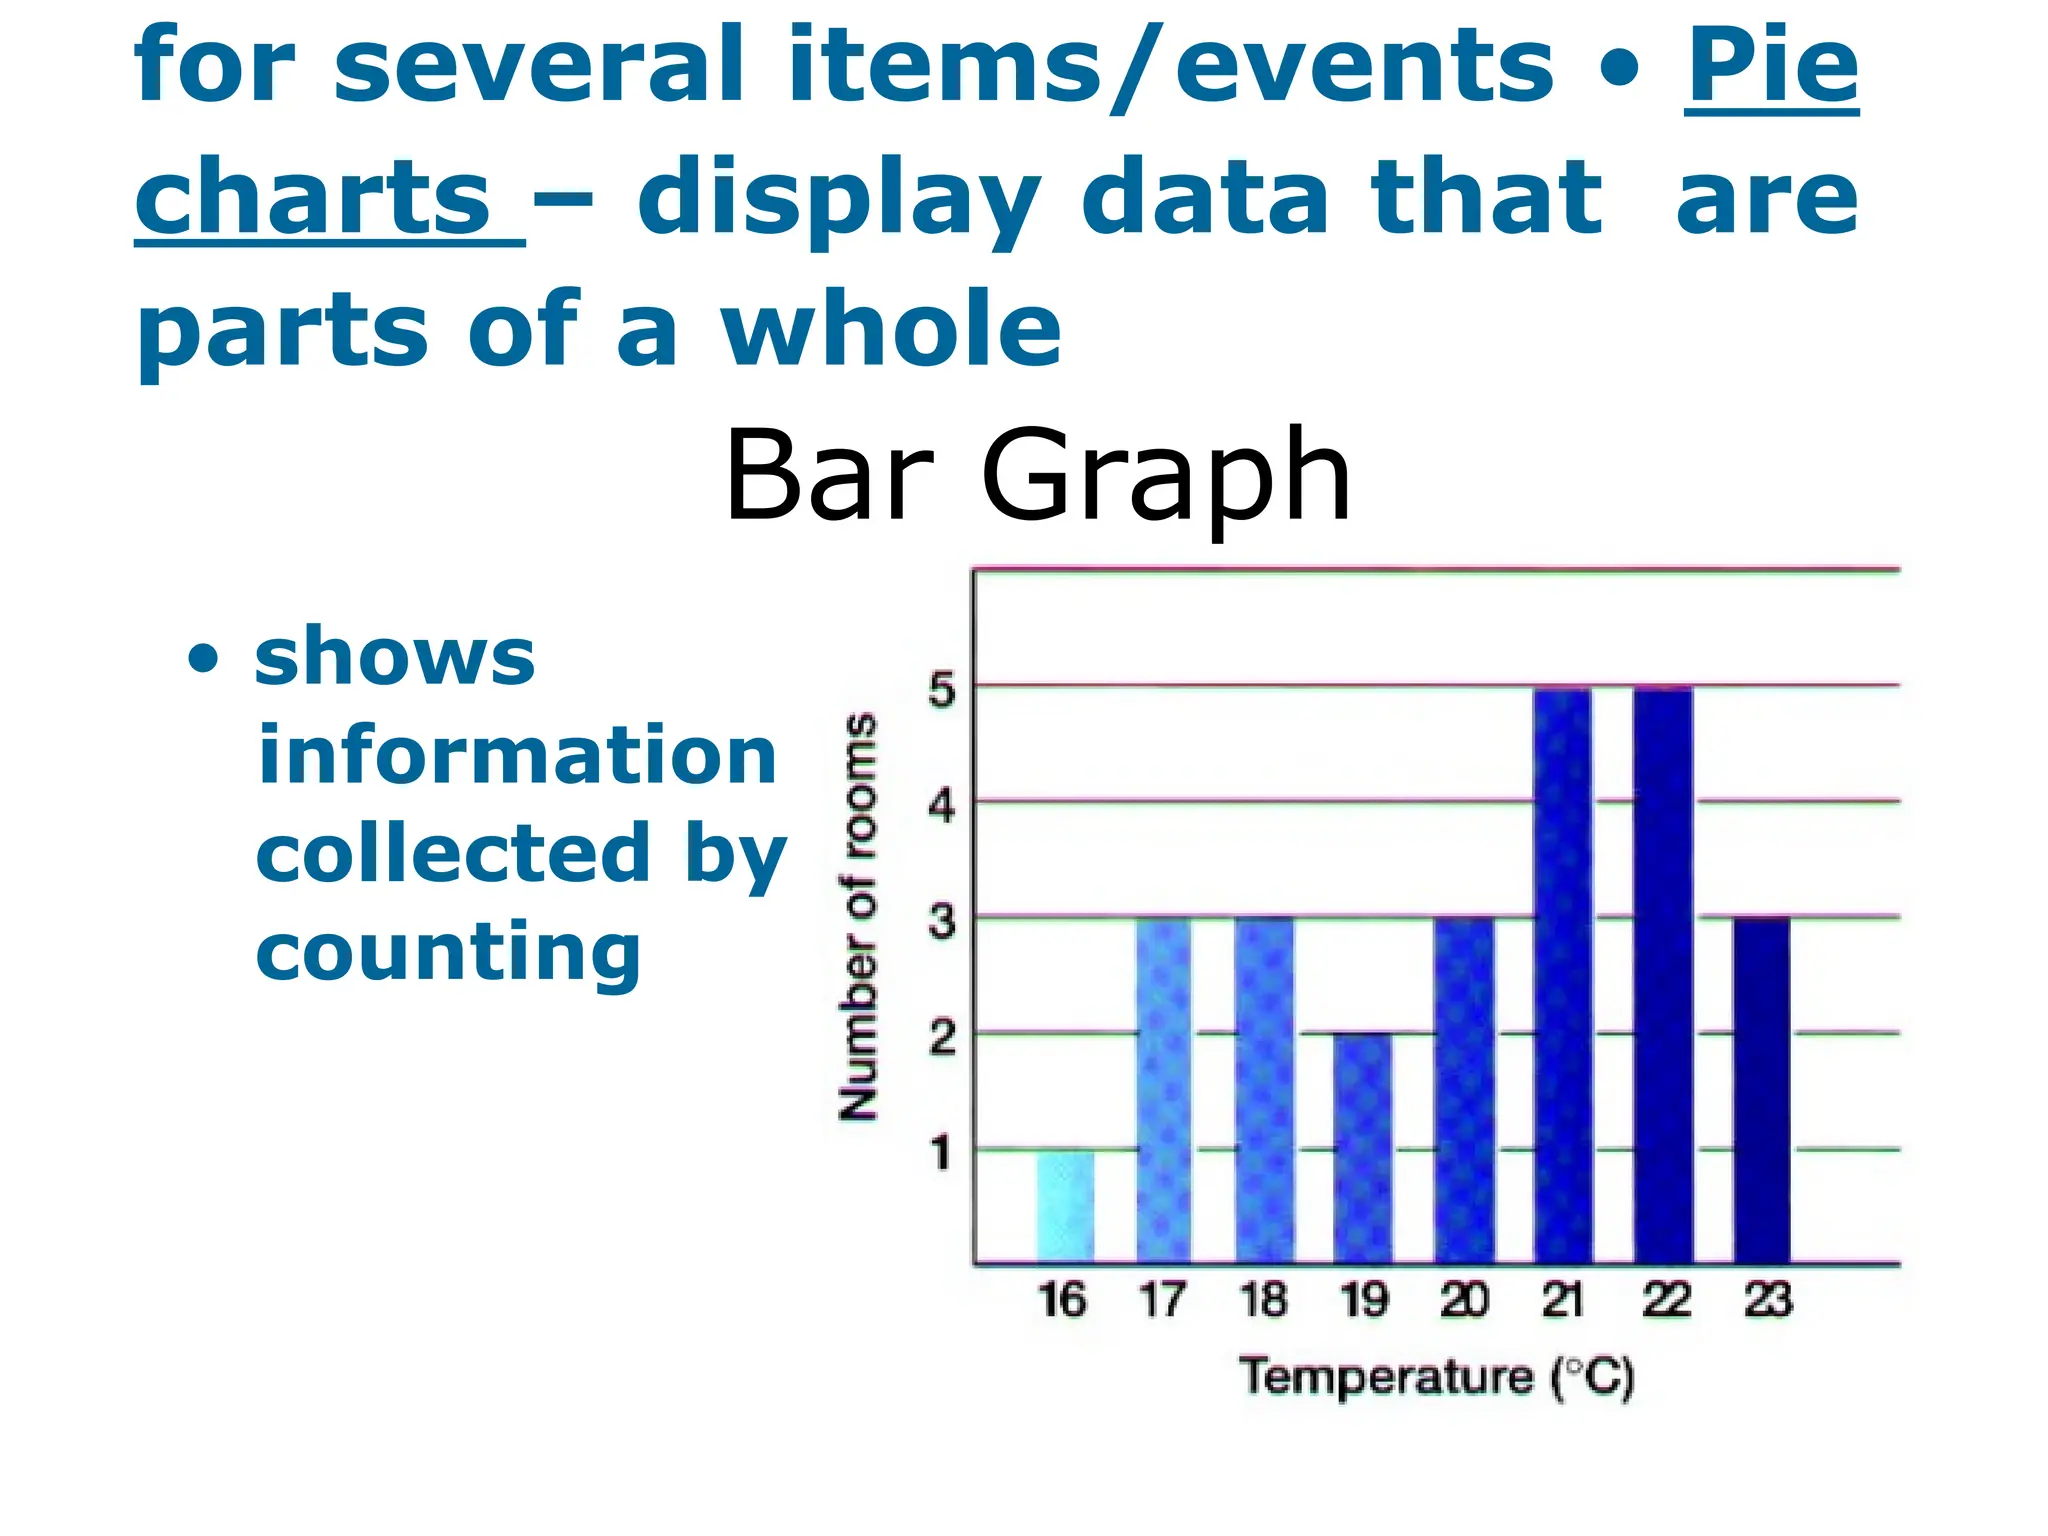
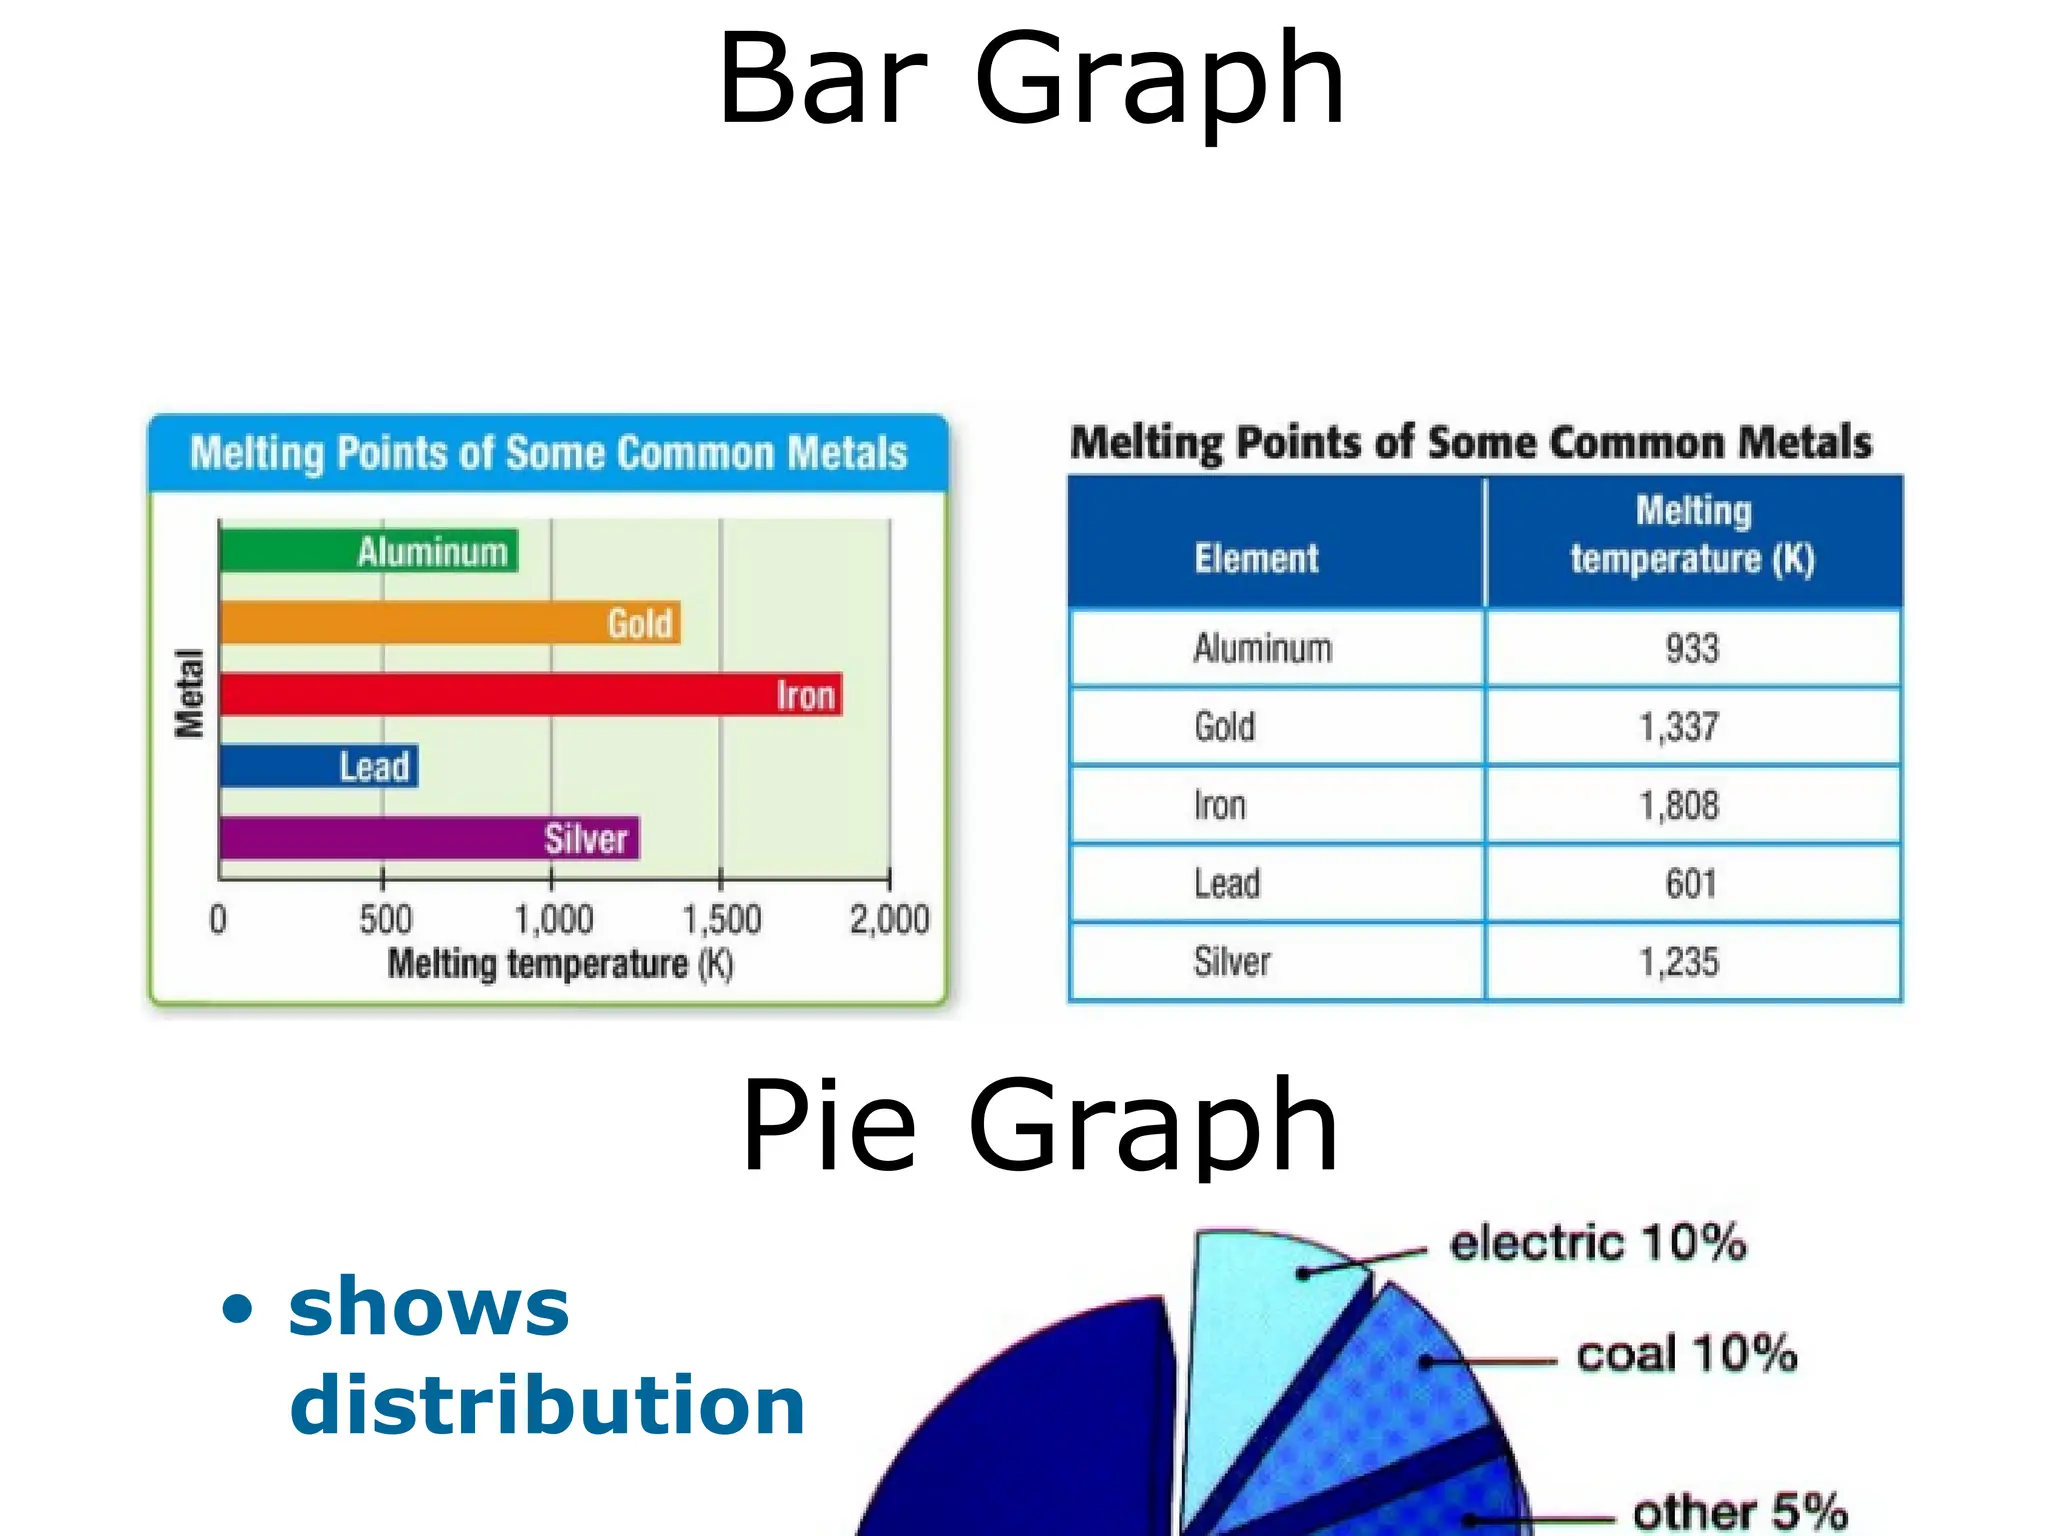
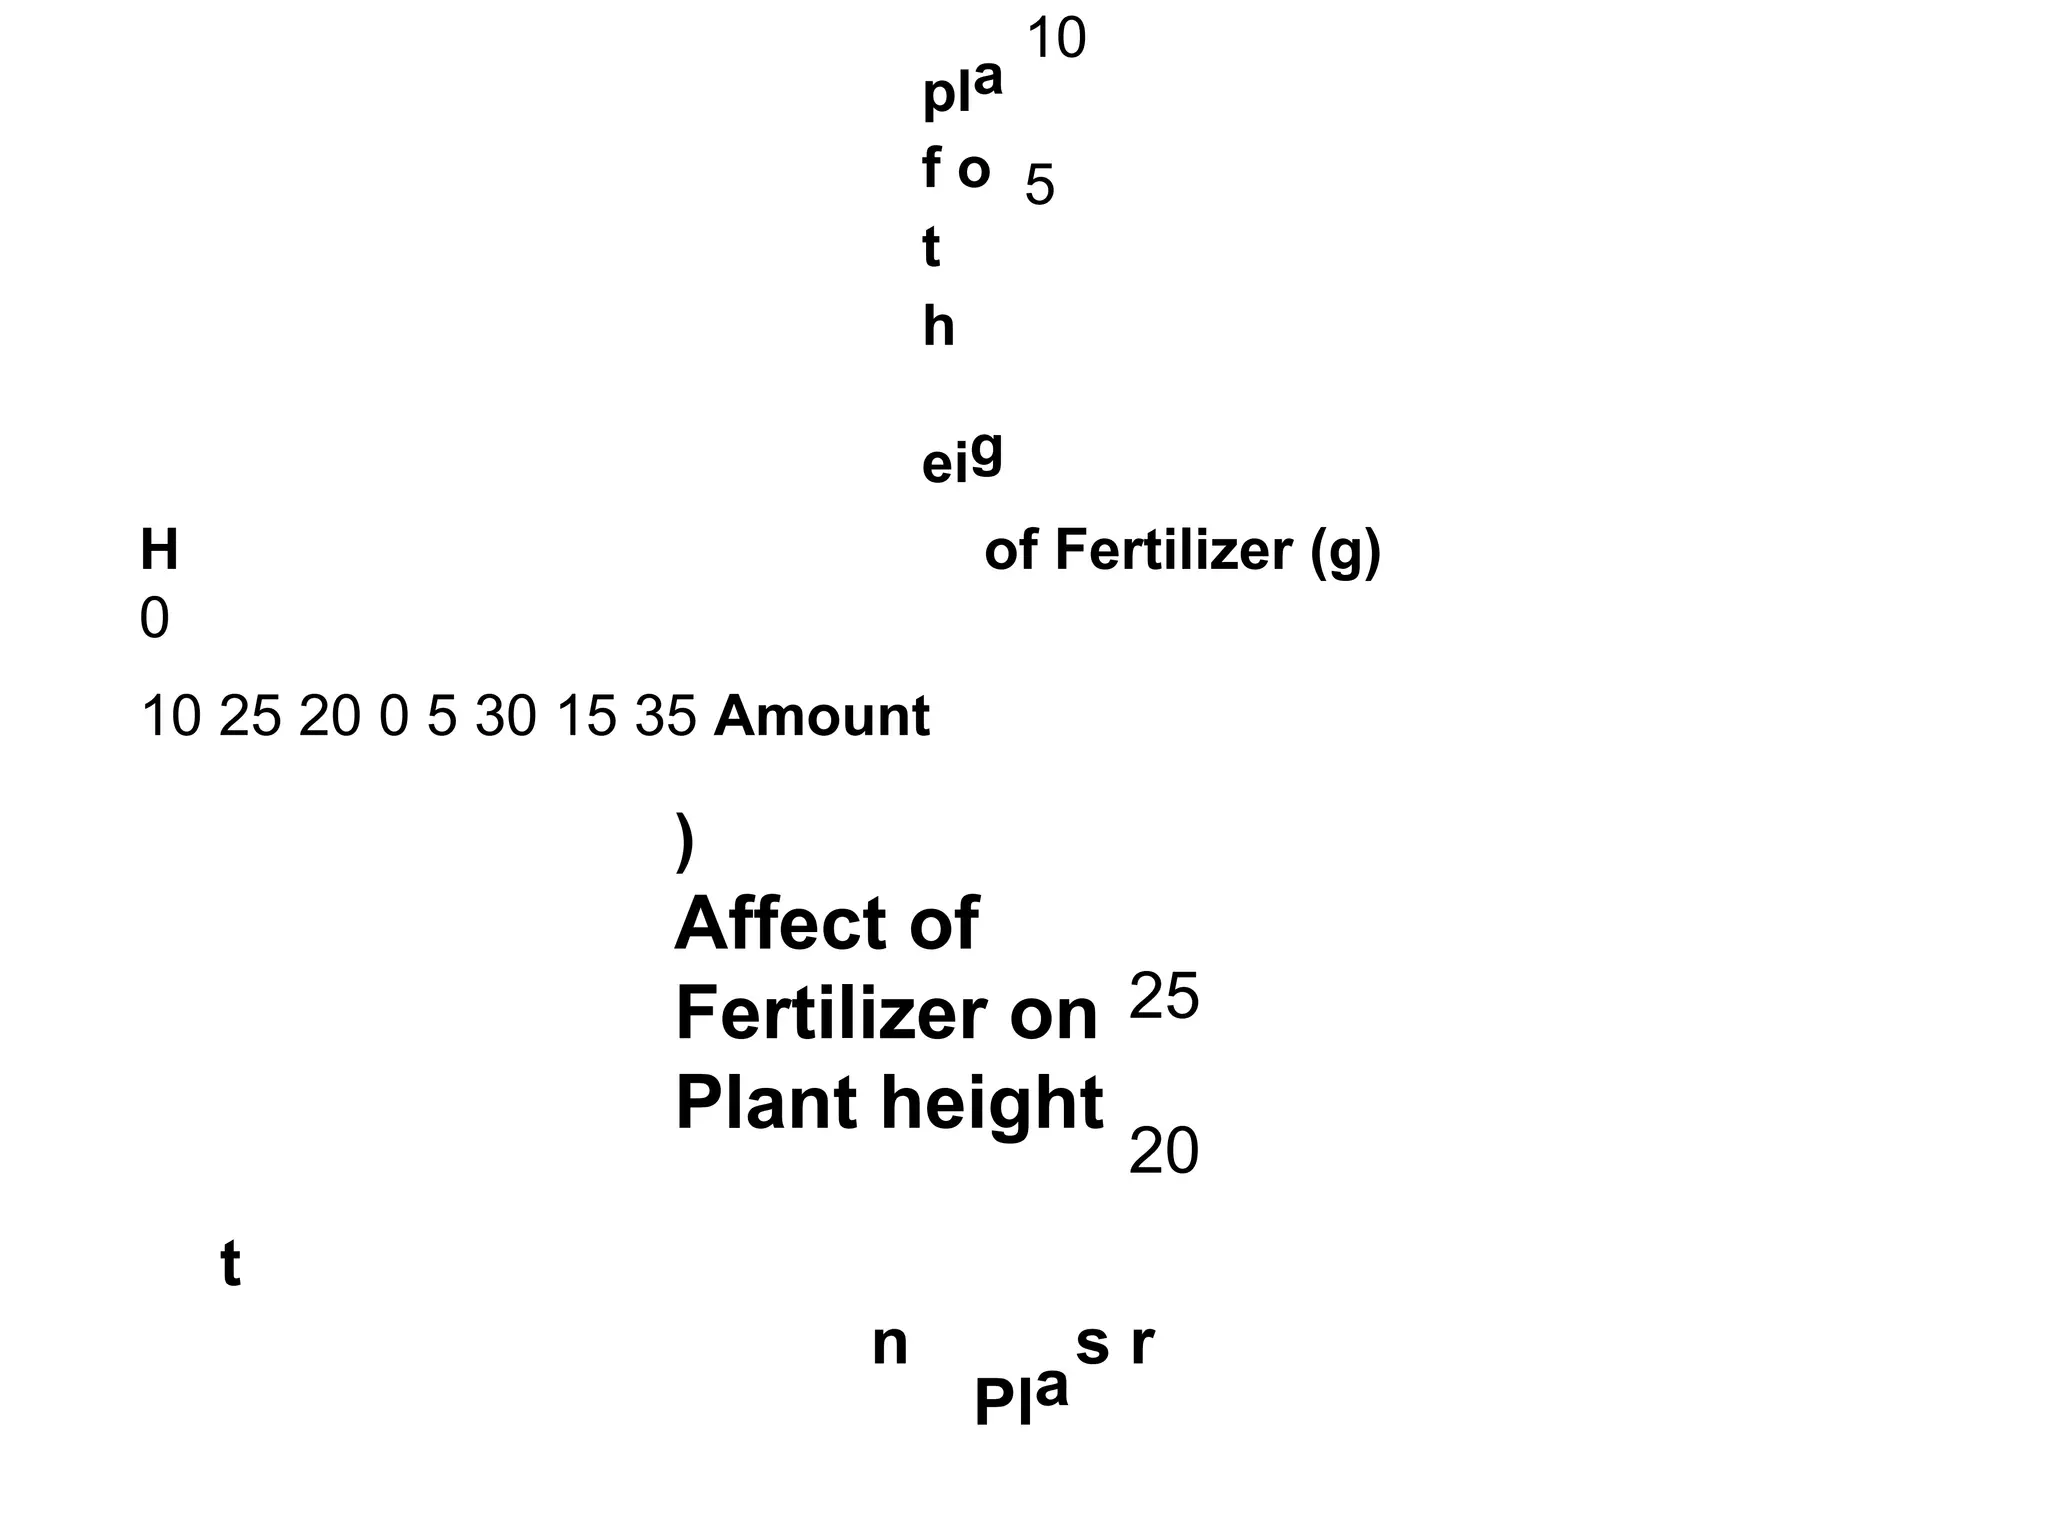
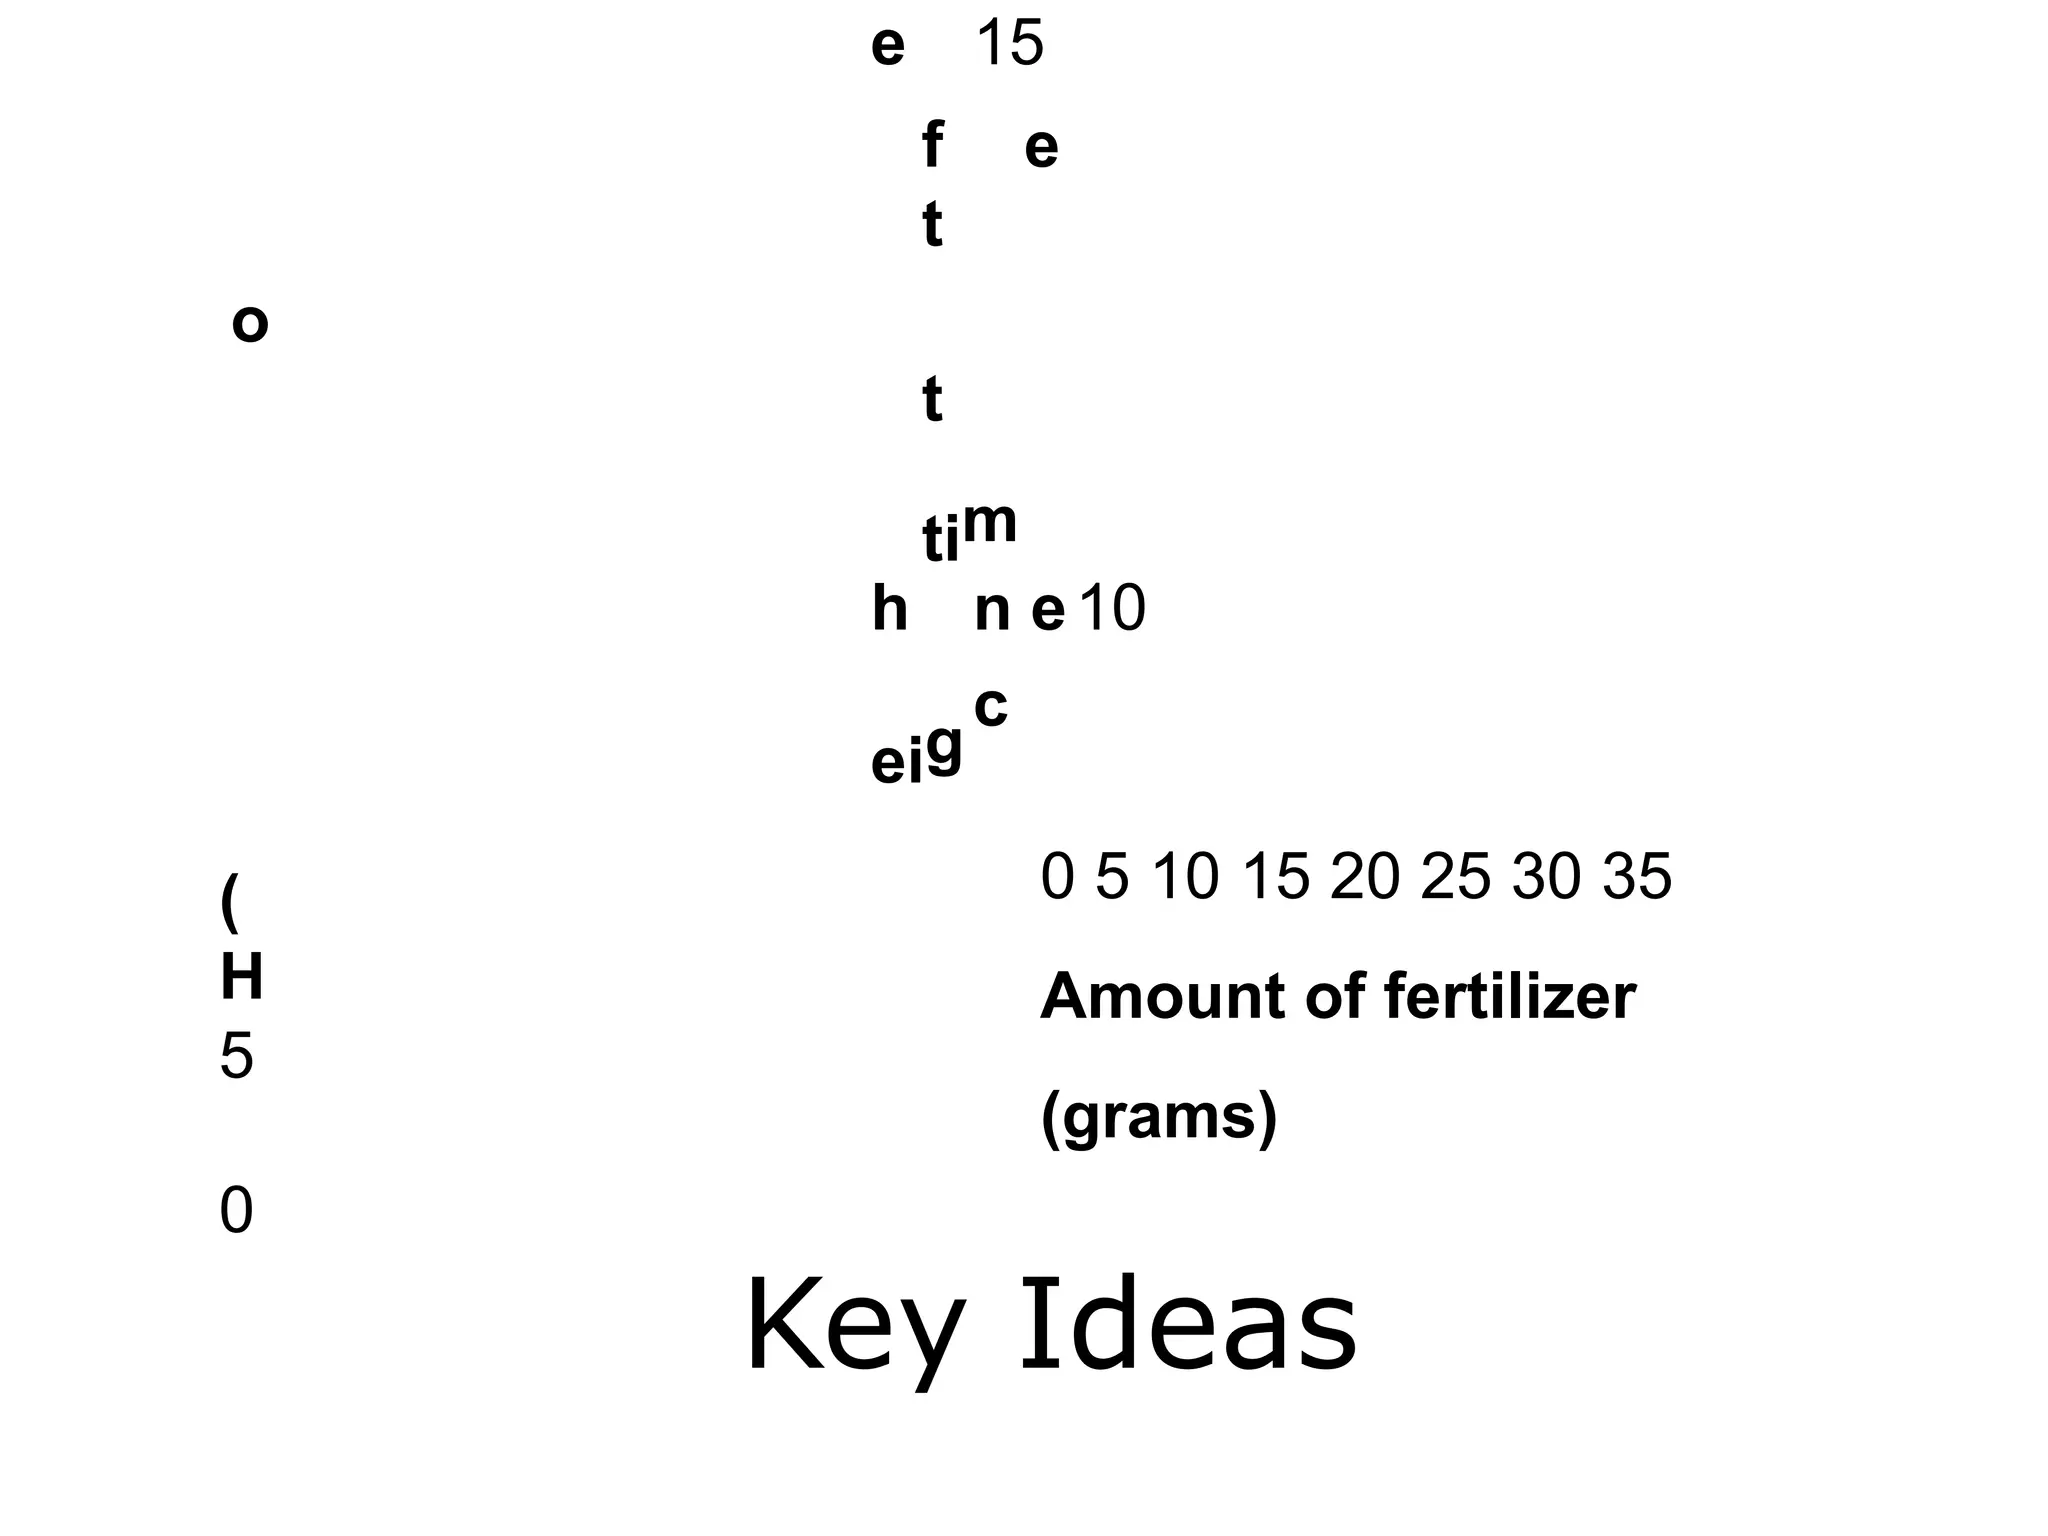
Types of Graphs
(I would take some notes
on this!)
• Line graphs – data that
change
– Independent variable – one you
set (x-axis)
– Dependent variable – changes in
response to independent (y
axis), one you measure
Presenting Scientific Data
• Line graphs are best for continuous change.
– dependent variable: values depend on what
happens in the experiment
• Plotted on the x-axis
– independent variable: values are set before the
experiment takes place
• Plotted on the y-axis
Line Graph
• shows the
relationship
between 2
variables
– Dependant
– Independent
ble
ria
a
V
t
n
e
d
n
e
p
e
D
Independent
Variable
Line Graph
Other types of graphs
• Bar graphs – compare data
for several items/events • Pie
charts – display data that are
parts of a whole
Bar Graph
• shows
information
collected by
counting
Bar Graph
Pie Graph
• shows
distribution
of parts
within a
whole
quantity
– Rarely used
for science
labs!
Presenting Scientific Data,
continued
Composition of a Winter Jacket
• Pie graphs show the parts
of a whole.
– A pie graph is ideal for
displaying data that are
parts of a whole.
– Data in a pie chart is
presented as a percent.
Presenting Scientific Data,
continued
〉Why is organizing data an important
science skill?
〉Because scientists use written reports and
oral presentations to share their results,
organizing and presenting data are
important science skills.
Bellringer
Imagine your teacher asked you to study
how the addition of different amounts of
fertilizer affect plant heights. In your
experiment, you collect the data shown in
the table below. Use this data to answer the
following questions.
Bellringer, continued
1. Which amount of fertilizer
produced the tallest plants?
2. Which amount of fertilizer
produced the smallest plants? 3.
Plot the data on a grid like the
one below.
m
c
Affect of fertilizer on
plant height
25
20
15
t in
n
pla
f o
t
h
eig
10
5
H
0
10 25 20 0 5 30 15 35 Amount
of Fertilizer (g)
t
)
Affect of
Fertilizer on
Plant height
25
20
n
Pla
s r
e 15
f
t
e
o
t
tim
h
eig
n e
c
10
(
H
5
0
0 5 10 15 20 25 30 35
Amount of fertilizer
(grams)
Key Ideas
〉Why is organizing data an
important science skill?
〉How do scientists handle very
large and very small
numbers?
〉How can you tell the precision
of a measurement?

typesofgraphs-151027144709-lva1-app6892.pdf

  • 1.
    Types of Graphs (Iwould take some notes on this!) • Line graphs – data that change – Independent variable – one you set (x-axis) – Dependent variable – changes in response to independent (y axis), one you measure Presenting Scientific Data
  • 2.
    • Line graphsare best for continuous change. – dependent variable: values depend on what happens in the experiment • Plotted on the x-axis – independent variable: values are set before the experiment takes place • Plotted on the y-axis Line Graph • shows the relationship between 2 variables – Dependant – Independent
  • 3.
  • 4.
  • 5.
    Other types ofgraphs • Bar graphs – compare data
  • 6.
    for several items/events• Pie charts – display data that are parts of a whole Bar Graph • shows information collected by counting
  • 7.
    Bar Graph Pie Graph •shows distribution
  • 8.
    of parts within a whole quantity –Rarely used for science labs! Presenting Scientific Data, continued Composition of a Winter Jacket
  • 9.
    • Pie graphsshow the parts of a whole. – A pie graph is ideal for displaying data that are parts of a whole. – Data in a pie chart is presented as a percent. Presenting Scientific Data, continued 〉Why is organizing data an important science skill?
  • 10.
    〉Because scientists usewritten reports and oral presentations to share their results, organizing and presenting data are important science skills. Bellringer Imagine your teacher asked you to study how the addition of different amounts of fertilizer affect plant heights. In your experiment, you collect the data shown in the table below. Use this data to answer the following questions.
  • 11.
    Bellringer, continued 1. Whichamount of fertilizer produced the tallest plants? 2. Which amount of fertilizer produced the smallest plants? 3. Plot the data on a grid like the
  • 12.
    one below. m c Affect offertilizer on plant height 25 20 15 t in n
  • 13.
    pla f o t h eig 10 5 H 0 10 2520 0 5 30 15 35 Amount of Fertilizer (g) t ) Affect of Fertilizer on Plant height 25 20 n Pla s r
  • 14.
    e 15 f t e o t tim h eig n e c 10 ( H 5 0 05 10 15 20 25 30 35 Amount of fertilizer (grams) Key Ideas
  • 15.
    〉Why is organizingdata an important science skill? 〉How do scientists handle very large and very small numbers? 〉How can you tell the precision of a measurement?